
You cannot possibly manage the risk in your system if you cannot identify the risk in your system.
...but there are also unknown unknowns—the ones we don’t know we don’t know. And if one looks throughout the history of our country and other free countries, it is the latter category that tend to be the difficult ones.
Donald Rumsfeld
All complex systems have risk. It is an inevitable part of all systems. It is impossible to remove all risk from a complex system such as a web application. However, examining your risk and determining how much risk is acceptable is important in keeping your system healthy.
This chapter provides an overview of what risk is and how we can identify it. It then introduces a process called risk management, which helps us to reduce the effect of risk on our applications.
Let’s now revisit the big game example from Chapter 1. Here’s a brief synopsis:
It’s Sunday—the day of the big game.
You’ve invited friends over to watch it on your new TV.
The game is about to start. And...the lights go out and the TV goes dark. The game, for you and your friends, is over.
You call the power company, and they say, “We’re sorry, but we guarantee only 95% availability of our power grid.”
The power company in this example is taking a risk. They are risking that the power won’t go off during a big game.
They even have the risk quantified (it’s 95% likely power will stay on).
The power company knows the types of things that can cause power to go out, such as a power line breaking. As such, to ensure power lines won’t break, they will typically:
· Bury them (to protect them from wind)
· Harden them (to reduce the chance a wind storm can blow them down)
· Put in redundant power systems (so one system keeps working even if another is down)
But these strategies have a cost. Is it worthwhile investing in hardened power lines? Is it worth the cost to bury them? Is the cost of the risk worth the investment in reducing the risk? These types of questions are risk management questions, and these are the types of questions we will consider in the rest of this section.
We’ll start with describing the fundamentals of risk management, including two very important concepts, likelihood and severity.
Next, we introduce a fundamental tool in tracking risk, and that is the risk matrix. We then talk about methods for risk mitigation, Game Days, and end with ideas for building applications with reduced risk.
Risk management involves determining where the risk is within your system, determining which risks must be removed and which can remain, and then mitigating the remaining risks to reduce their likelihood and severity.
When a risk triggers (or occurs), you or your system suffer a loss. This loss can be data lost by your company or a customer. It can be a lack of availability in your application by your customers. The loss can be invalid or erroneous results. Ultimately, any of these can result in your customers losing trust in your ability to manage their data and their business. This, ultimately, will cost you money.
However, you must weigh this loss against a competing aspect: what is the cost of removing the risk to prevent it from happening?
Ultimately, risk management is balancing the cost of removing a risk with the cost of having the risk occur.
Identify Risk
Your first step in managing risk is creating a list of all known risks, along with their severity and their likelihood of occurring.
We call this list a risk matrix, an example of which is shown later in this chapter in Figure 9-1.
Creating the matrix initially involves brainstorming. You can get ideas for what to put in your risk matrix from multiple sources:
· Collective wisdom of the developers
· Known high-support areas
· Known threat vectors or vulnerabilities
· Known areas where the system is incomplete or missing capabilities
· Known poor performance areas
· Known traffic spikes and patterns
· Specific concerns from business owners, support personnel, or users
· Known technical debt in your system
You will likely find that there are obvious entries in the list, but there should also be entries that surprise you. This is good. You want to uncover as many of your risk vulnerabilities as possible, and if some of them don’t come as a surprise to you, you probably haven’t dug deep enough.
Creating the risk matrix involves assigning prioritized values for the likelihood of a risk occurring and the impact (severity) of the problem that is caused if the risk does occur.
Remove Worst Offenders
After compiling your initial list, review it and identify the risk entries that are your worst unmitigated offenders. How do you know which risks are the worst offenders? Look for risks that occur often or risks that haven’t occurred yet but would cause serious problems to your system if they did. The absolute worst offenders are risks that are highly likely to occur or occur often and cause serious harm to your system. “Likelihood Versus Severity” discusses the difference between severity and likelihood and how to use this information to help manage your risks. This information will help you find your worst offenders.
Figure 9-1 shows an example risk entry that might be one of our worst offenders, “Frontend fails if user identity service is down.”
Once you’ve identified a few of the top offenders, add items to your roadmap to make sure these are addressed in a timely manner.
Mitigate
For each risk, whether or not it is among the worst offenders, brainstorm if there are things you can do that will either reduce the frequency or likelihood of the risk occurring or reduce the severity of the problem if the risk does occur. These things are called risk mitigators.
Risk mitigators can be highly valuable. You are especially looking for mitigators that will reduce the risk (either its severity, its likelihood, or both) yet are simple or inexpensive to implement.
Let’s take a look at the risk “Frontend fails if user identity service is down” (Figure 9-1). For this risk, a potential mitigation to consider is to cache user identity information so that some information may be available for the frontend to use even when the user identity service is down.
You can focus on your worst offenders, finding ways to reduce the severity of those risks. But also look at risks that you might not be able to fix any time soon. Finding mitigations that reduce the severity or likelihood of these risks can be nearly as valuable as fixing the risks altogether.
Review Regularly
The risk matrix can quickly become stale if you don’t review it regularly. You should review your risk matrix as a team at least quarterly, but perhaps monthly for very active and highly critical systems. Additionally, review it after each incident. Was the incident properly covered by a known risk?
When you review the matrix, first look for new risks that have been recently introduced or newly identified. Add new entries for these risks. Also, remove old entries for items that are no longer risks.
Then look for severity or likelihood changes. Often mitigations were helpful and managed to reduce the severity or likelihood of a risk. Or more knowledge has come forward that makes a risk either more likely to occur or perhaps more severe. This is frequently the case if a risk actually triggered since your last review; you might feel that a risk marked as a low likelihood that actually did occur should perhaps be restated as a risk with a higher likelihood. Now, are there risks that you can remove (fix) by putting them on your roadmap?
Finally, look for new or updated mitigations that you can put into play.
Managing Risk Summary
How do you manage risk in your systems? There are some basic steps to follow to accomplish it:
Identify risk
First, make a list of all your known risks in your system; this list is called a risk matrix. Prioritize the list.
Remove worst offenders
Find the biggest offenders in the list, and put a plan together to tackle them.
Mitigate
For the major risk items that you cannot remove, put together a mitigation plan to reduce the severity of the risk or its likelihood of occurring.
Review regularly
Review your risk matrix regularly.
Likelihood Versus Severity
It is important to understand the relationship between severity and likelihood. Managing risk involves knowing when you need to be concerned about severity and not likelihood, or vice versa. Understanding the difference is essential in analyzing the seriousness of risks to your system.
We treat all risks as being composed of two components:
Severity
The cost if the risk happens (for example, what is the impact if customers don’t have power?).
Likelihood
The chance of the risk happening (for example, how likely is a big windstorm?).
Managing risks is managing these two values. You can reduce the severity of a risk or you can reduce the likelihood of it happening. For any given risk, you don’t need to do both. But considering both is important to understanding the best path forward in managing risks.
The significance of a risk is the combination of the severity of the risk happening with the likelihood of it happening. To successfully manage risk, you must consider both of these values and how they relate to each other. To reduce risk, you need to reduce at least one of these two values for any given risk.
The best way to understand the difference is by looking at examples of various risks and how their likelihood and severity differ. We’ll use the following sidebar throughout the remainder of this chapter to help explain the differences.
ONLINE T-SHIRT STORE
Let’s assume that we are managing an online T-shirt store. This store is your typical online retailer. It provides a listing of T-shirts available; individual pages that show the details of each T-shirt, including pictures of what they look like; and an order processing system that customers can use to purchase and pay for T-shirts that they want shipped to them.
Now let’s look at some example risks for this store.
The Top 10 List: Low Likelihood, Low Severity Risk
Using our T-shirt store example, let’s assume that the site has a feature that appears on the upper-right side and shows the top 10 best-selling T-shirts. Visitors on the site can see these best sellers and then click to go to and purchase one of them quickly and easily.
Now, what happens if the top 10 list can’t be generated for some reason (perhaps due to a service failure)? If it can’t be displayed, let’s instead assume a static list of T-shirts is displayed, but those shirts displayed aren’t necessarily the current top 10 best sellers. This service failure doesn’t happen often, because the top 10 list is easy to generate and doesn’t tend to have any problems.
What is the risk to our store for having a top 10 list displayed?
Let’s look at this risk:
· The likelihood of the risk is low because the service that displays the list is apparently quite reliable (I stated the list is easy to generate).
· But if the list does not appear, how severe is the problem? I stated that if the top 10 list doesn’t appear, an alternate list is shown. Although not ideal, the impact on our customers is probably quite low, and the impact on our business would likely not be very large, either. As such, the severity of this risk is also low.
· This risk is a Low/Low Risk. This means it has a low likelihood and a low severity.
Risks like this are easy to ignore and typically do not need further attention, because they are rare events and the events themselves have very little negative impact.
The Order Database: Low Likelihood, High Severity Risk
Again using our T-shirt store example, let’s assume that your list of orders is stored in a typical database. Whenever a customer generates an order, an entry is created in the database. As you process, collect payment on, and ship these orders, you update the data in the database. Later, the data is used to generate financial reports that you can use to show how much business you are doing for purposes such as business planning and tax calculations.
Because the database is important, you run it on high-quality hardware with replicated system components (such as a RAID disk array). You also do regular backups of the data.
However, the database is still a single point of failure. The database contains significant amounts of business-critical data, and your website can’t function (you can’t even take any orders) if the database is not available. Losing the database would be a big loss.
What is the risk to our store associated with the order processing system’s database?
Let’s look at this risk:
· The likelihood of the failure is quite low, because you are using high-quality, replicated hardware for the database. The database is quite reliable.
· However, the severity of a failure in the database would be quite high. This is because if the database does fail, your entire order-processing pipeline will be down, and you risk losing business-critical data.
· This risk is a Low/High Risk. This means it has a low likelihood and a high severity.
· Risks like this are easy to miss because they do not happen very often (likelihood is low). However, they can be very expensive risks if they are ignored because the cost of failure is very high.
Given the high severity of this risk, you might want to look at mitigating its severity.
For example, you might want to have a hot database replica standing by, so that you can quickly flip from the broken database to the hot replica. This will let you continue working without significant loss of time or data. Alternatively, you might want to switch to a database technology that distributes data across multiple servers so that you can continue to function even if one of your database servers fails.
Using one of these techniques might very well reduce this risk from a Low/High Risk to a Low/Medium Risk (low likelihood, medium severity) or even a Low/Low Risk (low likelihood, low severity).
Mitigations such as this, which can dramatically reduce the severity of a problem, are discussed further in “Risk Mitigation”.
Custom Fonts: High Likelihood, Low Severity Risk
Continuing with our T-shirt store example, suppose that you decide to spruce up your site a bit by using custom fonts in all of your text and descriptions. You’ve found the perfect font to use, and it is provided (and hosted) by a third-party font service provider. To use the font, your customer’s web browser downloads it directly from the third-party service provider. If the custom font is not available, a standard system font is used and the page looks like it did previously.
However, you’ve noticed this font service provider has problems on occasion, much more often than you’d like. When this service provider has a problem, your customers can’t use the beautiful custom font.
This happens a lot, unfortunately.
What is the risk to your store of using the beautiful custom font?
Let’s look at this risk:
· The likelihood of the font not appearing is high, because the service provider is inconsistent and has problems often.
· However, when the problem does occur, your site continues to work—it just doesn’t look quite as spruced up as you’d like. Hence, the severity of the problem is low.
· Your site might be missing some of its glitz, but it is fully functional without significant problems.
· This risk is a High/Low Risk. This means it has a high likelihood of occurring but a low severity.
Mitigations for this risk involve reducing the likelihood of the problem occurring.
You can reduce the likelihood of this problem occurring by working with the third-party provider to improve the availability of the service. Or you can compile a list of backup providers that offer the same font or similar fonts, and switch to them if the first provider doesn’t work. These are ways you can reduce the likelihood of the problem occurring.
There is not much you can do to reduce the severity, given that it is already quite low.
T-Shirt Photos: High Likelihood, High Severity Risk
Let’s now consider the T-shirt images (pictures) that appear on your site as a final example. These are an incredibly important part of your store because people are typically not going to buy T-shirts if they can’t see what they look like. If your T-shirt images do not appear, your customers will leave your site and you’ll lose orders.
However, the server on which you are hosting your images is flaky. It goes in and out of service and seems to be having problems reading images from its disk. The server is old and needs to be replaced. It fails often and needs to be rebooted regularly. It goes out of service for parts replacement constantly. Yet this is the server used to host your images.
What is the risk of your site becoming unusable because the images are not available?
Let’s look at this risk:
· The likelihood of the images not displaying is high because the server is flaky and fails often.
· The severity of this risk is also high, because if the images aren’t available, your customers will go away and not place orders.
· This risk is a High/High Risk. This means it has a high likelihood of occurring (the hardware fails often) and it has a high severity when it does occur (customers won’t buy from you).
These types of risks are the most scary. This is a risk that is highly likely to happen, and the problem it introduces is serious to your business.
These are the risks to which you should pay the most attention.
This example might seem obvious, but there likely are many such High/High Risks in your applications. Often, though, these risks might not be obvious until you look closely at your system. This is why risk management is so important.
The Risk Matrix
The first step in managing risk is understanding the risk that is already in your system. Identifying, labeling, and prioritizing your known risks is what the risk matrix is all about.
The risk matrix is a critical aspect of managing the risk in your system. It is a table that contains a living view of the state of all the known risks in your system.
Figure 9-1 contains an example risk matrix.

Figure 9-1. A risk matrix (see the following list for details)
Each row in the matrix represents a single quantifiable risk that is present in your system. The columns in the spreadsheet contain the details of that specific risk item.
For each risk item the following information is kept:
Risk ID
This is a unique identifier assigned to the risk. It can be anything, but a unique integer identifier is usually the easiest and is sufficient.1
System
This is the name of the system, subsystem, or module that contains the risk. This information is dependent on the specifics of your application, but it could be “FrontEnd,” “PrimaryDb,” “ServiceA,” or something similar.
Owner
The name of an individual (or a team) who owns this risk and is responsible for mitigation plans and resolution plans.
Risk description
This is a summary description of the risk. It should be short enough to be easily scanned and recognized yet long enough to uniquely and accurately identify the risk.
Date identified
The date the risk was identified and added to the matrix.
Likelihood
This identifies the likelihood (low, medium, or high) of the risk occurring. This value is discussed in greater detail in “Likelihood Versus Severity”. You will use this value to sort your risk matrix to determine which ones you should be the most concerned with and which ones require the most immediate attention.2
Severity
This is the severity or impact (low, medium, or high) of the risk occurring. This value is discussed in greater detail in “Likelihood Versus Severity”. You will use this value to sort your risk matrix to determine which ones you should be the most concerned with and which ones require the most immediate attention.
Mitigation plan
This column provides a description of any mitigations that can be used, or are being used, to reduce the severity or likelihood of this risk.
Status
This column indicates what the status of the risk is. This is typically something like “active,” “mitigated,” “fix in progress,” or “resolved.”
ETA
This is the estimated time for when the final resolution for this risk is planned (if known).
Monitoring
This column indicates whether you are monitoring for this risk to occur, and if so, the steps you’ve taken to accomplish this. If you are not monitoring the risk, you should indicate why and estimate a date for when you will be able to do so.
Triggered plan
If this risk does occur, what is your plan for dealing with it? The triggered plan is usually a management-level plan rather than an incident-response plan.3
Comment
Use this column for any other information about this risk that doesn’t fit or doesn’t belong in the risk description.
Additionally, other values that are important to your organization can be added as you see fit. For example:
Tracking ID
If you have a bug tracking or roadmap tracking system that contains an entry for this risk, you can put the bug or roadmap tracking ID number in this field.
History
Has this risk already triggered in the past? When? How often?
Scope of the Risk Matrix
At this point, you’re probably wondering, “Should I have one risk matrix for the entire company, or one for each team or service?”
This is a good question. One matrix for the entire company is fine for a small company, but it can quickly become unwieldy. One per service affords good visibility at the service level but results in reduced visibility at the company level. Questions such as “Which service has the most significant risk to the company?” become hard to answer.
I recommend one risk matrix per team. Because decision making on what features or issues to work on and their prioritization is often handled at the team level, it makes sense for the risk matrix to be managed and prioritized at the team level. You can find more information about team-level management in Chapter 6.
Bottom line, you should scope your risk matrices as makes sense for your organization. As such, one risk matrix should be used for each team, group, or organization that typically manages its own decisions about work scoping and prioritization. They may receive input and guidance from upper management, but most work is prioritized and executed at this organizational level.
Creating the Risk Matrix
First, begin with one of the risk matrix templates. We have created some for you in the most popular spreadsheet programs. They are available for download on our website at www.architectingforscale.com.
Although you are free to customize the template as needed, for your first risk matrix you should stick as closely as possible to the original template. After you have some experience using the matrix and managing risks, you can customize as you see fit.
The template has an example risk on it to demonstrate how you might use it. Feel free to delete that before continuing.
Brainstorming the list
When you have your template ready, your first step is to brainstorm a list of the risks you feel should be included. Try to include any risk you can think of, not just those that you are concerned about. Don’t analyze them during this process—just brain dump all that you can think of.
There are several good sources of insights for this brainstorm:
Dev team
Have a meeting with your development team. The team members will have an amazingly large number of worries on their mind about their services. Listen to their concerns, and add risk items for each one that comes up.
Support
Look at your support volume. Are there areas where you are seeing a higher than normal support load? What do your support people say? Do you have support forums you can review? High support areas are a common source of system risks.
Threat vectors
Think about known threat vectors and security vulnerabilities. Each of these, no matter how big or how important, is a risk to your service.
Feature backlog
Go through your feature backlog. Are there capabilities of your system that are missing and critical to the health of your system? Look especially for monitoring- and maintenance-related backlog items.
Performance
Think about the performance of your system. Are there areas you are aware of that have poor performance?
Business owners
Talk to your business owners. What concerns do they have?
Extended team
Talk to your extended team, including internal users, dependent teams, Q/A staff, and so on. What concerns do they have?
Systems and processes
Do you have documented systems and processes in place? Are there places where necessary documentation for how your application functions is missing, or perhaps is held only in the heads of a few individuals?
Technical debt
Do you have known, specific technical debt in your system? Examples of technical debt include areas of code that are hard to understand or are more complicated or have more moving pieces than are necessary. Areas of known technical debt are almost always risk items.
You will likely find that there are obvious entries in the list, but there should also be entries that surprise you. This is good. You want to uncover as many of your risk vulnerabilities as possible, and if none of them come as a surprise to you, you probably haven’t dug deep enough.
Set the likelihood and severity fields
Now, go through the list and set the likelihood and severity fields for each item. Use Low/Medium/High values (or a similar variation) for each of the two fields.
Make sure to keep the concepts of likelihood and severity distinct in your mind. Refer to “Likelihood Versus Severity” if necessary. It is often very easy to confuse them as you are working on this step.
It might be helpful to go through and set likelihood first, and then go back and set severity for each item. Remember, it’s quite normal for a risk item to be very severe if it occurs, but almost impossible to occur (or, alternatively, very common to occur but not very important if it does occur). You will end up with items in all combinations of Low, Medium, and High states. This is normal and expected.
However you decide to do this task, you will not end up with a meaningful list if you confuse these two values.
Another brainstorming session with your development team is a great way to accomplish this task. This should be a distinct brainstorming session from the aforementioned session, which identifies the risks. Don’t label them at the same time that you identify them.
Risk item details
Now, fill in the other basic details of the risk matrix. This includes things like System, Owner, Date Identified, and Status. Make sure to assign a risk ID to each item (a simple numbering from 1...n is reasonable).
Are you monitoring for this risk? Indicate in the Monitoring field whether you have the ability to be notified if this risk is triggered.
Mitigation plan
Starting with the highest severity items first, begin to put together mitigation plans for each item. Then move on to the highest likelihood items.
A mitigation plan is a plan for how you are going to, now or in the near future, put in changes that are designed to either reduce the severity of the risk or reduce the likelihood. A mitigation plan is not designed to remove the risk—instead, it simply reduces the severity or likelihood.
After you perform the steps indicated in the mitigation plan, it will be expected that the severity or likelihood will reduce, and this mitigation plan will be removed. A new mitigation plan can be introduced, if appropriate.
You do not need a mitigation plan for every item in the matrix. There might be items that clearly must be fixed and cannot be mitigated. Additionally, Low Likelihood/Low Severity items do not need to be mitigated.
Triggered plan
A triggered plan is a plan for what you are going to do if the risk actually occurs. This can be something as simple as “fix the bug,” but it can also be more elaborate. For instance, if a risk occurs, are there tasks you can undertake right then that will reduce the impact? If so, they should be elaborated as part of the triggered plan.
Starting with the items with the highest severity first, begin to put together trigger plans for each item.
NOTE
Note that the triggered plan should not be seen as a replacement for incident-response documentation, such as playbooks. The risk matrix should not be a tool that must be consulted during an incident response. Instead, the matrix (including the triggered plan) should be a tool used by management to determine follow-up actions for the risk occurring.
Using the Risk Matrix for Planning
After your risk matrix is created, it should be consulted during all planning sessions. This includes not only long-range planning sessions with product management but also SCRUM-level planning sessions with your engineers.
During every planning session, the most critical risks should be examined.4 The following questions should be asked:
· Is this risk worse now than the last time I examined it?
· Should we schedule work during this planning period to remove (fix) risks in our system?
· Should we schedule work during this planning period to mitigate risks in our system and hence reduce their likelihood or severity?
Every planning session should include a review of the risk matrix, and items on the risk matrix (either fixing risks or mitigating risks) should be included in your work prioritization process.
If your team makes use of a tool such as Jira or Pivotal Tracker during your planning sessions, you might want to add items in your tracking tool for the most critical risks. If you do that, you should refer to the Risk ID of the corresponding risk in your tracking tool item, and also add a Tracking ID column to your risk matrix to store the ID of the item from your tracking tool.
Maintaining the Risk Matrix
The biggest challenge with the risk matrix is that it is very easy for the matrix to become stale. Your natural tendency is to create the matrix and then put it into a drawer and forget about it.
If you do not take time to maintain your risk matrix, it will rapidly become out of date and useless.
To keep your risk matrix up to date and accurate, you should schedule regular reviews of the matrix with the appropriate stakeholders, including your development team and partners. This can be monthly, but it should not be any less often than quarterly. The exact recurrence cycle depends on your business processes. If you have a planning cycle starting soon, performing a regular review of the matrix before that process begins is ideal.
RISK MATRIX REVIEW ATTENDEES
Note that it is useful to change your risk matrix reviewers regularly.
By requiring different individuals to review and comment on your risk matrix, you’ll get a fresh perspective, and the review will be less likely to turn into a “same old rut” type of meeting.
During this review, you need to:
Look for new risks
Have there been new risks added to your system or recently identified? Make sure these are captured on the risk matrix.5
Remove old risks
Are there risks on the matrix that no longer apply—either because they can’t occur anymore or because the underlying cause has been fixed? If so, remove these.
Update likelihood and severity
Look for likelihood and severity changes. Often, recently implemented mitigations were helpful in reducing the likelihood or severity, or additional information has been gathered that will warrant a change in the likelihood or severity status. Make these updates.
Review top risks
Review all the risks that are either high likelihood or high severity (or both). Discuss these specific risks individually and make sure all the information is correct for them. Are there new or updated mitigation plans that can be put in place? What about triggered plans? Are you monitoring the risk? If not, why not? What else can you do to improve your situation with these risks?
Review less critical risks
Keep going down the likelihood and severity curve, looking at less critical risks as time permits. You do not have to review every risk every time, but make sure the top risks are all looked at often. In addition, you might want to schedule a session to examine in detail the less critical risks, just so they don’t get ignored and to make sure there aren’t hidden or missed reasons why they should be ranked higher on your list.
SHARING YOUR RISK MATRIX WITH MANAGEMENT
You should share your risk matrix with your product management and upper management teams. This can be an effective tool for communicating issues with those not directly involved day to day with your team, and for keeping specific issues on the minds of those that need to know them.
One idea I saw implemented recently occurred before a management offsite meeting. Someone was identified to take all the risk matrices for the entire company and combine them into one giant list for the offsite (a read-only copy). Then only the high likelihood or high severity items were kept; the rest were deleted. This master “High/High” list was then used during the management offsite as a way for discussing overall company risk with their products, as well as a way to level set expectations of what types of things different teams put into their matrices and to learn best practices.
Risk Mitigation
The mitigation column in the risk matrix is used to show what mitigations can be used or are being used to reduce the severity, the likelihood, or both values for a given risk. It is all about taking a High/High Risk and changing it to a High/Medium Risk or a Medium/High Risk.6 It is not about fixing the risk, only mitigating the severity or likelihood of the risk.
There is a basic process that you can follow for mitigating risks. A mitigation plan details the steps you are going to take (either immediately or in the near future) in order to reduce the likelihood or severity of the risk.
Risk mitigation is knowing what to do when a problem occurs so that you can reduce the impact of the problem as much as possible. Mitigation is about making sure your application works as well and completely as possible, even when services and resources fail.
Let’s look at an example of a mitigation plan. Let’s assume that we have a database that is used for an application. Let’s further assume that we already run the database on high-quality hardware with replicated components, such as using a RAID disk array, and server-grade redundant hardware. We believe our database is highly stable and highly available. On our risk matrix, we have the risk of a database failure as having a Low likelihood.
However, the database is still a single point of failure. If the database server fails (unlikely though that is), your entire system goes out of service. On our risk matrix, we would list this as a High severity.
This risk is a Low/High Risk, and is very similar to the risk described previously.
What can we do to mitigate this risk? Well, one idea is to add multiple active database read replicates and have them available on hot standby, as shown in Figure 9-2. If our main database server ever fails, having an active database standby ready to go will dramatically reduce the amount of time your system is down while the problem is being fixed. This reduces the severity of the risk, perhaps even making it a Low/Medium Risk.
This is a mitigation plan.
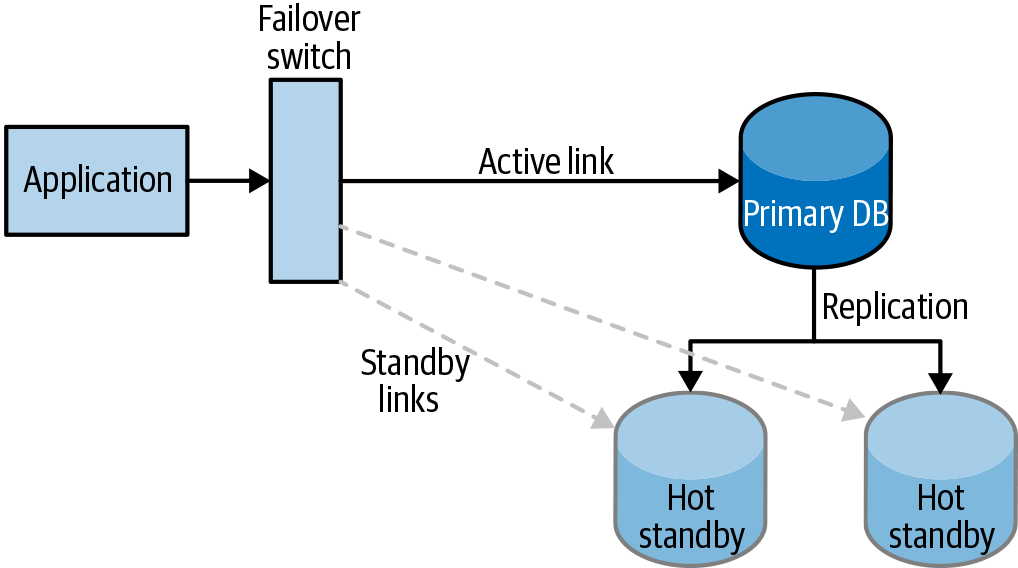
Figure 9-2. Example database hot standby for risk mitigation
What’s the difference between risk mitigation and risk management? They are similar but different concepts:
Risk mitigation
Risk mitigation is about reducing the impact of a risk by either reducing the likelihood that the risk will occur or reducing the severity of the problem if the risk does occur.
Risk management
Risk management is understanding the play between removing risk and mitigating risk. It’s knowing whether it is more prudent, timely, and cost effective to remove a risk or to simply reduce the impact of the risk.
Recovery Plans
If a known risk does occur, you must deal with the consequences. You can use a recovery plan to create a known set of actions to take to deal with those consequences and repair the problem that the risk introduced.
Recovery plans typically do not impact the likelihood of a risk, just the severity.
A recovery plan is a particular type of risk mitigation that specifically involves reducing the severity of the risk when it does occur. A recovery plan describes what you do if a known risk happens. A recovery plan can describe the following:
· Actions to take to stop the problem as quickly as possible
· Actions to take to implement a workaround to reduce the impact of the problem
· Messages to inform customers of what the problem is and what they can do to reduce the impact on them
· Escalation processes to use and people within the company to inform about the problem (this lets all parts of the company understand and deal with the problem and any fallout)
A good recovery plan is constructed in advance as part of the risk mitigation plan for a given risk, so that when a problem does occur (i.e., a risk is triggered) everyone knows what needs to happen to recover from the problem.
The recovery plan should contain:
· Details of what must be happening that would trigger the recovery plan to be implemented
· The list of actors that need to be involved in implementing the recovery plan
· Step-by-step instructions for implementing the recovery plan, and which actor(s) should execute those steps
· Management and other groups that need to be informed
· Required follow-up that must happen after the problem is resolved
The recovery plan should be stored in a location that is well known to your team—that is, a place where everyone on your team will know to go during a crisis situation. This could be in a support book or an internal support intranet. After a recovery plan is executed, a postmortem of the problem should occur and the recovery plan should be analyzed to determine if any improvements or changes are warranted.
The simple existence of a valid recovery plan for a specific risk item is an example of a valid risk mitigation plan that you can use to reduce the severity of a given risk.
RECOVERY PLAN
The replication process described in Figure 9-2 is the beginning of a recovery plan for the risk of catastrophic database failure. However, to be a complete recovery plan, you would also need to include a process for implementing failover, criteria for determining when the failover can occur, an approval process for implementing the failover, and postmortem cleanup after the failover.
Disaster Recovery Plans
A disaster recovery plan is an example of a recovery plan that is designed to describe what the company should do if a specific type of disaster hits the company. These types of disasters tend to have a severity of High but will typically have a likelihood of Low.
An example of a disaster that warrants a disaster plan is the loss of one or more data centers for your application (whether that is caused by technical issues, a natural disaster, or a significant security breach).
You can create and manage disaster recovery plans just like recovery plans. The only real difference between a disaster recovery plan and a typical recovery plan is the seriousness of the risk the plan is mitigating and potentially the level of detail and involvement in implementing the plan.
Typically, disaster recovery plans have significantly more visibility within the company and the management and ownership of the company. There may be pre-established, business-specified recovery times required for these types of disasters. But this does not effectively distinguish them from recovery plans.
Improving Our Risk Situation
Risk mitigation is an important process in improving the availability and scalability of our applications by reducing the impact that risk plays in our application. It is a recognition that although removing a risk might not be possible or practical, reducing its impact or severity might very well be possible and often is sufficient to give us the desired level of application health we desire. We talk more about risk mitigation in Chapter 11. When used in conjunction with a risk matrix, risk mitigation plans provide a useful tool to improve the health of your application.
1 The ID should not be the row number in the spreadsheet, however. This is because the rows in the matrix will likely be sorted and new ones added and removed, thus changing the spreadsheet row number for a risk. The Risk ID should be an identifier that does not change for the life of the tracking of the risk.
2 To ease column sorting by the likelihood and severity values, you might want to make them numeric: 1–3 for Low to High, or some other system. A common sorting trick is to use “1-Low,” “2-Medium,” and “3-High,” and then use your spreadsheet program’s capabilities to restrict the values allowed to just these three.
3 Incident-response plans should be readily available to your on-call personnel in your incident playbook or other tools.
4 The most critical risks are those with the highest likelihood or severity, especially items for which both likelihood and severity are high.
5 However, we recommend that the moment you believe you have identified a new risk, you add it to the matrix. Don’t wait for a review session. You can wait for the review session to update all the data in the risk, but you should document it immediately once discovered.
6 Or lowering any other combination, such as Medium/High to Medium/Medium, or Medium/Low to Low/Low.