
103
In previous communications I have discussed the variations in size occurring in one or two organs of the common shrimp (Orangon vulgaris). In these papers it has been shown (1) that the observed deviations from the average size of every organ measured are grouped symmetrically about the average, and occur with a frequency corresponding closely to that indicated by the probability integral; and (2) that the “degree of correlation” between a given pair of organs is approximately the same in each of five local races of the species (Roy. Soc. Proc. vol. 47, p. 445, and vol. 51, p. 2). In what follows I shall describe the results obtained by measuring certain parts of the shore crab (Carcinus moenas) in two samples, one from the Bay of Naples, and one from Plymouth Sound, each sample consisting of 1,000 adult females.
1. — The Variation of Individual Organs.
The measurements made were as follows:
1.The total length of the carapace (fig. 1, AB), in a straight line from the tip of the median inter-orbital tooth to the middle of the posterior margin.
Fig. 1.Diagram to show the parts of the carapace measured. The diagram is drawn to scale, the right half representing a perfectly average Plymouth crab, the left an average crab from Naples.
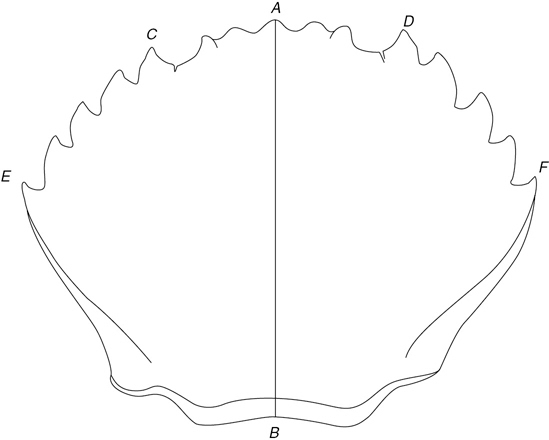
2.The total breadth of the carapace, in a straight line from tip to tip of the posterior lateral teeth (fig. 1, EF).
3.The frontal breadth, from tip to tip of the anterior lateral teeth (fig. 1, CD).
4.The right antero-lateral margin, from the tip of the median inter-orbital tooth to the tip of the postero-lateral tooth (fig. 1, AF).
5.The right dentary margin, measured in a straight line from the tip of the antero-lateral to the tip of the postero-lateral tooth (fig 1, DF).
6.The left antero-lateral margin, measured in the same way as the right.
7.The left dentary margin.
8.The sternal breadth, measured between the articulations of the great chelas.
9.The meropodite of the right chela, measured, in a straight line between the inner articulations.
10.The carpopodite of the right chela, from the inner articulation, in a straight line to the tip.
11.The proximal portion of the same carpopodite, in a straight line from the inner articulation to the tip of the inner spine, at the base of the dactylopodite.
The dimensions 2–11 were expressed in terms of the total length of the carapace taken as 1000; and, in order to reduce the effect of possible errors of measurement, the values so obtained were grouped together in fours, the groups being so selected that no two individuals in anyone of them differed by more than 0.004 of the carapace length.
As an example of the way in which the values thus obtained were distributed, the measurements of the right antero-lateral margin in Naples and in Plymouth may be examined. The results of these measurements are shown in Tables I and II. The frequency with which every observed magnitude of this portion of the carapace occurred in the Naples specimens is given in the second column of Table I. The arithmetic mean of all these values is 752.22 thousandths of the carapace length; and the observations will be seen to cluster with a fair degree of symmetry around this value, the symmetry of distribution being, perhaps, more readily seen by the eye in the diagram, fig. 2. The total number of individuals in the sample was 999, and of these 513 had the antero-posterior margin greater than the average size, 486 having this portion of the carapace below the average. The arithmetic mean of all the deviations from the average, or “mean error” of distribution, was found to be 8.71 units; and the modulus is therefore 8.71 × 1.77 = 15.42 units. A probability curve, with modulus = 15.42 units, has been drawn by a dotted line in fig. 2; and the close agreement between this curve and the observed curve of distribution, which is indicated by a thick, line, is very striking. In order to make a more accurate comparison possible, the number of individuals corresponding to each observed magnitude, on the hypothesis that this probability curve represents the real distribution about the mean, has been calculated from the tables of the probability integral, and is given in the third column of Table I. In spite of some considerable discrepancies, the general agreement between the second and third columns of the table is undeniable.
Fig-. 2. Diagram showing the frequency of occurrence of all observed lengths of the antero-lateral margin of the carapace in 999 female crabs from Naples. The abscissa scale represents thousandths of the total carapace length. The vertical scale represents numbers of individuals.
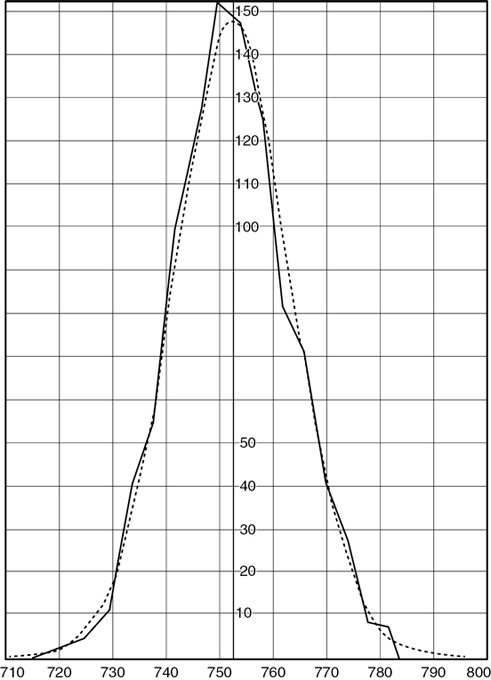
Table I.Distribution of Lengths of Antero-lateral Margin of Carapace in 999 Female Carcinus moenas from Naples.
|
Dimension in thousandths of carapace length. |
Number of individuals observed. |
Number calculated from probability integral (c = 15.42 |
|
792–795 |
2 |
|
|
788–791 |
0 |
16.4 |
|
784–787 |
0 |
16.4 |
|
780–783 |
7 |
16.4 |
|
776–779 |
8 |
16.4 |
|
772–775 |
28 |
22.2 |
|
768–771 |
41 |
42.1 |
|
764–767 |
72 |
70.2 |
|
760–763 |
82 |
102.0 |
|
756–759 |
126 |
130.0 |
|
752–755 |
147 |
144.8 |
|
748–751 |
152 |
141.1 |
|
744–747 |
121 |
120.3 |
|
740–743 |
98 |
87.0 |
|
736–739 |
55 |
59.6 |
|
732–735 |
40 |
34.3 |
|
728–731 |
11 |
16.6 |
|
724–727 |
5 |
11.8 |
|
720–723 |
3 |
11.8 |
|
716–719 |
1 |
11.8 |
The right antero-lateral margin of the Plymouth individuals, when treated in a similar way, gave the following results:—
Arithmetic mean 762.70 thousandths.
Mean error 9.77 thousandths.
Modulus 17.29 thousandths.
The frequency with which individual deviations from the average occur is compared with that indicated by a probability equation of the appropriate modulus in Table II.
These two examples will give a fair idea of the extent to which the distribution of the observed magnitudes of each organ about the mean of all of them corresponds to that indicated by the probability equation. A similar treatment of every other set of measures would serve no useful purpose; it will be sufficient to give, in the following table, the mean value, and the probable error of distribution about that value, of every organ measured. The probable error is given below, instead of the mean error, because it is the constant which has the smallest numerical value of any in general use. This property renders the probable error more convenient than either the mean error, the modulus, or the error of mean squares, in the determination of the degree of correlation which will be described below.
Table II.Distribution of lengths of Anterolateral Margin of Carapace in 999 Female Carcinus from Plymouth.
|
Length in thousandths of carapace length. |
Number of individuals observed. |
Number calculated from probability integral (c = 15.42 |
|
796–799 |
6 |
21.5 |
|
792–795 |
3 |
21.5 |
|
788–791 |
7 |
21.5 |
|
784–787 |
19 |
23.2 |
|
780–783 |
44 |
45.2 |
|
776–779 |
70 |
61.6 |
|
772–775 |
94 |
87.5 |
|
768–771 |
101 |
110.5 |
|
764–767 |
140 |
125.6 |
|
760–763 |
128 |
134.0 |
|
756–759 |
105 |
112.7 |
|
752–755 |
100 |
97.2 |
|
748–751 |
79 |
62.2 |
|
744–747 |
47 |
53.4 |
|
740–743 |
25 |
29.2 |
|
736–739 |
20 |
15.8 |
|
732–735 |
4 |
13.2 |
|
728–731 |
6 |
13.2 |
|
692–695 |
1 |
13.2 |
...
The only case in which an undoubtedly asymmetrical result was obtained is that of the frontal breadth of the Naples specimens. From an inspection of the curve of distribution of these magnitudes, I was led to hope that the result obtained might arise from the presence, in the sample measured, of two races of individuals, clustered symmetrically about separate mean magnitudes. Professor Karl Pearson has been kind enough to test this supposition for me: he finds that the observed distribution corresponds fairly well with that resulting from the grouping of two series of individuals, one with a mean frontal breadth of 630.62 thousandths, and a probable error of 12.06 thousandths; the other with a mean breadth of 654.66 thousandths, and a probable error of 8.41 thousandths. Of the first race, Professor Pearson’s calculation gives 414.5 individuals, of the second, 585.5.
...
We may, therefore, assume that the female Carcinus moenas is slightly dimorphic in Naples with respect to its frontal breadth; and that the individuals belonging to the two types are distributed in the proportion of nearly two to three.
2. — The Correlation of Pairs of Organs: Galton’s Function
The method adopted to determine the degree of correlation between two organs was that proposed by Mr. Galton (‘Roy. Soc. Proc.,’ vol. 40, p. 63). The measures obtained were sorted into groups, such that in each group the deviation X of an organ A from its average was constant. The mean deviation from its average of a second organ B was determined in each of these groups.
...
It may, therefore, be asserted that the investigation which has been described does not demonstrate a difference between the value of Galton’s function for a given pair of organs in Naples and the corresponding value in Plymouth. The values obtained are not in all cases shown to be identical, but the differences between them are within the limits of error of the method employed; and in the worst
case it has been shown that the errors arising from a neglect of the observed discrepancy between two corresponding values are not of a very serious kind. So that in any discussion of the variation of the twenty-three pairs of organs discussed in the present paper, or of the pairs of shrimp organs discussed in my previous communication, it may be assumed as at least an empirical working rule that Galton’s function has the same value in all local races. The question whether this empirical rule is rigidly true will have to be determined by fuller investigation, based on larger samples: but the value of a merely empirical expression for the relation between abnormality of one organ and that of another is very great. It cannot be too strongly urged that the problem of animal evolution is essentially a statistical problem: that before we can properly estimate the changes at present going on in a race or species we must know accurately (a) the percentage of animals which exhibit a given amount of abnormality with regard to a particular character; (b) the degree of abnormality of other organs which accompanies a given abnormality of one; (c) the difference between the death rate per cent, in animals of different degrees of abnormality with respect to any organ; (d) the abnormality of offspring in terms of the abnormality of parents, and vice versa. These are all questions of arithmetic; and when we know the numerical answers to these questions for a number of species we shall know the direction and the rate of change in these species at the present
day a knowledge which is the only legitimate basis for speculations as to their past history and future fate.
Reading and Discussion Questions
1.Darwin tended to talk about traits in qualitative terms, noticing deaf cats with blue eyes, pigeons with small feathered feet that have skin between the outer toes, hairless dogs with imperfect teeth and droopy ears, and the complex social interactions of a beehive. What steps does Weldon take to quantify the traits that are under investigation?
2.How does statistical analysis of the study of crab populations in Weldon’s paper provide empirical evidence for gradual changes in a population by means of natural selection? Do you think that work such as Weldon’s could establish that natural selection is taking place, independently of hypotheses about their underlying causes?