VOTING AND PARTICIPATING MORE ACTIVELY IN CAMPAIGNS are attempts to influence political outcomes through institutional channels. Whom voters elect to office matters because these elected representatives not only directly make laws that affect everyone, including people who didn’t vote; they also have a large say both in who sits on the courts and in who works in the bureaucratic agencies that make the rules and decisions that affect people’s everyday lives. Working through institutional channels, however, rests on the assumption that there is a cycling through of winners and losers, and that if one loses an election this time around, there is a good chance of winning in the next election or the election after that.1 A person might lose at Time1 but hold the expectation of winning at Time2 or Time3. If people believe their voice will be heard at some not-too-distant point, then voting, participating in campaigns, and writing letters to elected officials make a great deal of sense. What happens, though, when people keep losing or the gains made year after year are so small that it begins to feel as if nothing is going to change?
This question is especially pertinent for groups in the United States that are always in the political minority, especially people of color. The reciprocity of winning and losing can appear to be a pipe dream if the majority whites always get their way and people of color rarely do. When voting and other types of conventional participation don’t seem to have any effect, groups often turn to unconventional participation. The civil rights movement used protests, marches, and civil disobedience to force the majority to take notice of the injustices experienced by Black people in America. Protests against the killing of Black people by police officers, which had been getting some press coverage in recent years, erupted in the summer of 2020 after the murder of George Floyd by a Minneapolis police officer. Many Americans felt that this egregious murder was the last straw and that police departments and cities across the country had to change.
The use of protests by people who feel they do not have a voice and who want to push openly for change is a common occurrence in American politics. In 2006, after the U.S. House of Representatives passed legislation to restrict immigration, numerous protests were held across the country to express outrage over the legislation, culminating on May 1 when over two million people marched in over 150 U.S. towns and cities. Some demonstrations were held during the workweek to show the impact on businesses of a “Day Without Immigrants.”2 On January 21, 2017, approximately five million people participated in Women’s Marches held in over 650 localities across the United States, including an estimated half a million people who marched in the Women’s March on Washington, DC. These protesters were showing their support for women’s rights and their opposition to Donald Trump’s election to office given the disparaging comments he made toward women during his campaign and earlier in his public life.3 And in a “National Day of Action and Healing” on March 27, 2021, thousands of protesters took to the streets across the country to protest the increase in violence against Asian Americans after six women of Asian descent were killed in a mass shooting in Atlanta. Violent attacks against Asian Americans had been increasing over the previous year, prompting many Asian Americans to decry the stereotyping of and violence toward people of Asian descent in the United States.4
We address in this chapter political participation that takes place outside of institutional channels, what is known as unconventional participation. While only a small portion of the U.S. population gets involved in protests, demonstrations, marches, and riots, these events get a lot of media attention, and people can feel that they have a voice that has been denied to them through institutional channels. To get a handle on unconventional participation, we look more closely at social groups and group identities. Voting or putting a candidate’s sign in one’s yard is relatively easy and does not demand much time or effort. Attending a rally, protesting, or joining a social movement demands more from participants. Connecting one’s behavior to a broader social goal and having people in one’s social network who support and even join the effort can significantly increase the likelihood of joining a rally, boycotting a business, and traveling to Washington, DC, to participate in a march. Understanding the role social context plays in how people think and act when it comes to politics is essential for understanding political behavior. We end the chapter by looking at Americans’ support for the use of violence to pursue political goals.
Learning objectives for Chapter 4 include:
· Understanding what unconventional participation is and who participates in this way
· Being able to explain what increases the likelihood of participating in protests even if free riding is the easier route
· Exploring the increase in support for using political violence
· Examining how unconventional participation and political violence fit within a democratic political system
UNCONVENTIONAL PARTICIPATION
In Chapter 3, we focused on participation in elections (such as voting or working on campaigns). These conventional, or institutional, forms of participation are widely accepted as legitimate and encouraged as fundamental to good citizenship. Focusing on conventional participation, however, misses all of the political actions that take place outside the normal, institutional channels of politics. Key social movements have transformed American politics and culture, and unconventional activities, such as petitions, protests, civil disobedience, occupying buildings, and even violence, have been used by activists to bring attention to issues and to sway public opinion.5 It is hard to imagine the leaders of the civil rights movement, for example, simply asking their followers to vote or to donate money to a campaign. The problems faced by Black people in mid-twentieth-century America included widespread and successful efforts to keep them from voting. Encouraging voting wouldn’t solve the problem. Other groups that make up a political minority face problems being heard when the reciprocity of winning and losing never happens. Taking strong action and trying to project strength in numbers can help groups move their agendas forward.
Unfortunately, there is much less data on unconventional participation than conventional participation. Everyone knows when the next election for national office will take place in the United States, and surveys can easily be put in the field to measure voting behavior. We can’t be certain when the next protest or occupation of a building will happen. Issues also arise when surveys include questions on people’s involvement in unconventional activities. It’s easy to ask people if they voted in the last election. It is trickier figuring out how to ask about unconventional activities, especially since some of them happen out of public view.6 Should the time frame of the activity be short, such as protesting in the past year, or should it be open ended, implying protesting at any time in one’s life? Social desirability can also affect results. When asked about voting, people know they should vote, so they are inclined to say they have voted even if they haven’t. When asked about unconventional activities, though, the opposite problem can occur. Americans tend to be less approving of unconventional activities, especially those that are illegal or involve violence, so respondents might be inclined to say they haven’t participated in certain ways even if they have. On top of all of this, there tend to be few people who have taken more extreme actions, meaning that asking a random sample of people if they have engaged in certain activities will lead to very few yes responses. It is difficult to analyze a very small number of cases in a survey.
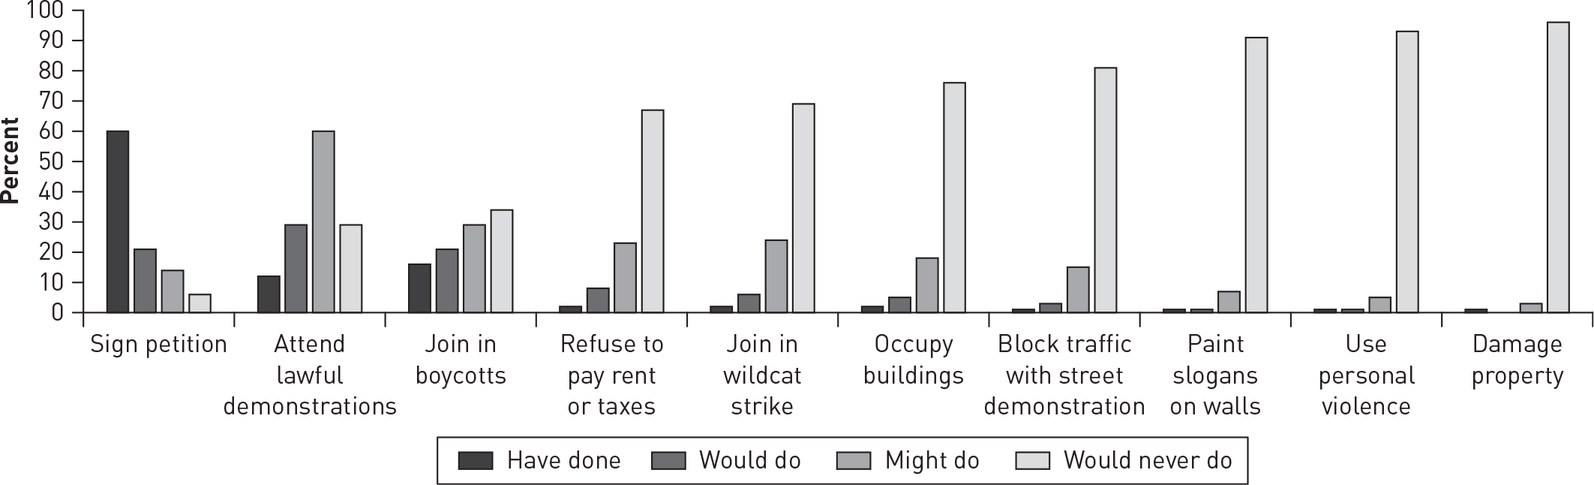
In the 1970s, researchers fielded a set of surveys, called the Political Action surveys, in eight countries that asked a large battery of questions on unconventional participation.7 The U.S. portion of the survey was administered in 1974. We will examine more recent data from the American National Election Studies (ANES) and the World Values Survey (WVS), but these older data include a much broader array of activities and reveal not only how often they are used but also how acceptable they are to the public. Respondents were asked, for each activity, if they had actually done it in the past ten years, if they would do it if it were important to them, if they might do it in a particular situation, or if they would never do it under any circumstances. Figure 4-1 shows the results. In 1974, the survey respondents readily admitted to having signed a petition. Many fewer said they had attended a lawful demonstration or joined in a boycott (12 percent and 16 percent, respectively), but a large proportion said they either would do it or might do it if given the opportunity. Only about a third said they would never do any of these activities. Each of the remaining activities has had fewer participants (only between 1 and 2 percent), and the number of people who adamantly say they would never do it under any circumstances increases dramatically, from two-thirds (for refusing to pay rent or taxes and joining in a wildcat strike) to over 90 percent (for painting slogans on walls, using personal violence, and damaging property). The more damage done by the activity (to person or property), and therefore the more illegal the activity, the less likely people are to admit having done it, and the less willing they are to entertain the possibility of taking part in it. Not surprisingly, when asked the extent to which they approved or disapproved of each of these activities, respondents overwhelmingly said they strongly disapproved of the more aggressive activities (data not shown).
 Description
Figure 4-1 Unconventional Participation From the Political Action Survey, 1974
Source: Samuel H. Barnes and Max Kaase, et al., “Political Action: An Eight Nation Study, 1973–1976” (ICPSR 7777), Inter-university Consortium for Political and Social Research, available at http://web.stanford.edu/group/ssds/dewidocs/icpsr7777/cb7777.all.pdf.
The year 1974 came a long time ago, at the end of the civil rights and Vietnam War eras. While more recent surveys do not ask about the same range of activities as the Political Action survey, we can get a sense of Americans’ more recent involvement in some of these activities. The ANES asked respondents in 2020 if, during the past twelve months, they had signed a petition on the internet or on paper about a political or social issue and if they had joined a march, rally, or demonstration. The response options were yes and no. Respondents were also asked how often, in the past twelve months, they had “either bought or declined to buy a certain product or service because of the social or political values of the company that provides it.” Response options ranged from never to all the time, but we focus on those who answered most of the time or all the time. The WVS asked about these same activities in 2017, but there are two big differences with this survey. First, the response options are more similar to those of the Political Action survey: have actually done, might do, and would never do it under any circumstance. Second, unlike the ANES survey that puts a time limit on the activity (in the past twelve months), the WVS includes no time frame. Respondents could therefore answer the question thinking about their whole lifetime.
The data in Table 4-1 that can most easily be compared to the 1974 data are from the WVS. There has been a slight increase (of 4 to 5 percentage points) in the number of people who say they have boycotted a product or business or participated in a protest or demonstration, and the number of petition signers has remained steady. The ANES asks specifically about the previous twelve months, so not surprisingly, the number of participants tends to be lower than for the WVS. Interestingly, the activity over which people have the most personal control—each individual can decide whether to boycott a company or product regardless of what anyone else does—is the least affected by the time frame. The activities that depend on others, protesting and signing petitions, have much lower numbers in the ANES than in the WVS.
In a 2020 survey of adults in the swing states of Wisconsin, Pennsylvania, Michigan, and North Carolina, 32 percent of people had boycotted products or businesses for expressly political reasons while 27 percent had purchased particular products for political reasons. A 2018 survey of adults in the same states, taken prior to the decrease in in-person participation caused by the COVID-19 pandemic, 20 percent indicated having participated in a political protest in the past year.8
Table 4-1
Source: 2020 American National Election Studies, available at www.electionstudies.org; 2017 World Values Survey, available at https://www.worldvaluessurvey.org/wvs.jsp.
We take a closer look at people who say they have joined in a protest, march, or demonstration, again drawing on the ANES and WVS data, to determine who has protested and who is likely to protest in the future. Table 4-2 shows the results broken down by demographic categories. Some of the demographic results stand out. First, protesters overall are not more likely to be overrepresented by any given sex or race. In contrast, people who have protested in the past year are much more likely to be young (16 percent of those younger than thirty compared to only 6 percent of those sixty-five and older), although older people are more likely to have protested in their lifetime. This result isn’t surprising since older people would have had more opportunities to protest over their lifetimes compared to younger people, and younger people are more likely to say they might protest than older people if given the opportunity. Education is also a significant predictor of protest. Those with a college education are much more likely to have protested. The opportunity to protest is likely higher among those attending college, especially given the social support networks college students have and the likely increased awareness that a protest will take place among this cohort. In terms of opportunity, living in a city and having a higher household income increase the likelihood of protesting, whereas living in a rural area or being poor makes it less likely that protest opportunities will arise. Whereas few rural people have protested, compared to urban dwellers, they are much more likely to say they might. The swing state survey found similar results, with the lion’s share of people attending Black Lives Matter (BLM) protests coming from urban centers. Being poor, on the other hand, has a depressive effect on actual behavior and does not appear to be related to the willingness to protest.
Table 4-2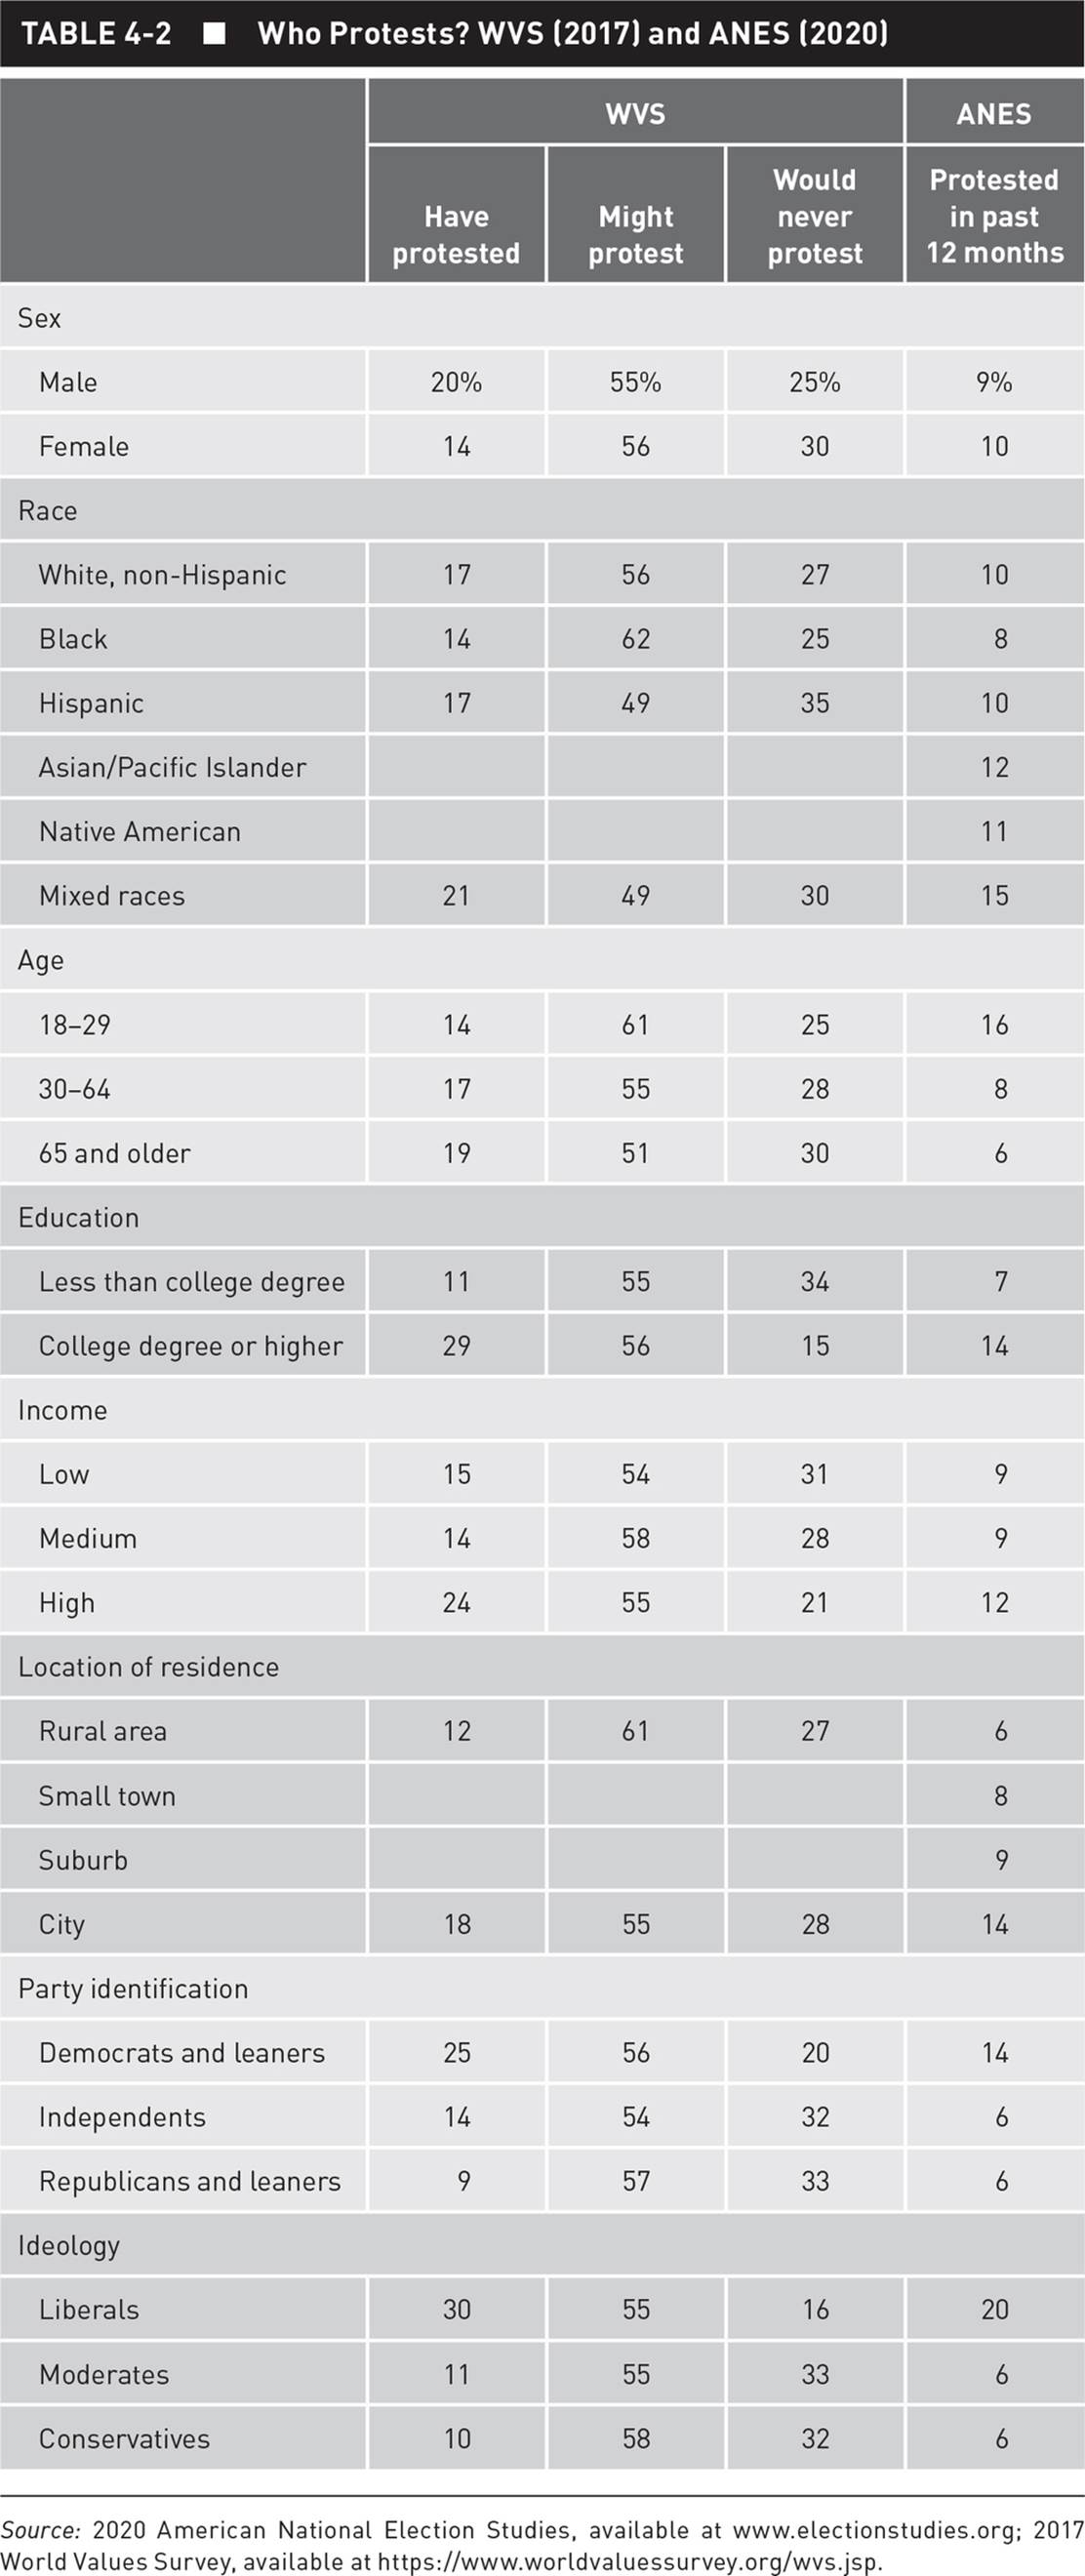
Source: 2020 American National Election Studies, available at www.electionstudies.org; 2017 World Values Survey, available at https://www.worldvaluessurvey.org/wvs.jsp.
Protesters differ from nonprotesters most strikingly in their political views. Democrats and especially liberals are much more likely to have protested in the last year and in their lifetime compared to Republicans and conservatives. This is partly due to the issue goals of protests over the years. Liberals have been more likely to turn to protests surrounding such issues as civil rights and opposing wars. Conservatives, however, have held many antiabortion marches, and Donald Trump was able to garner large turnout at his rallies. Interestingly, the higher protest rates of Democrats and liberals hold in rural areas as well. Over twice as many rural liberals (12 percent) as rural conservatives (5 percent) joined in a rally or demonstration over the past year. But it is urban liberals who participate at the highest rate (27 percent of urban liberals compared to only 8 percent of urban conservatives). Size of place matters for the opportunity to protest, but political beliefs also have a significant impact on this type of political behavior.
EXPLAINING UNCONVENTIONAL PARTICIPATION
Voting is a comparatively easy form of political participation. The costs associated with voting are relatively low, involving the time it takes to become informed and to get to the polling place (or to drop off one’s absentee or mail ballot) along with the cost of gas or public transportation and perhaps child care. If there are long lines at the polls or if one’s job makes it difficult to get away from work, the costs increase, but in general, voting is a relatively low-cost form of participation. Other types of participation, such as volunteering for a campaign or writing a letter to the editor in support of a candidate, take more time, and the participant has to be highly motivated to participate. It’s no surprise that many more people vote than get more actively involved in campaigns. When it comes to unconventional participation, though, there is an even higher cost than extensive time and effort: both social disapproval and risks are likely to be higher for unconventional than for conventional participation. We discussed earlier the Political Action survey in which respondents indicated much higher disapproval of more extreme forms of unconventional participation. In addition, people involved in protests and civil disobedience know, based on historical events, that even peaceful protests can turn violent or prompt law enforcement to arrest participants.
Protests, rallies, and acts of civil disobedience are therefore potentially highly costly, and the likelihood of any one event succeeding in obtaining a group’s goals is uncertain at best. Even if the group obtains its goal, say a more just policy, it is a collective outcome shared by everyone in the society, not just those who worked to get the policy passed. Mancur Olson argued that it is perfectly rational for people to be free riders, even when they very much want the shared outcome. If individuals participate, they incur high costs, whereas if they do not participate, they incur no costs. Since the positive outcome is shared by everyone, the inactive individual gains the benefits (the more just policy) and hasn’t had to bear any costs. It is rational, then, not to participate. However, if everyone behaves rationally, then everyone free rides, and the preferred outcome will not be achieved.9 The resulting outcome, in this instance the continuation of an injustice, is what the potential participants do not want, yet it is what they get.
But people do get involved in unconventional activities, sometimes a lot of people. For unconventional participation to happen, especially given the high costs associated with participating, certain factors need to fit into place. We focus on protest behavior (which includes protests, marches, demonstrations, and riots) and look at three major factors that explain this type of unconventional 'margin-top:12.0pt;margin-right:0cm;margin-bottom: 0cm;margin-left:0cm;line-height:normal'>Opportunities
If people care deeply about an issue, they are likely to get involved in a political activity if there are opportunities to do so. The opportunity to protest, however, tends to be low. This type of participation is called “unconventional” because it is just that, unconventional. It is not the normal, conventional way that people participate in politics. Unlike voting or participating through institutional channels, such as working on a campaign or donating money to a candidate, protests and demonstrations occur erratically, and there is not a set place or time to participate. People might not be aware of an event in their area until it is too late, or a protest on an issue salient to a person might not take place nearby. Another defining feature of protest events is that they involve more than one person. That is, it is a social group event. While one individual might care a great deal about an issue and want to protest, it doesn’t really work if no one else is protesting. For most people most of the time, the opportunity to engage in unconventional participation does not arise, either because the necessary mass of people isn’t gathering or because the protest takes place far away or without people being aware. It is important, therefore, to take into account the opportunities associated with unconventional participation to understand the context within which this type of participation occurs.
In general, the more heavily populated the state, the more opportunities there are to participate in protests or riots. The Armed Conflict Location & Event Data Project (ACLED) defines protests as being peaceful and riots as involving disruption and violence. Using ACLED data, Figure 4-2 shows the number of protests and riots in the United States from January 1, 2020, to the end of March 2021.10 In January 2020, there were 1,144 protests and riots across the United States. People living in California during that month could have participated in any one of 170 protests or riots. On January 4, for example, Californians could have attended 1 of 10 protests in support of or condemning the killing of Iranian general Qassem Soleimani, or they could have joined with a couple dozen people gathered in American Canyon to protest the eviction notices of low-income mobile-home owners. In contrast, people living in North Dakota in that same month had no protests or riots occur in their state. North Dakotans would have had to wait until February 14, 2020, for a protest held in Fargo by the Missing and Murdered Indigenous Women Task Force to raise awareness of missing and murdered Native American women and girls.
 Description
Figure 4-2 Protests and Riots in the United States, January 2020–March 2021 (ACLED)
Source: Armed Conflict Location & Event Data Project (ACLED), available at https://www.acleddata.com.
The outcry over the murder of George Floyd by Minneapolis police officer Derek Chauvin changed the protest landscape dramatically. Floyd was killed on May 25, 2020, and in the few days remaining in that month, over 1,000 protests were held across the United States. In June 2020, there were a whopping 6,753 protests and riots. Every state experienced a large increase: North Dakota went from having 0 in January to 15 in June, Oklahoma increased from 7 to 73, and California jumped from 170 to 737. Whereas the opportunity to protest was spotty in January 2020, by June protests were happening across the United States.
Just as living in a more populous state increases the opportunity to participate in a protest or rally, so does living in a city. We showed in Table 4-2 the impact of location of residence on whether people said they had joined a protest, march, rally, or demonstration in the past twelve months.11 Under 6 percent of respondents living in rural areas had participated in a protest or rally compared to just under 14 percent for city dwellers. Living in a city simply gives one more opportunity to participate unconventionally. The protests that took place in June 2020, however, were widespread. Looking just at the two states in which the authors of this book reside, Nebraska had 44 protests or riots in that month. The two largest cities in the state, Omaha and Lincoln, had 12 and 17 protests, respectively, but protests occurred across the state from Auburn to Sidney. Wisconsin saw an even greater dispersal of protests, with the two largest cities, Milwaukee and Madison, accounting for only 26 and 19 of the total 164 protests, respectively.
June stands out in Figure 4-2 as a high protest month, but Americans remained unsettled throughout the summer of 2020. Almost all of the protests or riots from the end of May through late summer included BLM as one of the main groups of participants.12 ANES respondents were asked how warm or cold they felt toward various groups, including BLM. Those who had attended a protest or similar event in the past twelve months felt warmer toward BLM (a mean of 71 degrees on a 101-point scale) compared to those who had not attended a protest (a mean of 53 degrees). Looked at in a different way, 16 percent of those who felt warm toward BLM said they had participated in a protest whereas only 6 percent of those who felt cold toward BLM had protested.
In the lead-up to and after the 2020 elections, there was a significant shift in the focus of the protests and riots. BLM protests continued, although in much smaller numbers, but there were more protests focused on frustration with COVID-19 measures and concerns about the election (from both sides). The most significant event was Trump’s “Save America” rally followed by the storming of the U.S. Capitol on January 6, 2021, when Congress was in session to certify the Electoral College results. The size of the crowd was somewhat large—estimated in the thousands to tens of thousands—but the acts of breaking into the Capitol building, destroying property, and threatening the lives of the elected representatives in the building at the time, along with the delay of the certification process and the deaths of a participant and police officers, made it an event that few Americans will forget. In terms of obstacles and costs, people from around the country had to travel to Washington, DC, pay for someplace to stay and for meals, and take the time off of work to make the trip. Some participants lost their jobs after being seen on social media. Still others are facing court cases and time in jail.
If we look at only the opportunities, costs, and benefits of unconventional participation, it seems unlikely that anyone would participate in this way. The opportunities are scattered and uneven, the costs (especially if violence occurs) are high, and the benefits for any single individual are small. Whether a given individual participates or not is unlikely to affect the outcome and bring the protesters closer to their goal. Focusing solely on the individual and on the costs and benefits of unconventional participation cannot explain this behavior. To get a better sense of what is going on, we turn to the influence of groups.
Recruitment and Social Networks
Social groups have a pronounced impact on individual attitudes and behavior. Some of this impact occurs directly through face-to-face interactions with primary groups, such as family, friends, and coworkers. Social networks are the people with whom one interacts either face-to-face or via social media, and these social networks affect our political attitudes and behaviors in important ways. Social groups can have an impact in less direct ways as well, especially when secondary groups are involved. Secondary groups are those organizations or collections of individuals with which one identifies, or is identified, that have some common interest or goal instead of personal contact as their major basis. We focus in this section on social networks and look more closely at large social groups in the next section.
People tend to have social networks that are politically homogeneous and that reinforce their political views. Democrats rarely have Republican discussion partners (only 16 percent of all discussion partners), and Republicans are reluctant to have Democratic discussion partners (only 22 percent of all discussion partners).13 Where one lives affects the likelihood of having talk partners who identify with the other party. In the swing state of Wisconsin, people living in the liberal city of Madison were more likely to have Democratic Party talk partners while those living in rural Wisconsin were less likely to have Democratic Party political discussants. Interestingly, the rate at which having a talk partner in the other party declines at different rates depending on geography. Republicans living in liberal areas that were also urban centers had a more rapid decline in the likelihood of having Democratic discussion partners while Republicans living in rural areas and small towns had a slower decline in the same outcome.
Whether looking at friends or spouses, people are attracted to those who hold similar values and attitudes, including about politics. The tendency of people not to like conflict or disagreement increases the likelihood that friends will hold the same views, or that they will not talk politics when they disagree. Groups of coworkers appear to be somewhat more mixed politically. Workplace groups are formed with a task-oriented goal as the key, leading coworkers to be more diverse in their political leanings but also less likely to talk politics.14
Social networks are particularly important in explaining political behavior because of the role they play in recruitment. Sidney Verba, Kay Lehman Schlozman, and Henry Brady raise the important point that if people are asked to participate in a political activity, they are likely to say yes. They found that about half of their respondents had been asked to participate in a political activity, and about half of those asked said yes.15 Recruitment works for several reasons. People like to feel wanted. They also might not be aware that an opportunity to participate is available, so being asked to participate lets them know of the opportunity. Finally, participating in the activity with friends, family members, or coworkers could make participating more fun. Of course, people who have larger social networks are more likely to be asked. The more people a person interacts with on a daily basis, the more likely it is that the person will learn about a political event and be recruited by one of the discussion partners. These recruitment efforts can be as simple as having a friend say, “Hey, are you going to the protest today? You should. It’ll be fun.” Even seeing a friend or relative involved in a political activity can increase participation. For example, people who see in their Facebook newsfeed that their friends have voted are more likely to vote themselves.16
Social networks play an especially important role when it comes to participating in social movements and unconventional activities. Getting a large group of people to attend a rally or demonstration is much easier with the rise of social media. An Instagram feed urging people to meet at a certain place at a certain time to oppose a recent governmental action or to support a candidate for office can generate enough enthusiasm and participation to make it onto the local or national news, thereby giving the movement an even stronger following. The BLM protests attracted a great deal of media attention, as did the various rallies Trump held in key spots around the United States. Organizers and participants used Twitter, Facebook, Instagram, and other social media to spread the word about all of these rallies and protests, increasing the number of people who participated.
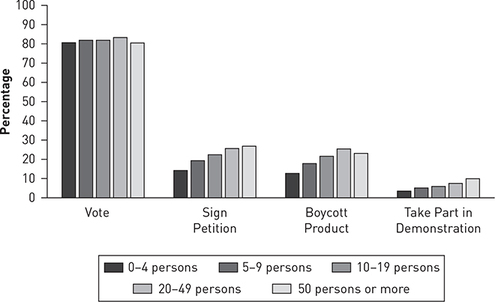
In 2014, the International Social Survey Programme (ISSP) asked a sample of Americans how many people they had contact with on a typical weekday. The respondents were also asked if they had been involved in a variety of political activities in the past year, including unconventional activities. Figure 4-3 shows the relationship between social network size and participation rates. We include voting as a highly institutionalized activity that is done regularly and publicized heavily in the media. When everyone knows when the election will be held and get-out-the-vote (GOTV) campaigns work to ensure that people get to the polls, it is perhaps not surprising that voting is not strongly related to social network size. People who have very few discussion partners are no more or less likely to vote than people who have over fifty discussion partners. All of the unconventional activities, on the other hand, are significantly affected by social network size. The larger the social network, the more likely people are to sign a petition, boycott a product or business, or join a demonstration. The bottom line is that people who are socially engaged are more likely to hear about and be asked to participate in activities that are not standard activities like voting. This is true even when discussions with others are not focused on politics.
 Description
Figure 4-3 Social Network Size and Unconventional Participation, 2014
Source: ISSP Research Group (2016): International Social Survey Programme: Citizenship II—ISSP 2014. GESIS Data Archive, Cologne. ZA6670 Data file Version 2.0.0, doi:10.4232/1.12590, U.S. sample.
Motivation and Social Group Identity
Not all groups that influence behavior involve direct communication. Large social groups matter as well. Research on social identity has found that when people feel like part of a group—feeling attached to the group, thinking of themselves as members of the group, and evaluating the group as a positive part of who they are—they shift their behavior and attitudes in ways that help out the group.17 Henri Tajfel and many other researchers have shown that simply being a member of a group leads participants to discriminate in favor of their in-group and to do what they can to benefit the group, even at personal expense.18 People who identify strongly with their race or ethnicity, gender, profession, sports team, religion, political party, or nation, just to take a few examples, are deeply influenced by that group attachment.
Everyone is born into certain ascriptive groups, such as race and sex, and categorized based on their visually distinguishable traits. Individuals are also categorized into groups based on their preferences and beliefs. While people often assume that those who share the group’s characteristics identify strongly with the group, the fact is that the strength of people’s group identities varies.19 In addition, context matters. For example, some women might strongly identify with women, and this social identity will always be a major influence on their perceptions and behaviors. For others, whether the identity is salient might depend on context. A woman might not identify very strongly as a woman in general, but when she is the only female in a meeting, that identity might take on added significance. One study showed that women in rural Texas who favored Hillary Clinton engaged in secret meetings to discuss politics. Living with what Emily Van Duyn called “networked silence,” people were silent about their politics in public settings and met secretly to express their views.20 At times, people might reject an ascriptive identity depending on the context. People born in the United States are American citizens and part of that national group, but if the United States does something that people find objectionable, they might reject their American identity and hold, instead, their state or a global identity.
In contrast to ascriptive groups, voluntary groups tend to yield strong identities. People can choose to be a Minnesota Vikings football fan or not. Those who stick with the team, through years of heartache, are strong identifiers, whereas those who shift their support to the Green Bay Packers or the New England Patriots, depending on the chances of winning the Super Bowl, are much weaker identifiers. Within the realm of politics, children might learn their parents’ party identification, if the parents are politically engaged, but most people do not form a stable, crystalized party identification until they are in their early thirties.21 They choose which party to identify with depending on a host of factors, including what they learned from their parents but also which policy beliefs they hold, what they think of recent presidents, and what they hear from friends and coworkers. We will have much more to say about party identification in Chapter 5, but the same social group dynamics are at play with this voluntary group membership.
Most important for our purposes is that group identity is related to group attitudes and behaviors. Loving one’s in-group does not necessarily mean hating the out-group, but it does mean that people will prioritize their in-group’s well-being and view the in-group members more positively.22 The more strongly people identify with a group, the more they cooperate with fellow members, and the more active and participatory they are on behalf of helping the group attain its goals. The successes of the in-group and the accomplishment of its goals take on personal importance for the strong identifier, and doing what is necessary to ensure those successes is an important part of feeling like one of the group.23 On the flip side, when the in-group experiences a loss or is treated unjustly, strong identifiers’ reactions are personal and often not only psychological but also physiological. The in-group’s wins and losses and hurts and joys are experienced as personal.24 What this means is that people don’t have to experience an injustice personally to be motivated to do something about it. For strong identifiers, seeing injustices occur against any group member becomes a catalyst for action.
This collective impact of in-group experiences is important for understanding political behavior and what motivates people to overcome the collective action dilemma described by Mancur Olson. Why are some people willing to shoulder steep costs when their own individual gain is likely to be small? Why don’t they just free ride and hope for the best? There must be something motivating them to bear the high costs of unconventional participation, and that something, according to Bert Klandermans and his colleagues, is social identity.25 Goals like social justice or racial equality or making America great again are collective goods shared by everyone, including those who contribute nothing to obtain the goal. Driven by the desire to have one’s group succeed, people are willing to bear a lot of cost for the good of the group. Feeling like part of a group can also increase one’s sense of efficacy, the feeling that one’s actions can have a positive impact on policy. One individual might not be able to change the world, but a whole bunch of people working together can make a difference. Finally, a sense of injustice, that the group has been mistreated or harmed, can be a strong motivator for those who identify strongly with the group. When people see someone in their group hurt or treated unfairly because of membership in the group, then the injustice is experienced by everyone who shares that group identity.
Group identities are important to people. They drive, consciously or unconsciously, people’s attitudes and behavior. Not all identities, however, are politically meaningful. A person can identify strongly as an artist or a Minnesota Vikings fan, for example, but identifying with these groups will not affect one’s political attitudes or behavior unless the identity becomes politicized. The more politics becomes contentious and polarized, the more likely political opinions begin playing a role in activities and behaviors that have not been previously thought of as political.26 Feeling a strong sense of grievance and injustice on behalf of the group can be the politicizing agent.27 Watching the video of Minneapolis police officer Derek Chauvin kneeling on George Floyd’s neck for over nine minutes, especially after seeing many recent news stories about police use of force targeting people of color, was more than just an individual incident for many Black people. It symbolized the mistreatment of Black people across American history, and this injustice motivated many to take to the streets in the summer of 2020. The pain felt in the Black community was palpable.
As happened during the civil rights movement in the 1950s and 1960s, though, it was not only racial group identity that came into play in the 2020 BLM protests. Many Americans who are not Black took to the streets in part to show their solidarity with Black people but also because another group identity was important. Many protesters argued that the murder of George Floyd, and all of the other Black people who have recently been killed by police, showcased an America that did not reflect their values or beliefs. Some of the people marching in solidarity with Black people did so because they wanted their nation, of which they are members, to head down a different path when it comes to racial equality. These people wanted to reclaim an American identity that they could respect, and they wanted to contribute to making that change.
Many Americans, especially Democrats, view race as a major issue facing the nation, and one that undermines the American value of equality. In a poll fielded in June 2020, Democrats were over 50 percentage points more likely than Republicans to agree that the criminal justice system treats whites better than Blacks, that police killings of African Americans are signs of a broader problem, that Blacks and whites are not treated equally by the police, that there is a problem with systemic racism in America, and that systemic racism in policing is a bigger problem than violence and vandalism in protests.28 To people on the left, American history is replete with racism, and this must stop. In a different survey fielded in 2020, respondents were asked to choose between two statements: “The United States has not made nearly enough progress on racial equality since the 1960s, and our society should prioritize racial justice” or “The United States has made considerable progress on racial equality since the 1960s, and people should be patient as progress continues.” Just under 70 percent of Democrats chose the first statement whereas 90 percent of Republicans chose the second.29
To get a better sense of the relationship between social identity, grievance, and protest behavior, we turn to the 2020 ANES data. ANES asked respondents questions about police actions, the unfair treatment of Black people, personal experiences with police and discrimination, and attitudes about a more diverse America. Unfortunately, the racial and American identity questions were not available in time for us to analyze them, but Table 4-3 shows how strongly perceptions of injustice are related to protest behavior in 2020. People who attended a protest in 2020 were much more likely than those who did not to believe that Black people were treated particularly unfairly by police and by the government and society at large. About three-quarters of protesters thought the police treated white people better than Black people and that the latter faced significant discrimination. Only about half of those who did not protest held these views.
Table 4-3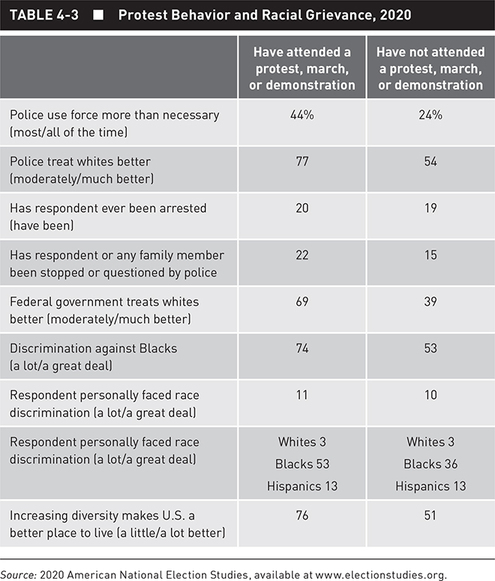
Source: 2020 American National Election Studies, available at www.electionstudies.org.
Table 4-3 also provides evidence for the argument that, in general, it is not personal, individual experiences or self-interest that matters. Whether people had been arrested or not is unrelated to protest behavior. Police stopping and questioning the respondent or a family member of the respondent had a small impact (a 7-percentage-point difference), but the effect isn’t large. Personally facing racial discrimination also did not increase the likelihood of protesting, although it is unlikely that white people who feel they have been discriminated against for their race would feel much affinity with the BLM movement. Breaking down responses to this question by race, it is clear that whether whites and Hispanics had experienced discrimination was not related at all to protest behavior. For Black people, on the other hand, it was. Over half of Black protesters said they had experienced racial discrimination compared to only a third of those who did not protest. Overall, though, it is people’s beliefs that Black people as a group are treated unfairly by the police, the government, and society that set protesters apart from those who do not take to the streets.
People who participated in the BLM protests in 2020 were likely motivated by a desire to see real change in the United States, especially on race issues. One question in the ANES survey, asking if diversity makes the United States a better place to live in, gets at the idea that some protesters want their country to reflect the values they think are important. Three-quarters of protesters said diversity would make the United States a little or a lot better (the two most positive responses) compared to just half of people who did not protest. People on the left tend to identify less strongly as Americans than people on the right, and this is in part connected to their belief in constructive patriotism and the idea that the country has a lot of work left to do to achieve its laudatory goal of equality.30
The clash over American identity was front and center in the 2020 presidential election, as was the idea of suffering an injustice and a grievance. Donald Trump ran in 2016 under the slogan “Make America Great Again” (MAGA). In a fascinating study by Rachel Blum and Christopher Parker,31 MAGA supporters, Trump’s loyal base, expressed a high level of grievance, with over 80 percent believing that “real Americans are losing freedoms,” “the American way of life is disappearing,” and “forces are changing our country for the worse.” They thought Trump had spent his four years as president turning things around or at least being the first president in a long time to try to slow down the terrible things they thought were happening. Trump’s reelection in 2020 was therefore essential if the America they wanted was to be saved, yet almost all MAGA supporters thought the 2020 election results were fraudulent and couldn’t be trusted.32 In the 2020 swing state study referenced earlier, 30 percent of people thought that the traditional American way of life was changing so fast, force might be required to save it. Another 21 percent agreed with the idea that patriotic Americans might need to take the law into their own hands, and 30 percent believed that strong leaders might have to bend rules to get things done.
If the outcome of the election was deeply important and people believed the lie that the election was stolen, they had a strong motivation to protest. From their perspective, a democratic country must follow the will of the people, and going against the people’s will by accepting fraudulent election results must not be allowed to happen in America. The injustice of losing the election when Trump so clearly won, MAGA supporters believed, must not be tolerated. With Trump and his backers rallying people to “Stop the Steal,” many MAGA supporters participated in local rallies or traveled to Washington, DC, to stop Joe Biden from becoming president. They were also willing to bear substantial costs to participate in the attempted coup at the U.S. Capitol on January 6, 2021, to try to correct what they perceived to be an injustice. The fact that the injustice was based on a lie does not make the impact of group identity any less strong. Trump supporters thought they were being harmed, and they could join together as a group to insist that Trump be reinstated as president for a second term.
The ANES survey was fielded in late 2020, so the survey does not ask about the January 6 event. Fortunately, a poll fielded on January 6, 2021, can give us some insight about the storming of the U.S. Capitol. Respondents were asked, “Supporters of President Trump have stormed the U.S. Capitol to protest lawmakers certifying Joe Biden’s election victory. Based on what you have read or heard about this, do you support or oppose these actions?” Ninety-six percent of Democrats and 67 percent of independents said they strongly or somewhat opposed the storming of the Capitol. Among Republicans, 43 percent opposed the actions, and among voters who thought the election was fraudulent, only 34 opposed the actions. When asked how to characterize those who stormed the Capitol, Democrats overwhelmingly said they were “extremists” (74 percent) and “domestic terrorists” (78 percent). Republicans were less likely to label them anything, but the two highest characterizations were “protestors” (50 percent) and “patriots” (30 percent).33 Among Americans who thought the 2020 election results were fraudulent, 18 percent supported or strongly supported the storming of the Capitol, compared to only 2 percent who thought the election results were accurate.34 Unfortunately, we do not have data on the people who actually participated in the insurrection on January 6. It is not too far a stretch, though, to guess that they strongly identified as MAGA supporters and felt highly aggrieved given the election results. Opinions about the veracity of the election were also related to other major political issues. The swing state study conducted a follow-up panel survey in the spring of 2021, finding that a belief that the election was stolen from President Trump was positively correlated with a refusal to get a COVID-19 vaccine.
THE USE OF VIOLENCE TO ACHIEVE POLITICAL ENDS
The vast majority of protests, marches, and demonstrations that occur in the United States are peaceful. For example, and contrary to the widespread narrative surrounding the BLM protests in the summer of 2020, almost all of the protests were peaceful. According to Erica Chenoweth and Jeremy Pressman, of the over seven thousand BLM protest events in the summer of 2020, only 3.7 percent involved property damage, 1.6 percent involved injury to protesters or bystanders, and 1 percent involved injury to police officers.35 Yet Americans have persisted in believing that the protests were violent. ANES respondents were asked if the protests “during the past few months,” which refers primarily to the BLM protests, had been mostly violent or mostly peaceful. About a third (31 percent) said they had been mostly violent, a third said they had been equally violent and peaceful, and another 13 percent said they had been a little more peaceful. Under a quarter (23 percent) said they were a lot more peaceful. The media overwhelmingly covered any violence to person or property that occurred, which explains public misperceptions, but the data clearly show the protests were mostly peaceful.
But incidents of political violence have increased significantly in recent years. Hate crimes increased 3 percent in 2019, with over seven thousand incidents for the third year in a row, and the attacks were more violent than usual. According to FBI data, anti-Jewish hate crimes rose 14 percent, and anti-Hispanic hate crimes rose 9 percent.36 There was also an increase in anti-Asian hate crimes beginning with the rise of the pandemic in March 2020.37 Perceptions of political violence reflect the actual increase in violence. Respondents to the ANES survey thought the use of violence to pursue political goals had increased over the previous four years, with almost half, 45 percent, thinking it had increased a great deal and another 31 percent thinking it had increased a little or a moderate amount. Only 3 percent thought it had decreased.
Political analysts have become increasingly concerned about Americans’ acceptance of the use of violence to gain political goals. Bright Line Watch has fielded surveys several times a year since 2017 to gauge expert and public opinion about the state of democracy and democratic practices.38 Starting in October 2020, based on questions from Nathan Kalmoe and Lilliana Mason, the Bright Line Watch respondents were asked about political violence used by their own or the opposing party. The results in Table 4-4 show that Americans in general do not think political violence is justified. When asked how often it is justified for one’s own party to use violence, almost all respondents said never, and this remained stable across the three surveys. Most people were also unwilling to entertain the use of violence if the opposing party won the election. Interestingly, fewer people thought using violence in this circumstance was never justified before the election (79 percent) than thought it was never justified after the election (86 percent in November and 88 percent in early 2021). Political violence becomes much more palatable to people when they view it as reciprocity. Only about two-thirds of respondents said violence was never justified as a response to the opposing party engaging in violence.
Table 4-4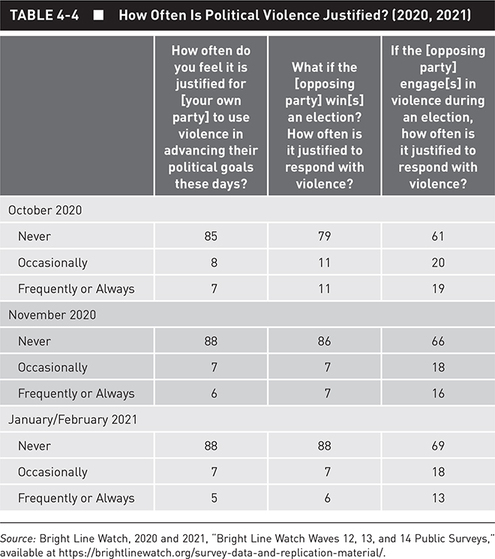
Source: Bright Line Watch, 2020 and 2021, “Bright Line Watch Waves 12, 13, and 14 Public Surveys,” available at https://brightlinewatch.org/survey-data-and-replication-material/.
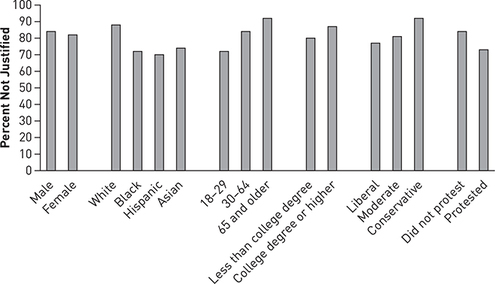
To get a sense of who opposes the use of political violence, we return to the ANES data. In the 2020 survey, respondents were asked, “How much do you feel it is justified for people to use violence to pursue their political goals in this country?” We focus on those who said not at all. Other possible responses were a little, a moderate amount, a lot, and a great deal, so anyone who did not say not at all was condoning some use of political violence. Figure 4-4 breaks down responses by demographic and political variables. Those who most oppose the use of political violence are whites, older people, the college educated, and conservatives. Younger people, people of color, and those who said they had attended a protest in the past twelve months were the least likely to oppose the use of violence to pursue political goals.
 Description
Figure 4-4 Who Believes Political Violence Is Not Justified? (2020)
Source: 2020 American National Election Studies, available at www.electionstudies.org.
Most Americans do not condone the use of political violence, and as we noted earlier, most protests are peaceful in the United States. We have seen an uptick, though, in the number of people who think using violence for political gains is justified. What explains the increase in political violence and its acceptance? Recent research suggests that people are more likely to endorse the use of political violence when they moralize the issue and when they think other people share their moral values on the matter.39 Both the increased moralization of partisan differences and the widespread use of social media feeding people’s politically homogeneous social networks raise the possibility that there will be more political violence in the future. The more people believe political violence is justified, the more likely they are to use it and to condone it even if they haven’t been involved.
UNCONVENTIONAL PARTICIPATION AND DEMOCRACY
In Chapter 1, we discussed Americans’ support for democracy and for undemocratic alternatives that might seem appealing at a time when major problems loom over the country and the world. Using violence to obtain political goals is not only illegal; it is also undemocratic. We might therefore expect to find a relationship between support for democracy and the belief that political violence is not justified. According to the ANES data, this is the case. Eighty-seven percent of people who are very satisfied with democracy think political violence is not justified, compared to 79 percent of those who say they are not at all satisfied with democracy. A better way to look at the situation, though, might be to determine if those who hold undemocratic beliefs are more likely to support the use of political violence. It does not take many people to turn a peaceful protest into violent mayhem. While the numbers are small, they are disconcerting. Among people who like the idea of having a strong leader who is willing to “bend the rules” to get things done, 7 percent believe that political violence is always justified. Similarly, 9 percent of people who think the will of the majority should always prevail also think political violence is always justified. Almost no one who opposes these approaches to government decision making is supportive of using political violence to get one’s way.
In contrast, the U.S. Constitution protects Americans’ right to free speech and assembly. People can sign petitions, boycott products and businesses, and engage in peaceful protests, marches, and demonstrations as much as they want. People who have been marginalized in the American political system—political minorities for whom the reciprocity of winning and losing hasn’t been real—and their political allies have been the most likely to get involved in peaceful unconventional activities. Their efforts have led to meaningful change in the American political system. Conventional participation, including voting, has a major impact on political outcomes, but unconventional participation can give voice to those who have historically been kept silent.
Study Questions
1. Why are some people more likely to engage in unconventional participation than others?
2. How would you weigh the factors that influence unconventional participation? Do opportunities, recruitment, or group identities and grievances have the biggest impact on whether people protest?
3. The vast majority of Americans do not think political violence is ever justified, but there has been an increase in support for political violence in recent years. Why?
4. Is unconventional participation good or bad for democracy?
Suggested Readings
Barnes, Samuel H., Max Kaase, et al. Political Action: Mass Participation in Five Western Democracies. Beverly Hills, CA: SAGE, 1979. A classic in the study of participation, and especially unconventional participation, from a comparative perspective.
Gillion, Daniel. The Loud Minority: Why Protests Matter in American Democracy. Princeton, NJ: Princeton University Press, 2020. Innovative look at the impact of protests on electoral politics.
Hibbing, John R. The Securitarian Personality: What Really Motivates Trump’s Base and Why It Matters for the Post-Trump Era. Oxford: Oxford University Press, 2020. An in-depth look at Donald Trump’s most loyal base.
Ransby, Barbara. Making All Black Lives Matter: Reimagining Freedom in the 21st Century. Berkeley: University of California Press, 2018. A powerful look at the Black Lives Matter movement and the tactics it has used to push for systemic change in America.
Theiss-Morse, Elizabeth. Who Counts as an American? The Boundaries of National Identity. New York: Cambridge University Press, 2009. An examination of the dynamics of American identity and how it can marginalize and silence those who don’t “fit.”
Walsh, Katherine Cramer. Talking About Politics: Informal Groups and Social Identity in American Life. Chicago: University of Chicago Press, 2004. A fascinating study of how ordinary Americans use their group identities to make sense of politics in their everyday lives.
Internet Resources
Data on protests and riots are not as readily available as data on voting. Fortunately, the Armed Conflict Location & Event Data Project (ACLED) provides event data on protests, riots, and other political violence events around the world. The data set includes a vast amount of information on events, including dates, major actors, if political violence occurred, and a short synopsis of what took place. See https://acleddata.com/#/dashboard.
Bright Line Watch is a website that brings together political science data and research to monitor the state of democracy and the threats against democracy in the United States. For current data and reports, the web address is https://brightlinewatch.org/.
The World Values Survey website (www.worldvaluessurvey.org/wvs.jsp) provides access to public opinion data starting in the early 1980s through the present. Surveys are done worldwide, and numerous questions are asked about involvement in protests, beliefs about democracy, and other pertinent topics.
NOTES
1. Lani Guinier, Tyranny of the Majority: Fundamental Fairness in Representative Democracy, reprint ed. (New York: Free Press, 1995).
2. Xóchitl Bada, Jonathan Fox, and Jane Guskin, “Immigrant Rights Protests—Spring 2006,” Mapping American Social Movements Project, University of Washington, accessed May 3, 2021, http://depts.washington.edu/moves/2006_immigrant_rights.html.
3. Erica Chenoweth and Jeremy Pressman, “This Is What We Learned by Counting the Women’s Marches,” Monkey Cage (newsletter), Washington Post, February 7, 2017, https://www.washingtonpost.com/news/monkey-cage/wp/2017/02/07/this-is-what-we-learned-by-counting-the-womens-marches/.
4. Li Cohen, “Thousands Protest Violence Against Asian Americans During National Day of Action Protest,” CBS News, March 27, 2021, https://www.cbsnews.com/news/asian-american-protests-national-day-of-action-condemn-violence-against-asian-americans/.
5. Edwin Amenta, Neal Caren, Elizabeth Chiarello, and Yang Su, “The Political Consequences of Social Movements,” Annual Review of Sociology 36 (2010): 287–307; Edwin Amenta and Francesca Polletta, “The Cultural Impacts of Social Movements,” Annual Review of Sociology 45 (2019): 279–299.
6. Emily Van Duyn, “Hidden Democracy: Political Dissent in Rural America,” Journal of Communication 68 (2018): 965–987.
7. Samuel H. Barnes and Max Kaase, et al., “Political Action: An Eight Nation Study, 1973–1976” (ICPSR 7777), Inter-university Consortium for Political and Social Research, accessed June 3, 2021, https://www.icpsr.umich.edu/web/ICPSR/studies/7777.
8. 2020 Swing State Survey, conducted by the Center for Communication and Civic Renewal, University of Wisconsin–Madison.
9. Mancur Olson, The Logic of Collective Action: Public Goods and the Theory of Groups (Cambridge, MA: Harvard University Press, 1965).
10. Armed Conflict Location & Event Data Project (ACLED), accessed July 3, 2021, www.acleddata.com. The region was limited to the United States. The event type was filtered to include only riots and protests. ACLED defines protests as “public demonstration[s] against a political entity, government institution, policy or group in which the participants are not violent” and riots as “violent events where demonstrators or mobs engage in disruptive acts or disorganised acts of violence against property or people” (see “User Quick Guide,” April 2019, https://acleddata.com/acleddatanew/wp-content/uploads/dlm_uploads/2019/04/General-User-Guide_FINAL-1.pdf).
11. These questions were asked by ANES in late 2020, after the election, so the reference to “the past twelve months” encompasses all of 2020.
12. ACLED, www.acleddata.com.
13. Betsy Sinclair, The Social Citizen: Peer Networks and Political Behavior (Chicago: University of Chicago Press, 2012), 124. We combined strong, weak, and leaning partisans.
14. Diana C. Mutz and Jeffery J. Mondak, “The Workplace as a Context for Cross-Cutting Political Discourse,” Journal of Politics 68 (February 2006): 140–155.
15. Sidney Verba, Kay Lehman Schlozman, and Henry E. Brady, Voice and Equality: Civic Voluntarism in American Politics (Cambridge, MA: Harvard University Press, 1995).
16. Robert M. Bond, Christopher J. Fariss, Jason J. Jones, Adam D. I. Kramer, Cameron Marlow, Jaime E. Settle, and James H. Fowler, “A 61-Million-Person Experiment in Social Influence and Political Mobilization,” Nature 489 (September 13, 2012): 295–298.
17. Henri Tajfel, Differentiation Between Social Groups: Studies in the Social Psychology of Intergroup Relations (London: Academic Press, 1978).
18. Henri Tajfel, Social Identity and Intergroup Relations (Cambridge, England: Cambridge University Press, 1982); Naomi Ellemers, Russell Spears, and Bertjan Doosje, eds., Social Identity: Context, Commitment, Content (Oxford: Blackwell, 1999); Michael A. Hogg and Dominic Abrams, Social Identifications: A Social Psychology of Intergroup Relations and Group Processes (London: Routledge, 1988); Roderick M. Kramer and Marilynn B. Brewer, “Effects of Group Identity on Resource Utilization in a Simulated Commons Dilemma,” Journal of Personality and Social Psychology 46 (1984): 1044–1057.
19. Elizabeth Theiss-Morse, Who Counts as an American? The Boundaries of National Identity (New York: Cambridge University Press, 2009).
20. Emily Van Duyn, “Hidden Democracy: Political Dissent in Rural America,” Journal of Communication 68 (2018): 965–987.
21. M. Kent Jennings and Gregory B. Markus, “Partisan Orientations Over the Long Haul: Results From the Three-Wave Political Socialization Panel Study,” American Political Science Review 78 (December 1984): 1000–1018; M. Kent Jennings, “The Crystallization of Orientations,” Continuities in Political Action (Berlin, Boston: De Gruyter, 2014), 313–348.
22. Marilynn B. Brewer, “The Psychology of Prejudice: Ingroup Love or Outgroup Hate?,” Journal of Social Issues 55, no. 3 (1999): 429–444; C. W. Perdue, John F. Dovidio, M. B. Gurtman, and R. B. Tyler, “‘Us’ and ‘Them’: Social Categorization and the Process of Intergroup Bias,” Journal of Personality and Social Psychology 59 (1990): 475–486; Hogg and Abrams, Social Identification.
23. Marilynn B. Brewer, Intergroup Relations, 2nd ed. (Buckingham, England: Open University Press, 2003); Naomi Ellemers, Russell Spears, and Bertjan Doosje, eds., Social Identity: Context, Commitment, Content (Oxford: Blackwell, 1999); Daniel L. Wann and Nyla R. Branscombe, “Die-Hard and Fair-Weather Fans: Effects of Identification on BIRGing and CORFing Tendencies,” Journal of Sport and Social Issues 14, no. 2 (1990): 103–117.
24. Daniel L. Wann, Sport Fans: The Psychology and Social Impact of Spectators (New York: Routledge, 2001).
25. Bert Klandermans, “How Group Identification Helps to Overcome the Dilemma of Collective Action,” American Behavioral Scientist 45, no. 5 (January 2002): 887–900; Jacquelien van Stekelenburg, Bert Klandermans, and Wilco W. van Dijk, “Combining Motivations and Emotion: The Motivational Dynamics of Protest Participation,” Revista de Psicologia Social 26, no. 1 (2011): 91–104; Jacquelien van Stekelenburg, “The Political Psychology of Protest,” European Psychologist 18, no. 4 (2013): 224–234.
26. Chris Wells, Katherine J. Cramer, Michael W. Wagner, German Alvarez, Lewis A. Friedland, Dhavan V. Shah, Leticia Bode, Stephanie Edgerly, Itay Gabay, and Charles Franklin, “When We Stop Talking Politics: The Maintenance and Closing of Conversation in Contentious Times,” Journal of Communication 67 (2017): 131–157; Michael W. Wagner, Chris Wells, Lewis A. Friedland, Katherine J. Cramer, and Dhavan V. Shah, “Cultural Worldviews and Contentious Politics: Evaluative Asymmetry in High-Information Environments,” The Good Society 23, no. 2 (2014): 126–144.
27. P. G. Klandermans, “Identity Politics and Politicized Identities: Identity Processes and the Dynamics of Protest,” Political Psychology 35, no. 1 (2014): 1–22; Arthur H. Miller, Patricia Gurin, Gerald Gurin, and Oksana Malanchuk, “Group Consciousness and Political Participation,” American Journal of Political Science 25 (August 1981): 494–511.
28. Michael Tesler, “Republicans and Democrats Agree on the Protests but Not Why People Are Protesting,” FiveThirtyEight (blog), June 17, 2020, https://fivethirtyeight.com/features/republicans-and-democrats-increasingly-agree-on-the-protests-but-not-why-people-are-protesting/.
29. Jeff Spinner-Halev and Elizabeth Theiss-Morse, “Social Justice and Solidarity Survey,” July/August 2020.
30. Leonie Huddy and Nadia Khatib, “American Patriotism, National Identity, and Political Involvement,” American Journal of Political Science 51 (January 2007): 63–77.
31. Rachel M. Blum and Christopher Sebastian Parker, “Panel Study of the MAGA Movement,” accessed May 22, 2021, https://sites.uw.edu/magastudy/.
32. Ibid.
33. Matthew Smith, Jamie Ballard, and Linley Sanders, “Most Voters Say the Events at the US Capitol Are a Threat to Democracy,” YouGovAmerica, January 6, 2021, accessed May 22, 2021, https://today.yougov.com/topics/politics/articles-reports/2021/01/06/US-capitol-trump-poll.
34. Domenico Montanaro, “Poll: Majority of Americans Blame Trump for Violence at Capitol,” NPR, January 15, 2021, https://www.npr.org/2021/01/15/956850131/poll-majority-of-americans-blame-trump-for-violence-at-capitol; PBS NewsHour/Marist Poll, conducted January 7, 2021, http://maristpoll.marist.edu/npr-pbs-newshour-marist-poll-results-trump-the-insurrection/#sthash.upYvWaDn.dpbs.
35. Erica Chenoweth and Jeremy Pressman, “This Summer’s Black Lives Matter Protesters Were Overwhelmingly Peaceful, Our Research Finds,” Monkey Cage (newsletter), Washington Post, October 16, 2020, https://www.washingtonpost.com/politics/2020/10/16/this-summers-black-lives-matter-protesters-were-overwhelming-peaceful-our-research-finds/.
36. Hannah Allam, “FBI Report: Bias-Motivated Killings at Record High Amid Nationwide Rise in Hate Crimes,” NPR, November 16, 2020, https://www.npr.org/2020/11/16/935439777/fbi-report-bias-motivated-killings-at-record-high-amid-nationwide-rise-in-hate-c.
37. Kimmy Yam, “There Were 3,800 Anti-Asian Racist Incidents, Mostly Against Women, in Past Year,” NBC News, March 16, 2021, https://www.nbcnews.com/news/asian-america/there-were-3-800-anti-asian-racist-incidents-mostly-against-n1261257.
38. Bright Line Watch, “Bright Line Watch Waves 12, 13, and 14 Public Surveys,” October and November 2020 and January/February 2021, https://brightlinewatch.org/survey-data-and-replication-material/.
39. Marlon Mooijman, Joe Hoover, Ying Lin, Heng Ji, and Morteza Dehghani, “Moralization in Social Networks and the Emergence of Violence During Protests,” Nature Human Behaviour 2 (2018): 389–396.
Descriptions of Images and Figures
Back to Figure
The horizontal axis shows different unconventional activities. The vertical axis shows percent and ranges from 0 to 100 in increments of 10. The approximate data from the graph are tabulated below.
Back to Figure
The horizontal axis ranges from January 2020 to March 2021. The vertical axis is labeled number of protests and riots and ranges from 0 to 8000 in increments of 1000. The approximate data from the graph are tabulated below.
Back to Figure
The horizontal axis shows various unconventional activities. The vertical axis shows percentage and ranges from 0 to 100 in increments of 10. The approximate data from the graph are tabulated below.
Back to Figure
The horizontal axis shows various social compositions. The vertical axis ranges from 0 to 100 in increments of 10. The approximate data from the graph are tabulated below.