
In the previous chapters the strategies were compared to a single benchmark: the S&P 500 Index. In this chapter they will be compared to sector indices.
Two series of indices will be used: the first one is static and capital-weighted, the second one is dynamic and based on a quantitative model. Comparing strategies with sector-based benchmarks is a more accurate way to judge them individually. Data are taken not directly from the indexes, but from ETFs based on them. Transaction and management costs are included on both sides, giving a realistic comparison from an investor’s point of view.
S&P Select Sector Indexes
Definition
The following definition is an interpretation of information publicly available on the website spindices.com. A complete methodology document can be downloaded from this website.
All components of the S&P 500 are classified in their respective GICS sector, except for the Telecommunication Services sector which is grouped with Information Technology.
As a consequence:
ETFs
The Select Sector SPDR Fund series aims at replicating, before expenses, the price and yield performance of these indexes. Here are the tickers by GICS sectors:
Table 15.1: Tickers of the Select Sector SPDR Fund series for GICS sectors
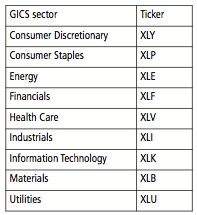
The annual net expense ratio is 0.17%. The nine ETFs have traded since 16 December 1998, which allows for a comparison on the whole backtest period.
Performances
The following bar charts compare the non-hedged S&P 500 lazy strategies with the corresponding sector ETFs for the period 1/1/1999 to 1/1/2014. (A table in Appendix 3 gives the underlying numbers.)
Fig 15.1: Comparison of returns for lazy strategies v S&P Select Sector ETFs
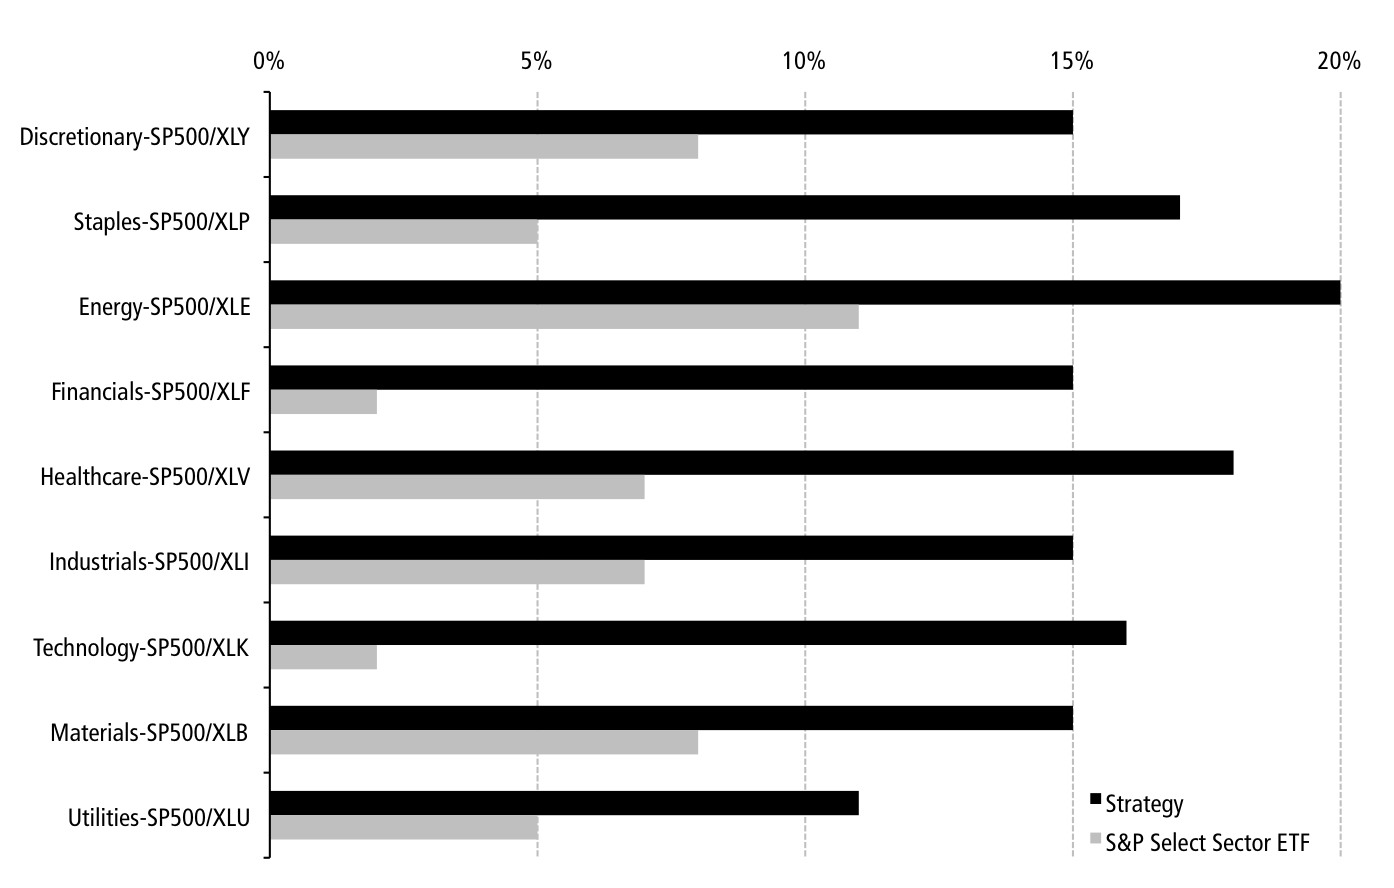
It can be seen in Fig 15.1 that all the S&P 500 lazy strategies have superior annualised returns than their benchmarks. The minimum additional annualised return is 6%. The Financials and Information Technology sectors have the best results: more than 14% of additional annualised return.
Looking at Fig 15.2, lazy strategies have a lower or equal risk (standard deviation) in five sectors: Consumer Discretionary, Consumer Staples, Materials and Utilities. When the risk is higher, the maximum difference in standard deviation is 4%.
Fig 15.2: Comparison of standard deviation for lazy strategies v S&P Select Sector ETFs

Fig 15.3: Comparison of max drawdown for lazy strategies v S&P Select Sector ETFs
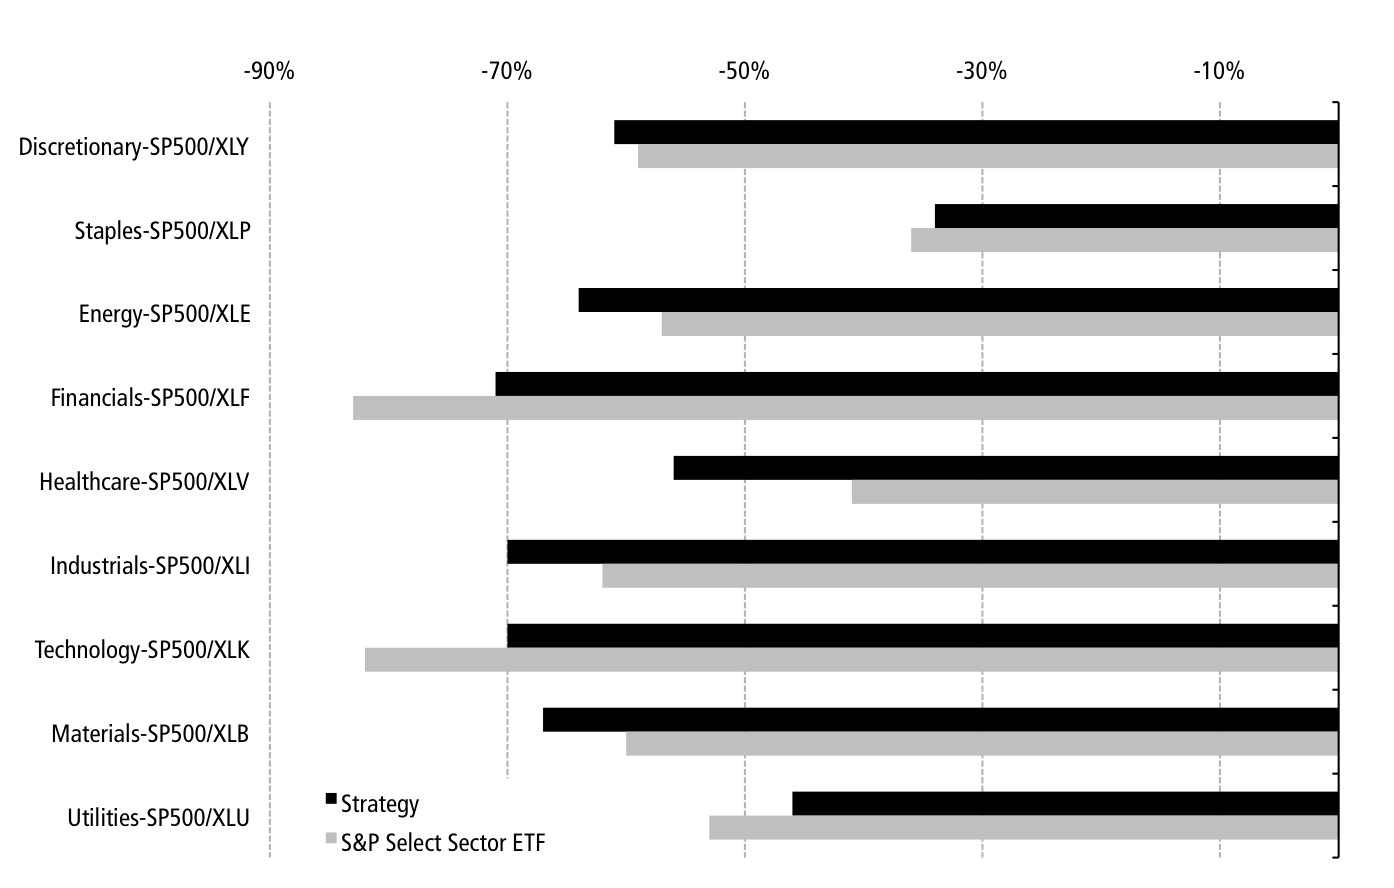
In five cases out of nine, lazy strategies have a deeper drawdown. The maximum difference in drawdown is 15% in Health Care.
The following bar chart compares the risk-adjusted returns measured by the Sortino ratio.
Fig 15.4: Comparison of Sortino ratios with static sector benchmarks
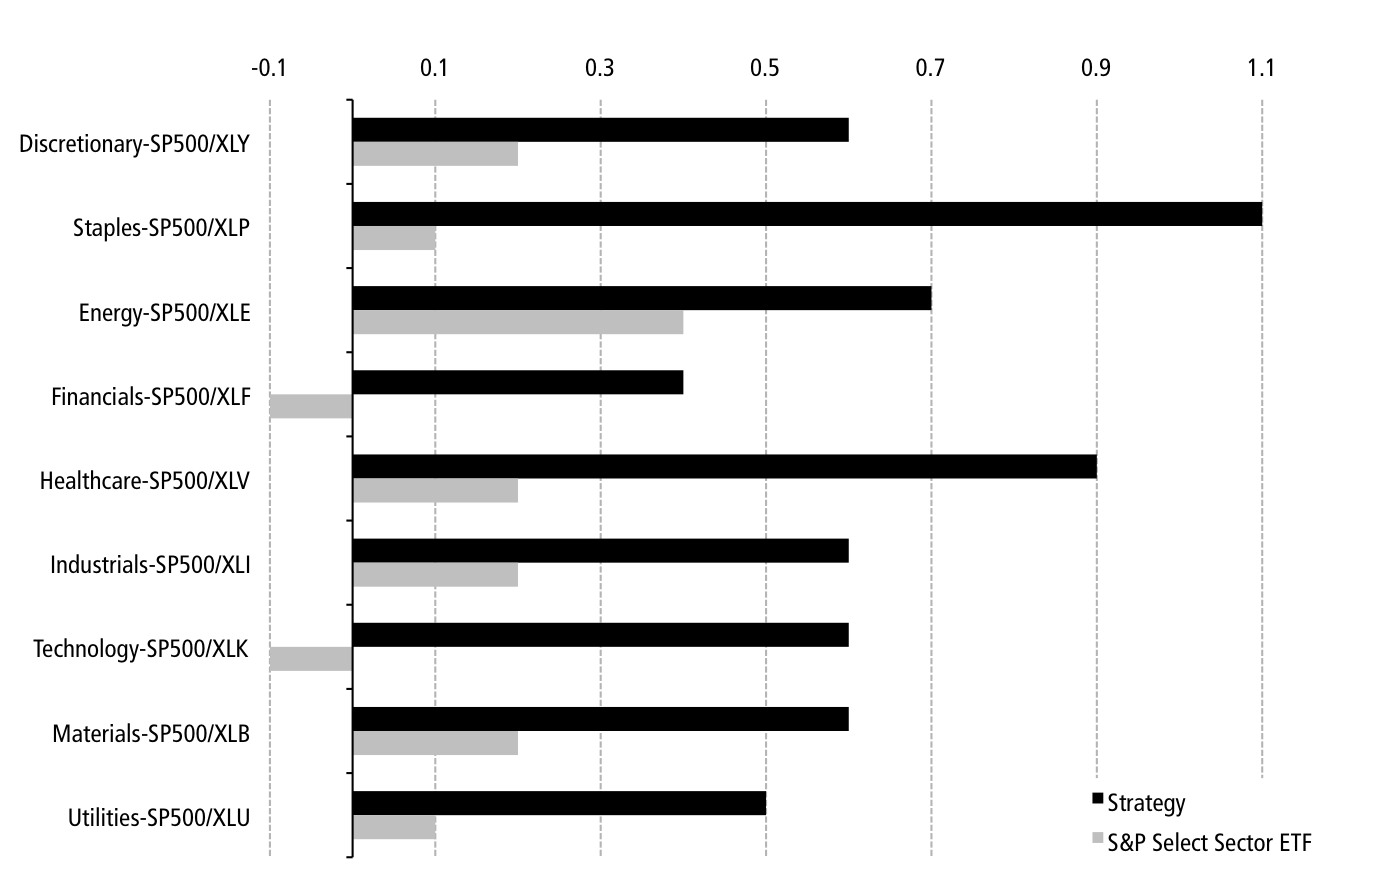
All the S&P 500 lazy strategies have a better risk-adjusted performance than their benchmarks. The minimum difference in Sortino ratio is 0.3.
Amex StrataQuant Indexes
Definition
The following index methodology description is an interpretation of information publicly available on the website nyse.com. More details can be found on the websites of NYSE EURONEXT (www.euronext.com) and AMEX (www.amex.com).
Every quarter, all stocks in the Russell 1000 universe are given a growth score and a value score based on three price momentums and four quantitative fundamental factors. For a stock classified by Russell only as growth or only as value, the selection score is the score of its style. Otherwise, it is the best of both scores. In each sector, the bottom 25% is eliminated and the rest is ranked regarding the selection score and split into five subsets. The top subset has a capital allocation of 33.3%, the second has an allocation of 26.7%, the third has 20%, the fourth has 13.3%, the last has 6.7%. Within a subset, stocks have an equal weight.
There are notable differences with our lazy S&P 500 strategies:
ETFs
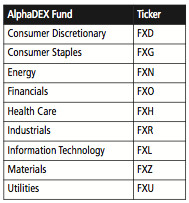
The First Trust AlphaDEX fund series aims at replicating, before expenses, the price and yield performance of the StrataQuant Indexes. Here is the list of tickers for the AlphaDEX funds by GICS sectors.
Table 15.2: Tickers of the AlphaDEX fund series for GICS sectors
The annual net expense ratio for the funds is 0.7%. The nine AlphaDEX ETFs have traded since 8 May 2007. This is a shorter period, however it does include a bear market (2008–2009) and a bull market (2009–2013).
Performance
The following bar charts compare the non-hedged S&P 500 lazy strategies with the corresponding AlphaDEX sector ETFs for the period 5/8/2007 to 1/1/2014. A table in Appendix 3 gives the precise figures.
The logic of the bar charts is the same as in the previous section.
Fig 15.5: Comparison of returns for lazy strategies v AlphaDEX sector ETFs

In spite of using simpler rules and a smaller set of stocks, almost all the S&P 500 lazy strategies have a better or equal annualised return than the respective AlphaDEX sector ETFs. The only exception is the Information Technology sector, with a relative loss of -1.3%. The best relative gain is in Consumer Staples and Energy with a 7.5% difference in annualised returns.
Fig 15.6: Comparison of standard deviation for lazy strategies v AlphaDEX sector ETFs
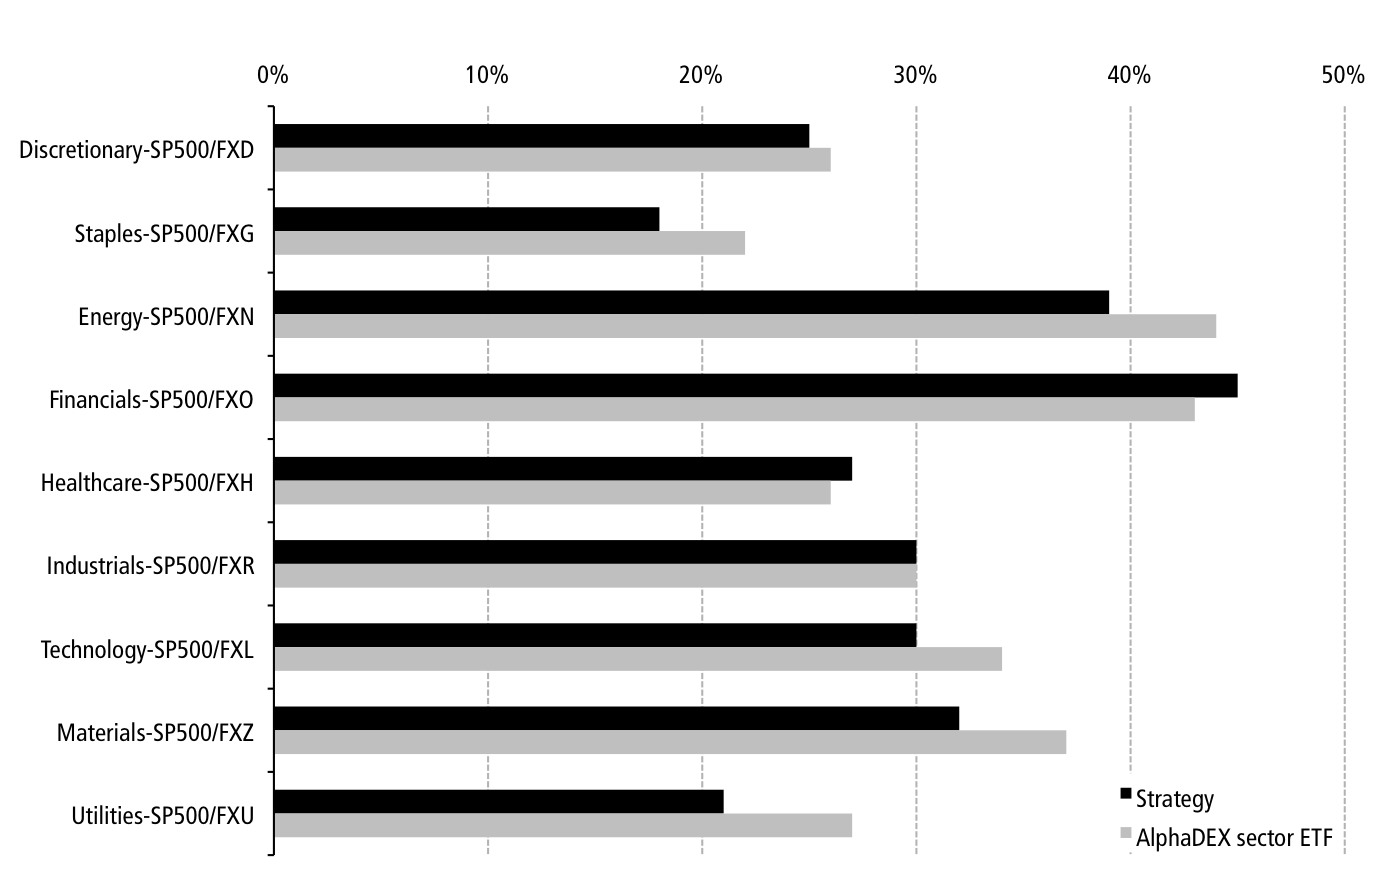
Even more interesting, the volatility (standard deviation) of lazy strategies is mostly below the volatility of corresponding AlphaDEX funds, despite having fewer holdings. When lazy strategies have a higher volatility (Financials, Health Care and Industrials), the maximum difference is 1.3%. When lazy strategies are less volatile, the maximum difference in volatility is 6.5%. It represents a significantly lower risk.
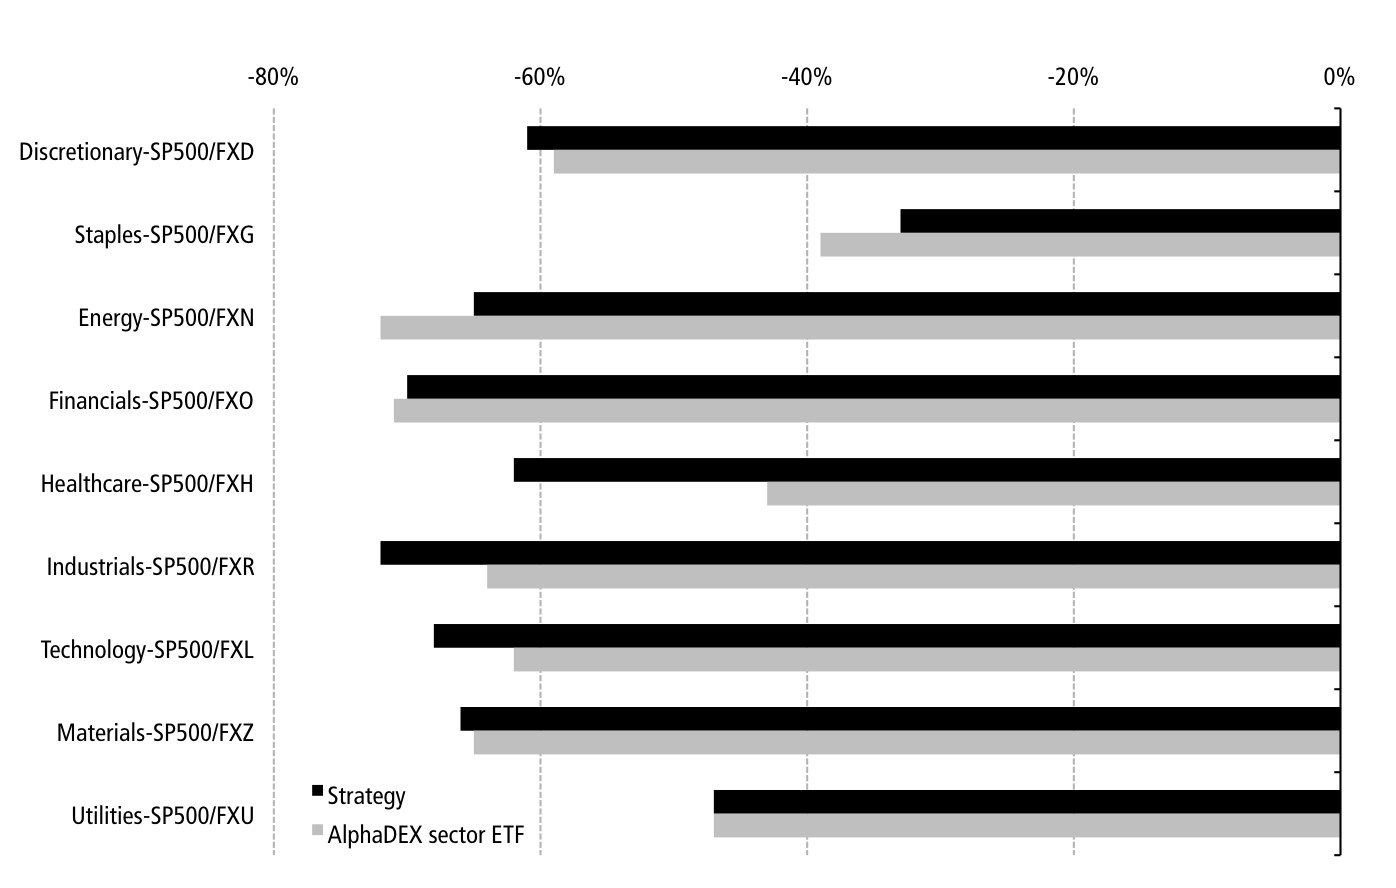
Looking at Fig 15.7, in four cases out of nine, lazy strategies have a deeper drawdown. The maximum difference in drawdown is 19% in Health Care.
Fig 15.7: Comparison of max drawdown for lazy strategies v AlphaDEX sector ETFs
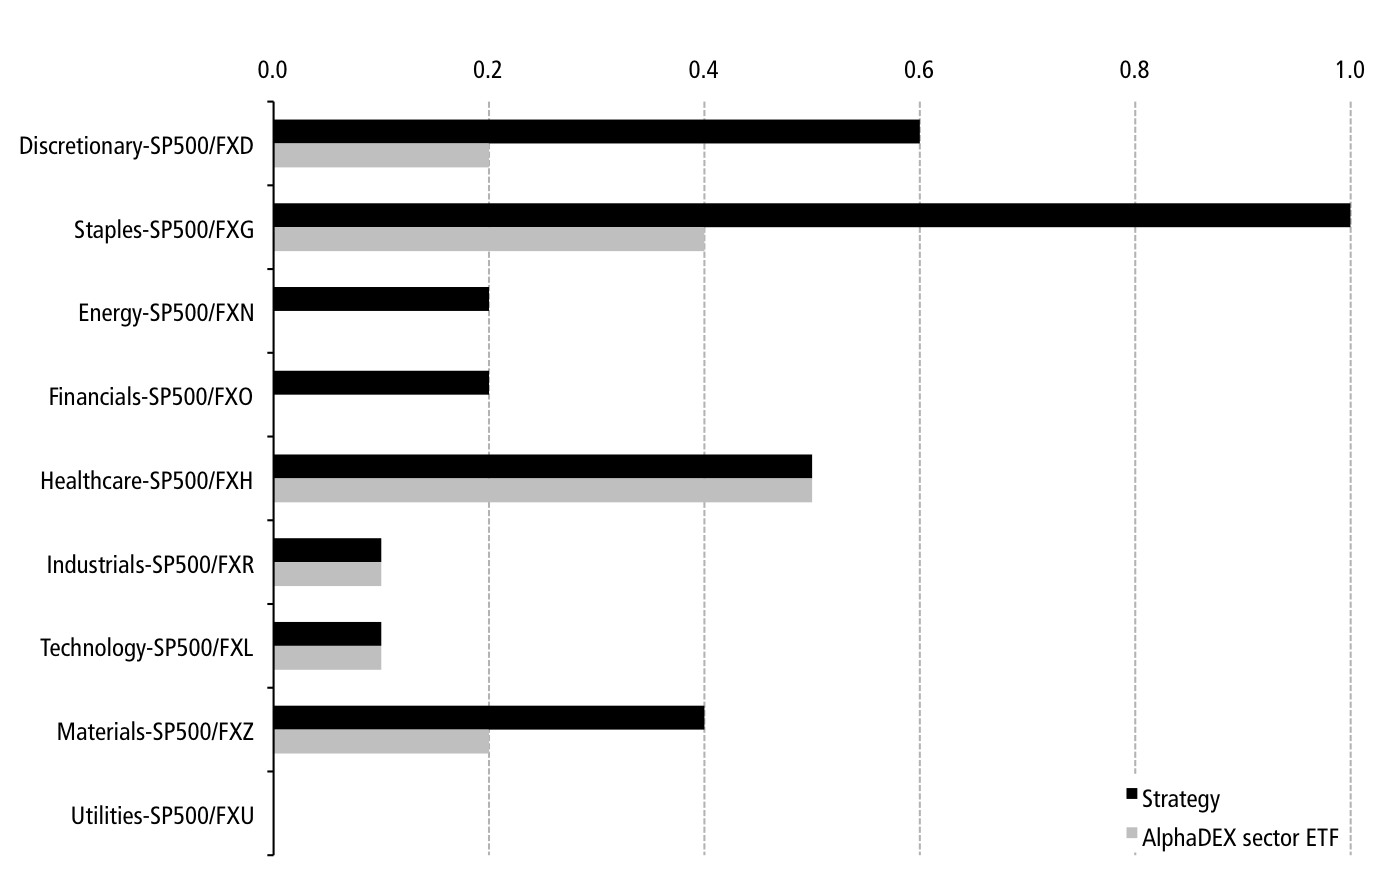
The following chart reports the Sortino ratios (no visible bar means ratio=0).
The S&P 500 lazy strategies have a better Sortino ratio than the AlphaDEX ETFs for five sectors. In the four other sectors they are equal. The largest advantage is in Consumer Staples.
Fig 15.8: Comparison of Sortino ratio for lazy strategies v AlphaDEX sector ETFs
Part II summary
Part III proposes some applications for how to use these models to build a real portfolio.