
CHAPTER 12
As a scholar of the Great Depression, I honestly believe that September and October of 2008 was the worst financial crisis in global history, including the Great Depression.
Ben Bernanke1
Introduction
This chapter begins by describing the 2008 financial sector meltdown that brought the world to the brink of a new Great Depression. It then describes the extraordinarily aggressive policy measures the Federal Reserve implemented to prevent that worst-case outcome. It details how the Fed used discounting operations to prevent the collapse of the global financial system and then open market operations to fuel economic recovery. The success of these policies prevented an economic catastrophe that our civilization may not have survived.
Meltdown
More than 13 years have gone by since the crisis of 2008. As time passes, memories fade. Therefore, this chapter will begin with a quick review of the events that nearly destroyed the global financial system.
Beginning in the Spring of 2007, the United States greatest financial institutions began falling like dominos.
In April 2007, New Century Financial Corporation, the second largest subprime mortgage lender in the United States, filed for bankruptcy. Its 2005 annual report, the last it published, showed total assets of $26 billion.
Countrywide Financial, with $212 billion of assets in 2007, also began encountering funding difficulties at that time. Countrywide was not only the largest subprime mortgage lender, it was the largest mortgage lender. It had originated nearly half a trillion dollars of loans during 2006 alone. In August 2007, Bank of America (BOA) came to Countrywide's rescue with a $2 billion investment. In January 2008, Bank of America bought the rest of Countrywide for $4 billion. This was an acquisition that Bank of America came to regret.
In March 2008, Bear Stearns was the United States' 17th largest financial institution. It had reported total assets of $395 billion in 2007. It was also on the brink of collapse. It was saved by Morgan Stanley and the Fed. The New York Fed agreed to lend Morgan Stanley $30 billion to facilitate its takeover of Bear Stearns. The Fed also agreed to take all the losses that might arise on Bear's assets after the first $1 billion of loses was borne by Morgan Stanley.
IndyMac, which was seized and shut down by the Office of Thrift Supervision and the FDIC in July, 2008, reported $33 billion of total assets in its 2007 annual report.
By early September, Fannie Mae and Freddie Mac were on the verge of bankruptcy. At that point, they were funding roughly 75% of all new mortgages in the country. They owned or guaranteed $5 trillion of mortgage debt. To put that into perspective, the total gross debt of the US government was $9 trillion in 2008.2 Their leverage ratio (i.e., the ratio of debt to equity) was 75 times. On September 8, they were placed in “conservatorship” by the government to prevent their collapse. According to the New York Fed, “Under these agreements, U.S. taxpayers ultimately injected $187.5 billion into Fannie Mae and Freddie Mac.”3 Fannie Mae had reported $883 billion in total assets in 2007, while Freddie Mac had reported $794 billion.
Merrill Lynch was also experiencing a funding crisis that month. They were acquired by Bank of America on September 14. This acquisition also cost BOA heavily during the quarters ahead. Merrill Lynch's 2007 annual report showed total assets of $1,020 billion.
The next day, Lehman Brothers filed for bankruptcy. It was by far the largest bankruptcy in US history. Lehman Brothers had $691 billion in total assets at the end of 2007.4
The day after that, the Fed lent AIG $85 billion to keep it afloat. Taxpayers received a 79.9% equity stake in AIG in return. AIG was one of the largest financial service companies in the world, with operations in more than 80 countries, tens of thousands of employees and a trillion-dollar balance sheet. The Fed's $85 billion capital infusion was not enough. The Fed and the Treasury ultimately committed more than $180 billion to its rescue.5
On September 21, Goldman Sachs and Morgan Stanley, the last two surviving investment banks, were hastily converted into bank holding companies in the attempt to reassure the financial markets that they would be able to tap emergency funding from the Fed.
Washington Mutual was shut down by the FDIC on September 25. With $300 billion in assets, it was the largest FDIC-insured bank ever to fail.
It looked as though Wachovia would be next in line. It was twice as large as Washington Mutual. It was saved in the nick of time on September 29, when Citigroup offered to acquire most of the company for $1 per share, in a deal in which the government offered to absorb any losses that exceeded $42 billion. In October, Wells Fargo made a better offer and acquired Wachovia.
On October 14, the government announced it would inject $125 billion of capital into the nine largest banks. JPMorgan, Wells Fargo, and Citi received $25 billion each. Bank of America got $15 billion. Morgan Stanley, Goldman Sachs, and Merrill Lynch were given $10 billion each. Bank of New York got $3 billion and State Street received $2 billion.
That was not enough to save Citi or Bank of America. On November 23, the government injected a further $20 billion of capital into Citigroup. On January 16, 2009, the government announced an additional $20 billion rescue package for Bank of America. Citigroup required still further government assistance in February 2009, by which point the government owned 36% of the bank.
The financing arms of the US automobile industry were also in crisis. Beginning in November 2008, the government provided $79.7 billion to General Motors, Chrysler, Ally Financial, Chrysler Financial, and automotive suppliers through the federal Auto Industry Financing Program.
If any one of the 10 largest US financial institutions had failed, in all probability that would have set off a chain of events that would have bankrupted practically every large financial institution in the world, wiping out most of the world's savings and dragging the global economy down into a new Great Depression in the process.
This calamity came about for four related reasons. First, the financial sector made risky loans, many of which eventually went bad. Second, the leverage ratio of the financial sector was far too high. In other words, the financial institutions lent much more than they should have, relative to the size of their capital. Third, the financial sector relied far too heavily on short-term sources of funding. And finally, the liquidity reserves of the banks were grossly inadequate – verging on nonexistent.
When the risky loans began to default, the capital of many institutions was too small to absorb the losses. As the severity of the problem came to be understood, a growing number of financial institutions found they could no longer borrow in the overnight money markets. Unable to borrow, many were soon unable to pay their creditors on time. Distress spread rapidly, and soon panic set in. Those with funds to lend, not knowing which institution would be next to fail, preferred not to lend at all. This situation grew steadily worse and in September 2008 the capital markets ceased to function altogether.
Saving the Financial System Through Discounting Operations
The Fed had been established with the principal purpose of stopping bank runs. It was given the power to create money (i.e., to extend Federal Reserve Credit) so that it could inject new money into the financial system when other sources of liquidity dried up. It had failed to prevent the collapse of the banking system during the early 1930s. It was determined not to fail again.
Therefore, as the crisis intensified, the Fed developed a series of programs to inject money into every corner of the financial system.6
Thus, the Fed put in place an array of lending facilities that flooded the capital markets with new money until practically any financial institution could borrow from the Fed using nearly any kind of debt instrument as collateral. The banks were able to borrow all they wanted from the Fed through TALF. The condition of the primary dealers was helped out by TSLF and PDCF. AMLF and TALF re-liquefied the asset-backed securities market. CPFF injected money into the commercial paper market. MMIFF and AMLF restored calm to the money markets.
During its near century of existence up to mid-2008, the Fed had created less than $1 trillion altogether. In the second half of 2008 alone, it created $1.3 trillion more. Chart 12.1 reflects this radical development.

CHART 12.1 The Fed's Total Assets, 1914 to 2008
Source: Data from “The Federal Reserve System’s Weekly Balance Sheet Since 1914” and accompanying spreadsheet. Johns Hopkins University, SAE/No.115/July 2018. See Bibliography.

CHART 12.2 Federal Reserve Credit Extended Through Discounting Operations, 2006 to 2010
Source: Data from the Financial Accounts of the United States, Table L. 109, Monetary Authority. The Federal Reserve7
The Fed injected this new money into the financial system by extending Federal Reserve Credit through discounting operations. Between mid-2007 and the end of 2008, the Fed's lending blew out from $25 billion to $1.7 trillion, as shown in Chart 12.2. That amount, $1.7 trillion, was nearly twice as large as the Fed's total assets had been in mid-2008.
Chart 12.3 shows how these loans were classified on the asset side of the Fed's balance sheet.
Ranked according to peak size, they were:
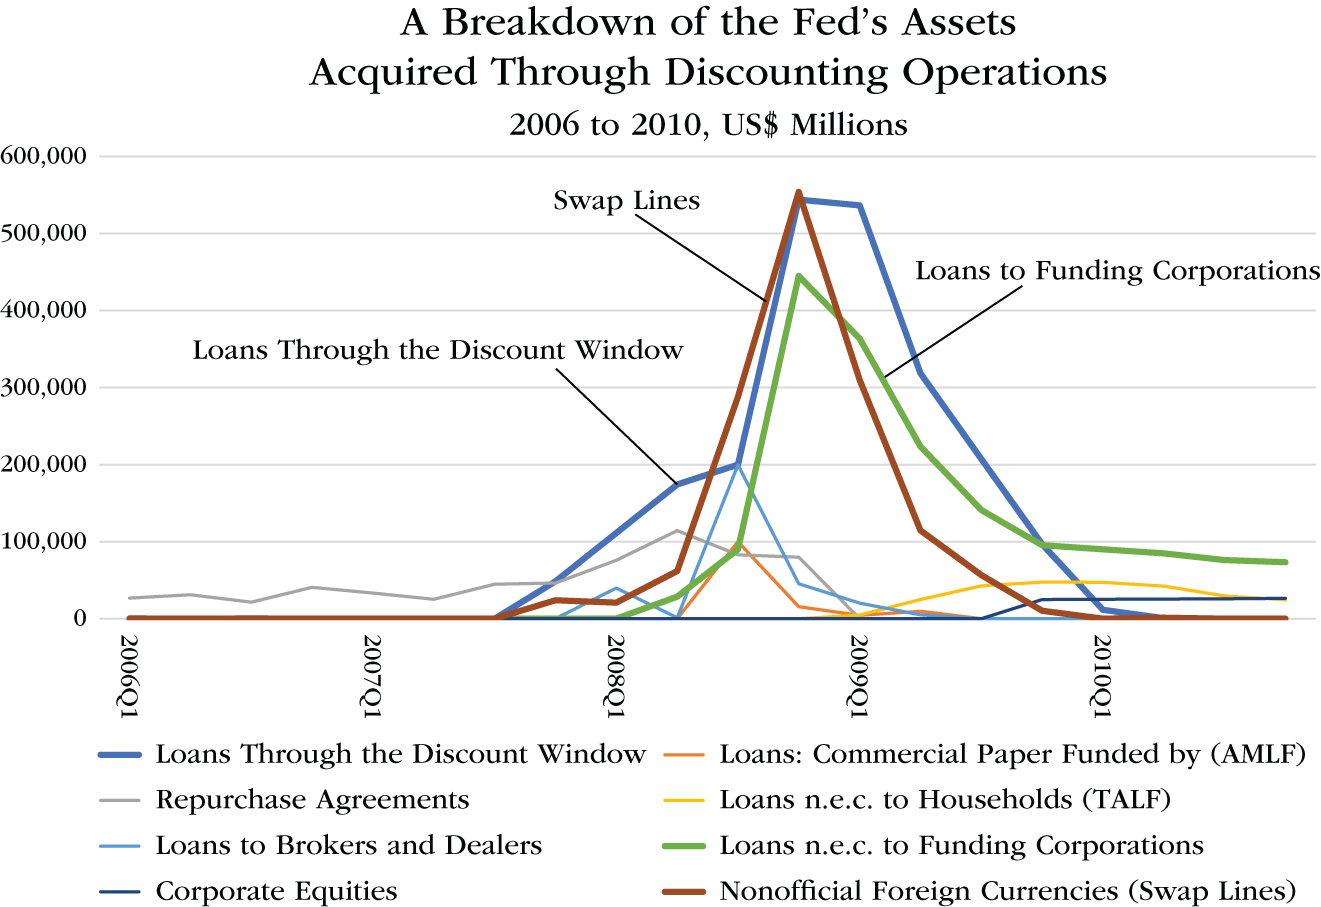
CHART 12.3 A Breakdown of the Fed's Discounting Operations, 2006 to 2010
Source: Data from the Financial Accounts of the United States, Table L. 109, Monetary Authority. The Federal Reserve8
Discounting is a common practice the Fed has employed from the time it was created. What makes the discounting operations during the crisis uncommon is the type of institutions the Fed lent to and the collateral the Fed was willing to accept in exchange for loans. To make these kinds of loans, the Fed revived “an obscure provision found in Section 13(3) of the Federal Reserve Act to extend credit to nonbank financial firms for the first time since the 1930s.”9 Section 13(3) allows the Fed to make such loans “in unusual and exigent circumstances.”
The Fed's greatest mistake in 2008 was to allow Lehman Brothers to fail. Lehman's failure set off shock waves and induced panic throughout the global financial system.
After Lehman Brothers' bankruptcy, however, the Fed's policy response to the crisis was very effective. Using various types of discounting operations, it found the means to extend Federal Reserve Credit to practically every type of financial institution that requested it.
The Fed injected so much liquidity into the financial system so quickly that the financial system did not collapse. This successful outcome demonstrates that a central bank can, by creating money on a large enough scale, stop a liquidity crisis even in a financial system suffering under trillions of dollars of seriously impaired assets.
Reflating the Economy Through Open Market Operations
The Fed's discounting operations ended the liquidity crisis that had paralyzed the capital markets during the last few months of 2008. However, the lack of short-term liquidity was only the beginning of the problems confronting the US financial system and the US economy more generally.
Exposure to bad loans, inadequate capital and plunging collateral values meant that a great number of financial institutions were still threatened with insolvency, even if their immediate liquidity problems were overcome.
Furthermore, the financial/credit crisis was simultaneously an economic crisis. For decades, the US economy had been driven by credit growth. When credit growth slowed sharply during 2008, the US economy began to collapse. GDP contracted by 8.2% in the fourth quarter of 2008 (at an annualized rate).10 Fed lending through discounting operations, even on an extraordinary scale, could not restore failing financial institutions to solvency. Nor could it generate sufficient aggregate demand to stop the economy's descent into depression. Very large-scale open market operations were required to overcome those crises.
On November 25, 2008, the Fed launched an audacious new phase of its policy response to the crisis by announcing that it would acquire up to $600 billion of debt instruments issued or guaranteed by the government-sponsored enterprises (GSEs): Fannie Mae, Freddie Mac, and Ginnie Mae. The Fed had often purchased debt securities through open market operations in the past, but never on a scale anything like this. This program became known as Quantitative Easing or QE for short. It proved to be so effective in reflating the economy that the Fed enlarged and extended the initial phase of QE; and later launched a second round in 2010 and a third round in 2012. Financial commentators referred to these successive rounds of Quantitative Easing as QE1, QE2, and QE3.11
Here are the details:
QE1
On November 25, 2008, the Fed announced “it would initiate a program to purchase up to $100 billion in direct obligations of housing-related government-sponsored enterprises and up to $500 billion in mortgage-backed securities (MBS) backed by Fannie Mae, Freddie Mac, and Ginnie Mae.”12
Then, at its March 2009 FOMC meeting, the Fed announced it would expand its asset purchases. “The Committee announced that, to provide greater support to mortgage lending and housing markets, it would increase the size of the Federal Reserve's balance sheet further by purchasing up to an additional $750 billion of agency MBS, bringing its total purchases of these securities up to $1.25 trillion in 2009, and that it would increase its purchases of agency debt this year by up to $100 billion to a total of up to $200 billion. Moreover, to help improve conditions in private credit markets, the Committee decided to purchase up to $300 billion of longer-term Treasury securities over the next six months.”13
Altogether, between late 2008 and early 2010, the Fed acquired $1.425 trillion of debt securities issued or guaranteed by the GSEs; and a further $300 billion of Treasury securities. That put the total size of QE1 at $1.725 trillion.14
QE2
At its August 2010 FOMC meeting, the Fed announced it would purchase an additional $600 billion of Treasury securities by the end of the second quarter of 2011. That took the Fed's holdings of Treasury securities up to $1.6 trillion by mid-2011.15
QE3
In September 2012, the Fed announced additional purchases of MBS at the pace of $40 billion per month. Shortly thereafter, in December 2012, the Fed announced that it would also purchase additional Treasury securities at the pace of $45 billion per month.16
Between December 2012 and December 2013, the Fed acquired $85 billion of debt securities each month. This was by far the Fed's most aggressive asset purchase program to date. The Fed then began to gradually “taper” the pace of its purchases and ended them altogether in October 2014. During the third round of Quantitative Easing, the Fed purchased $786 billion of Treasury securities and $736 billion of mortgage-backed securities.
Thus, altogether, during these three rounds of Quantitative Easing, the Fed acquired approximately $1.7 trillion of Treasury securities and $1.7 trillion of debt issued or guaranteed by the GSEs.
By the time QE3 was brought to a halt at the end of the third quarter of 2014, in total, the Fed owned $2.5 trillion of Treasury securities (up from $790 billion in mid-2007) and $1.7 trillion of debt issued or guaranteed by the GSEs (up from $0 as recently as mid-2008), as shown in Chart 12.4.
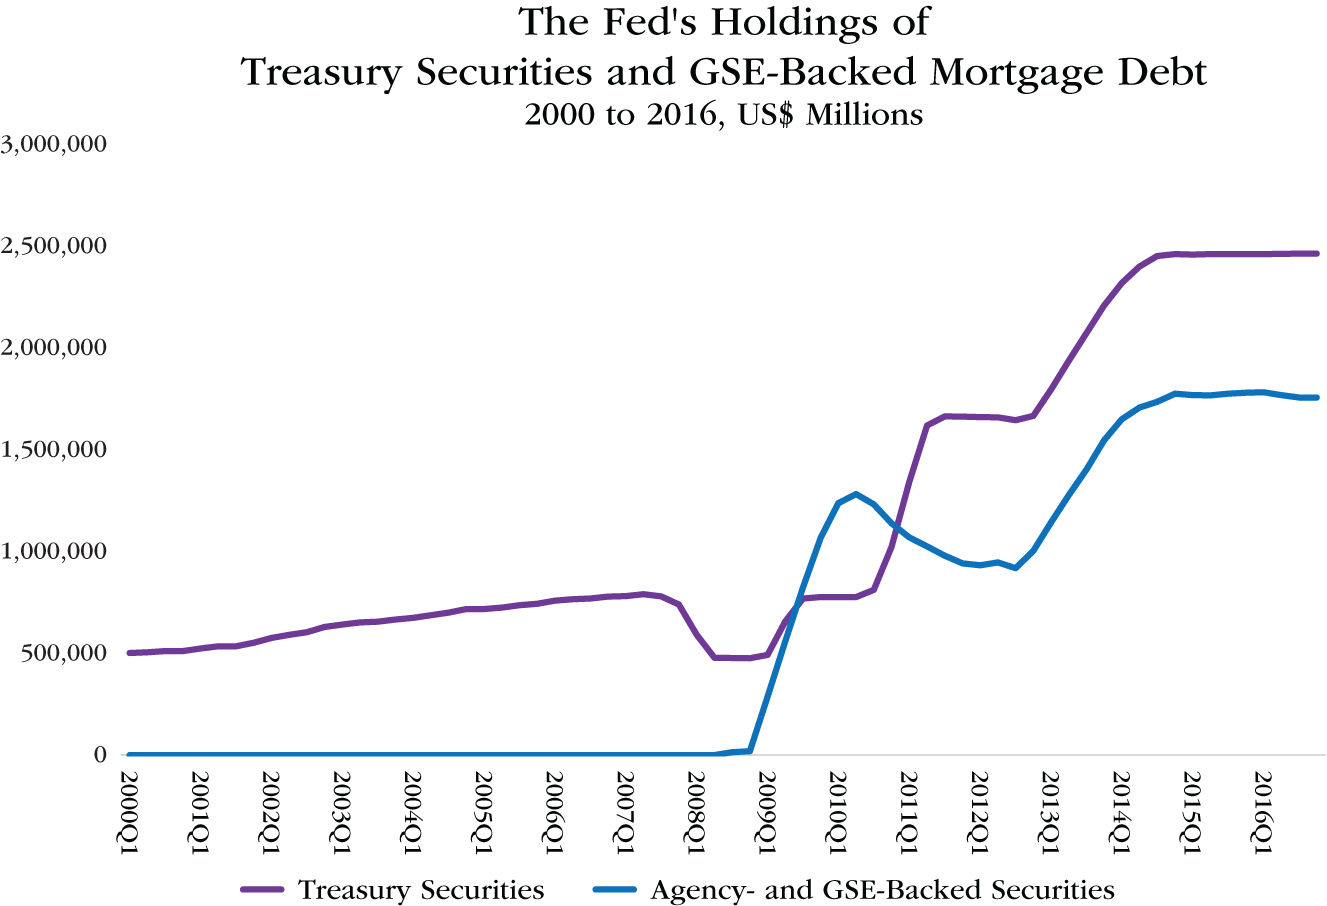
CHART 12.4 The Fed's Holdings of Treasury Securities and GSE-Backed Mortgage Debt, 2000 to 2016
Source: Data from the Financial Accounts of the United States, Table L. 109, Monetary Authority. The Federal Reserve17
Notice in Chart 12.4 that when the crisis began in 2008, the Fed's holdings of Treasury securities declined from $790 billion in mid-2007 to $480 billion in mid-2008. That occurred because the Fed sold down some of its holdings of Treasury securities in order to be able to fund its initial discounting operations.
Notice next that the Fed's large-scale purchases of mortgage-backed securities got underway at the very end of 2008, as already noted. A few months later, after the Fed expanded its asset purchases to include government bonds, its holdings of Treasury securities began to grow again.
Interestingly, the Fed ran down part of its holdings of mortgage-backed securities between mid-2010 and the third quarter of 2012, before reversing course and expanding its holdings of these assets to significantly higher levels by the end of 2014.
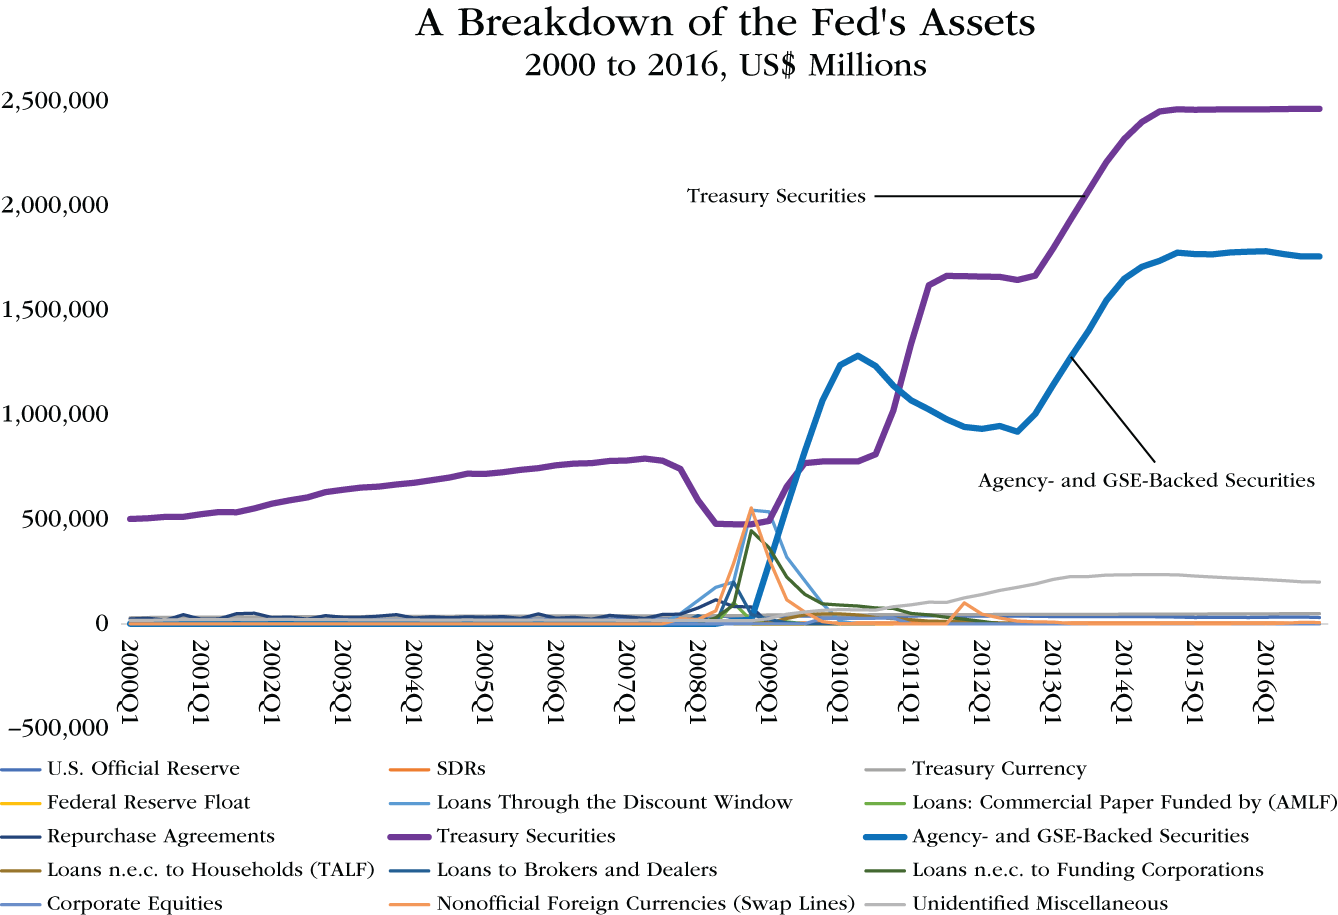
CHART 12.5 A Breakdown of the Fed's Assets, 2000 to 2016
Source: Data from the Financial Accounts of the United States, Table L. 109, Monetary Authority. The Federal Reserve18
To put the enormity of the Fed's open market purchases of Treasury securities and mortgage-backed securities into perspective, it is useful to present them along with the assets the Fed had accumulated as collateral through its discounting operations (described above) in one chart, showing a breakdown of the Fed's total assets. This is done in Chart 12.5.
The mortgage-backed securities and the Treasury securities that the Fed acquired through open market operations quickly dwarfed the assets it had accumulated as collateral in its discounting operations.
It is also important to understand that as the Fed flooded the financial markets with liquidity during the first round of Quantitative Easing, that liquidity enabled its recipients in the financial sector to repay the loans they had all received from the Fed through the Fed's emergency discounting operations. Consequently, as the central bank's holdings of mortgage-backed securities and Treasury bonds expanded, the collateral assets the Fed had obtained in exchange for the loans it had extended through discounting operations contracted, eventually returning to more normal levels by 2011. This can be seen more easily in Chart 12.6, which compares the assets the Fed obtained through its discounting operations with those it bought through its open market purchases.

CHART 12.6 Assets Obtained Through Discounting Operations vs. Assets Purchased Through Open Market Operations, 2000 to 2016
Source: Data from the Financial Accounts of the United States, Table L. 109, Monetary Authority. The Federal Reserve19
Altogether, the Fed's total assets, which it acquired by extending Federal Reserve Credit, skyrocketed from $950 billion at the end of 2007 to $4.5 trillion at the end of 2014. That was nearly a fivefold increase over seven years (see Chart 12.7). During World War II, the Fed's total assets had increased by only 80%.
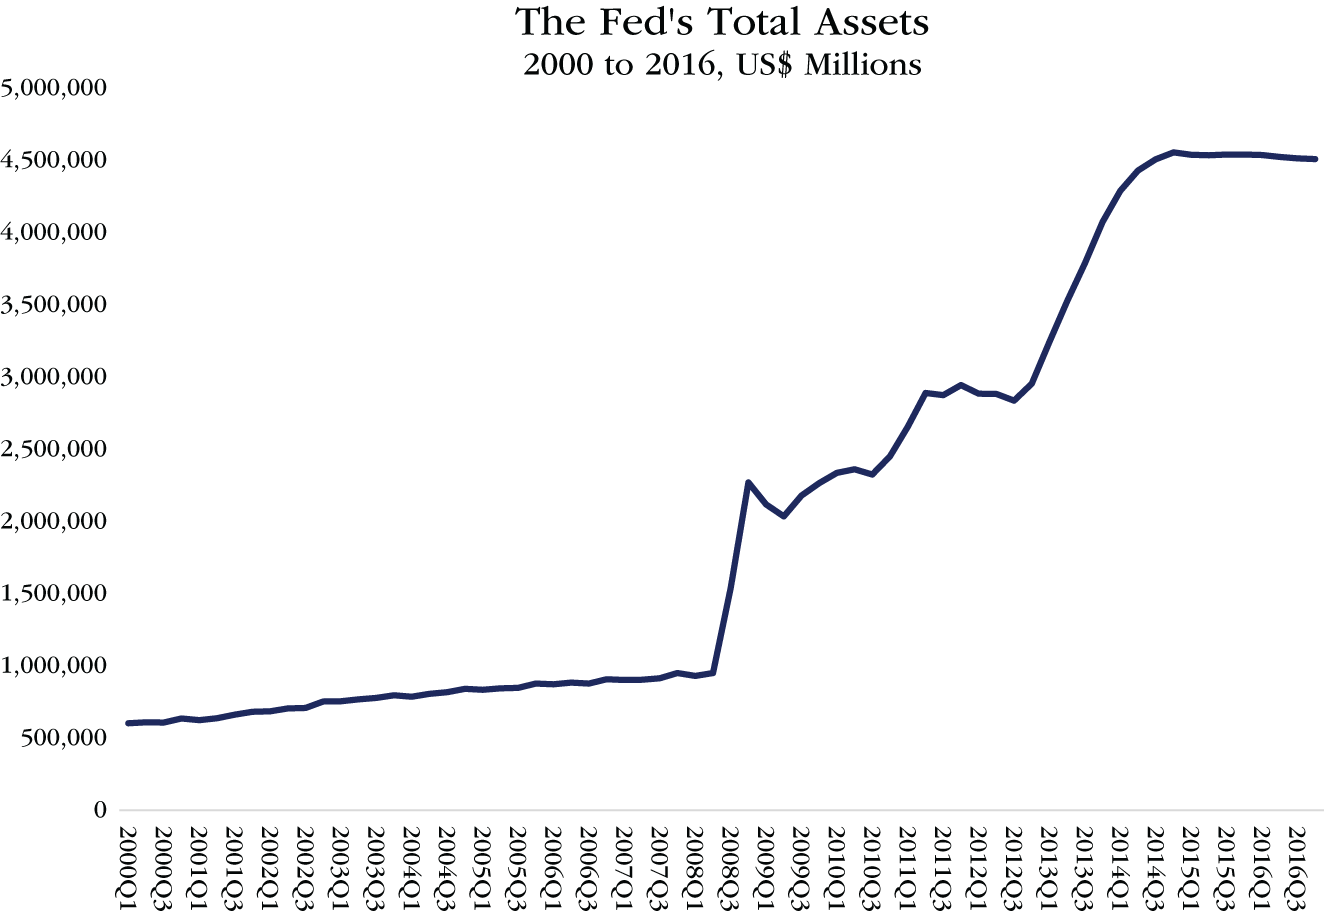
CHART 12.7 The Fed's Total Assets, 2000 to 2016
Source: Data from the Financial Accounts of the United States, Table L. 109, Monetary Authority. The Federal Reserve20
When the Fed extends a loan to a bank through a discounting operation it does so by making a deposit into that bank's reserve account at the Fed. Similarly, when the Fed buys a bond through an open market operation, it pays for that bond by making a deposit into the seller's reserve account at the Fed. The act of making the deposit creates the money that is deposited. This process was explained at length in Part One.
The evolution of Bank Reserves is shown, along with that of all the Fed's other liabilities, in Chart 12.8, which presents a breakdown of the Fed's total liabilities between 2000 and 2016.
The Fed had all but done away with the requirement that banks hold reserves against their deposits long before the crisis of 2008 struck. At the end of 2007, Bank Reserves amounted to only $21 billion. By the time QE3 ended in October 2014, reserves had grown to more than $2.5 trillion as the result of the massive extension of Federal Reserve Credit during those years.
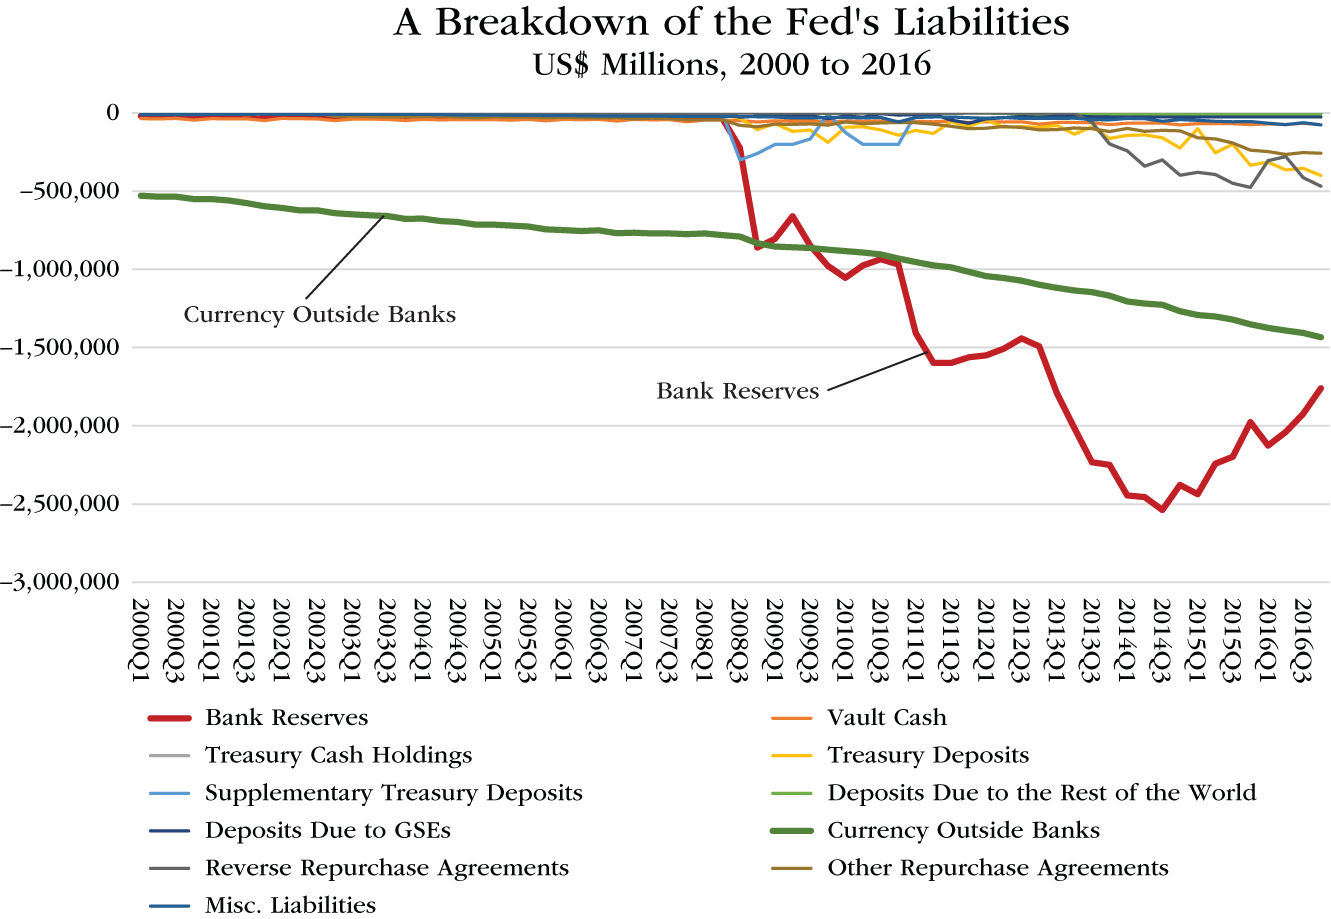
CHART 12.8 A Breakdown of the Fed's Liabilities, 2000 to 2016
Source: Data from the Financial Accounts of the United States, Table L. 109, Monetary Authority. The Federal Reserve21
Reserves expanded less than the $3.5 trillion increase in the Fed's total assets because some of the reserves the Fed created were absorbed during those seven years by the increase in currency, $450 billion; the increase in Treasury deposits at the Fed, $140 billion; an expansion of reverse repo agreements entered into by the Fed, $300 billion; and by the less sizable expansion of various other Fed liabilities.
Nonetheless, the monetary base of the United States expanded by roughly 380% during that period.
Why QE Worked
Quantitative Easing played a leading and indispensable role in reigniting economic growth in the United States after 2008. It helped drive the economic recovery in three overlapping ways.
First, it financed much of the US government's massive budget deficits, permitting government spending to stimulate the economy and generate growth. Second, it pushed up asset prices, which, initially, helped restore many financial institutions and individuals to solvency and, subsequently, created a wealth effect that fueled consumption and economic growth. Finally, QE pushed interest rates lower, making mortgages and other kinds of consumer credit more affordable for individuals and making investment more profitable for businesses.
Financing the Budget Deficit
The crisis of 2008 caused a severe deterioration in the government's finances. Tax receipts plunged from $2,568 billion in 2007 to $2,105 billion in 2009. At the same time, government expenditure jumped from $2,729 billion in 2007 to $3,518 billion in 2009. Chart 12.9 shows these changes.
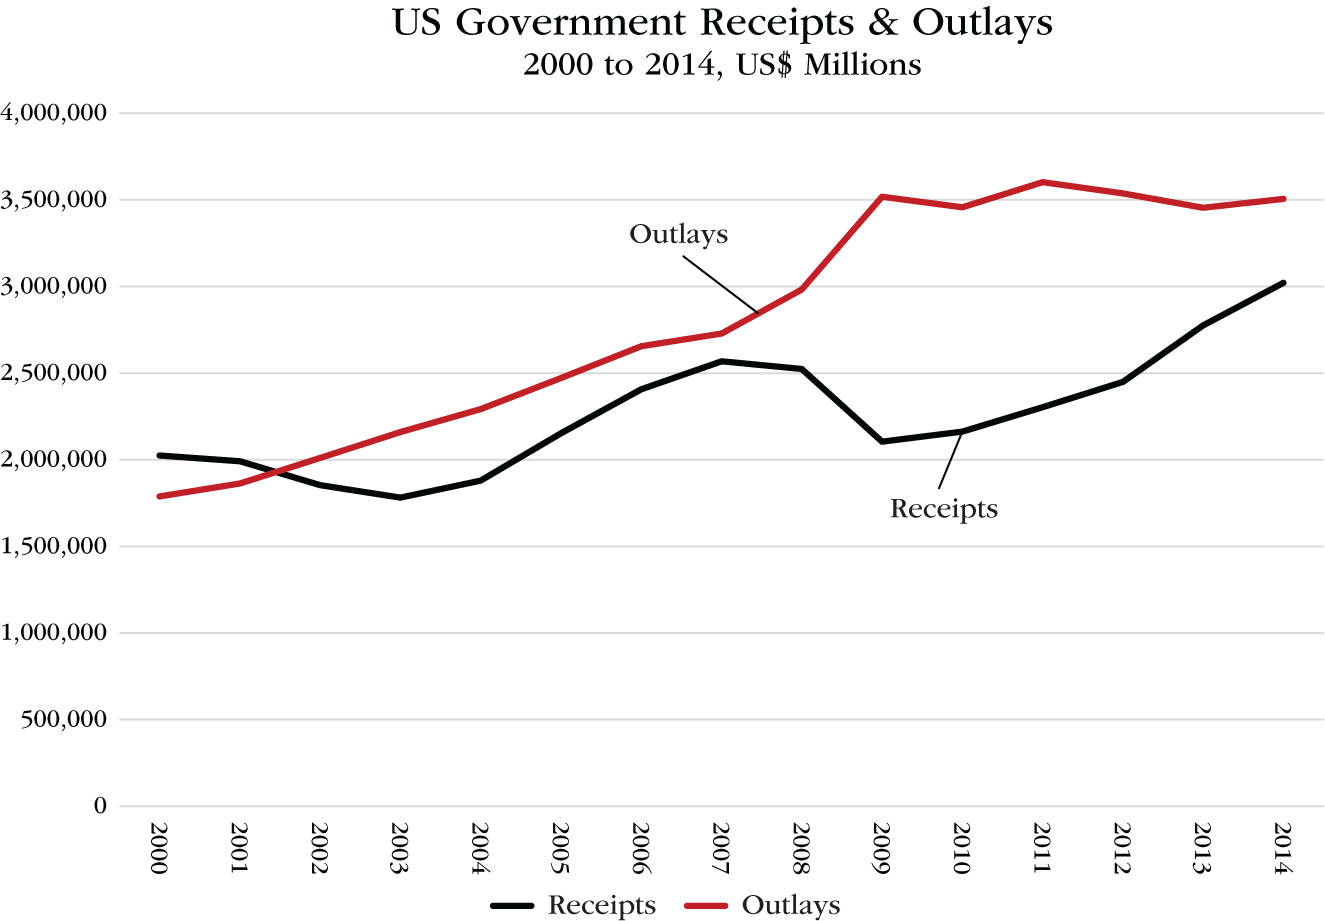
CHART 12.9 US Government Receipts and Outlays, 2000 to 2014
Source: Data from Office of Management and Budget, Historical Tables, The White House
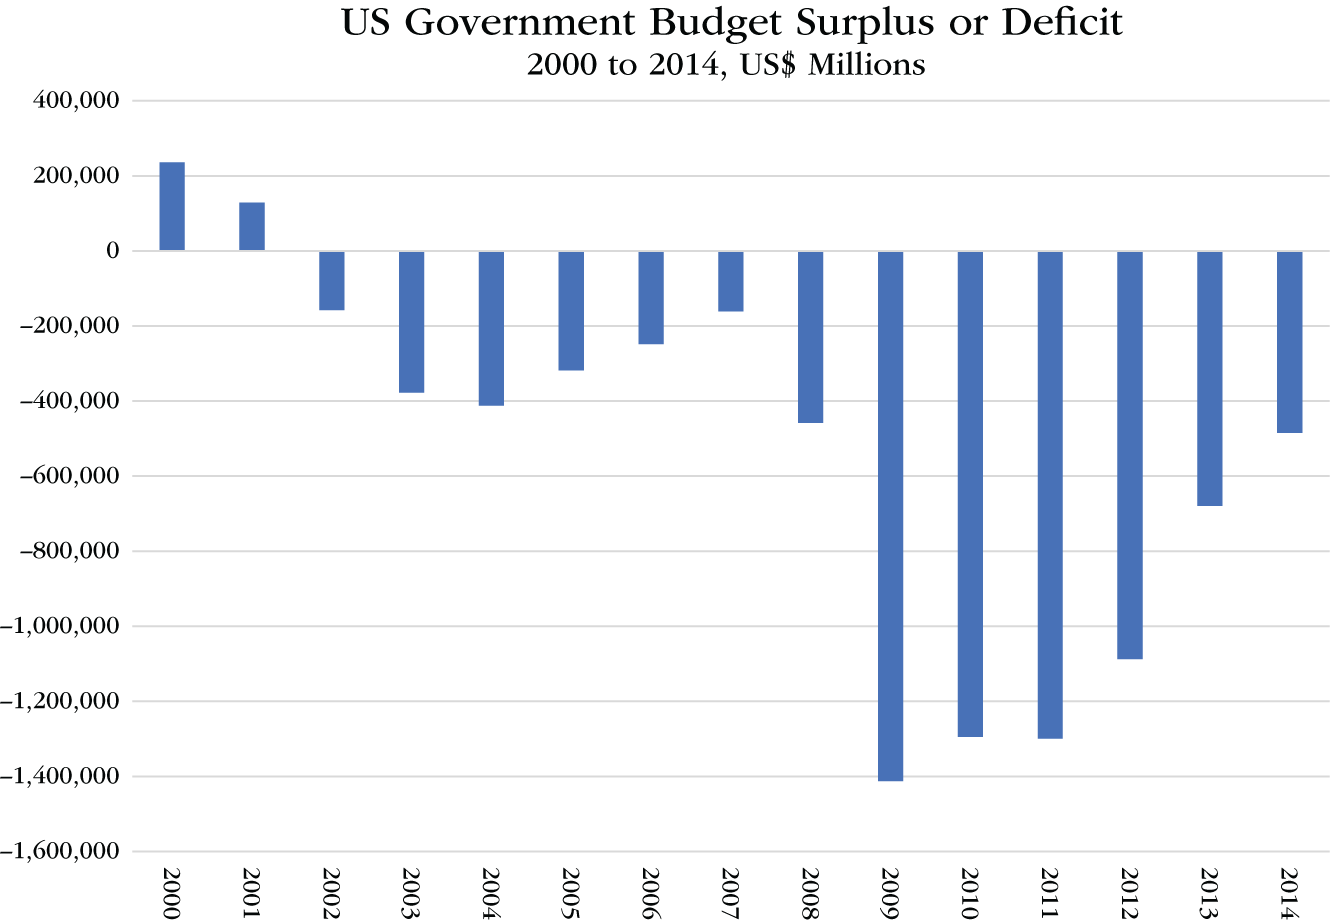
CHART 12.10 US Government Surplus or Deficit, 2000 to 2014
Source: Data from Office of Management and Budget, Historical Tables, The White House
The 18% drop in revenues combined with a 29% increase in expenditures produced the largest peacetime government budget deficits in the country's history. The budget deficit hit $1.4 trillion in 2009. It exceeded $1 trillion a year for the next three years, as well (see Chart 12.10).
The cumulative budget deficit between 2009 and 2014 amounted to nearly $6.3 trillion. Government borrowing on that scale would normally have pushed interest rates higher. Property prices had begun falling sharply from the second quarter of 2007. Higher interest rates would have driven them even lower, as well as damaging the economy in innumerable other ways. The Fed intervened to prevent interest rates from rising.
Just as in World War I and World War II, the Fed extended Federal Reserve Credit in order to finance the government's large budget deficits at low interest rates at a time of national emergency. From the start of the crisis to the time the third round of Quantitative Easing ended in October 2014, the Fed purchased an additional $1.7 trillion of Treasury securities, an amount equivalent to 27% of the cumulative budget deficits between 2009 and 2014 (see Chart 12.11). If the Fed had not bought those bonds, the private sector would have had to. The issuance of so much new government debt to the private sector would have driven interest rates significantly higher.
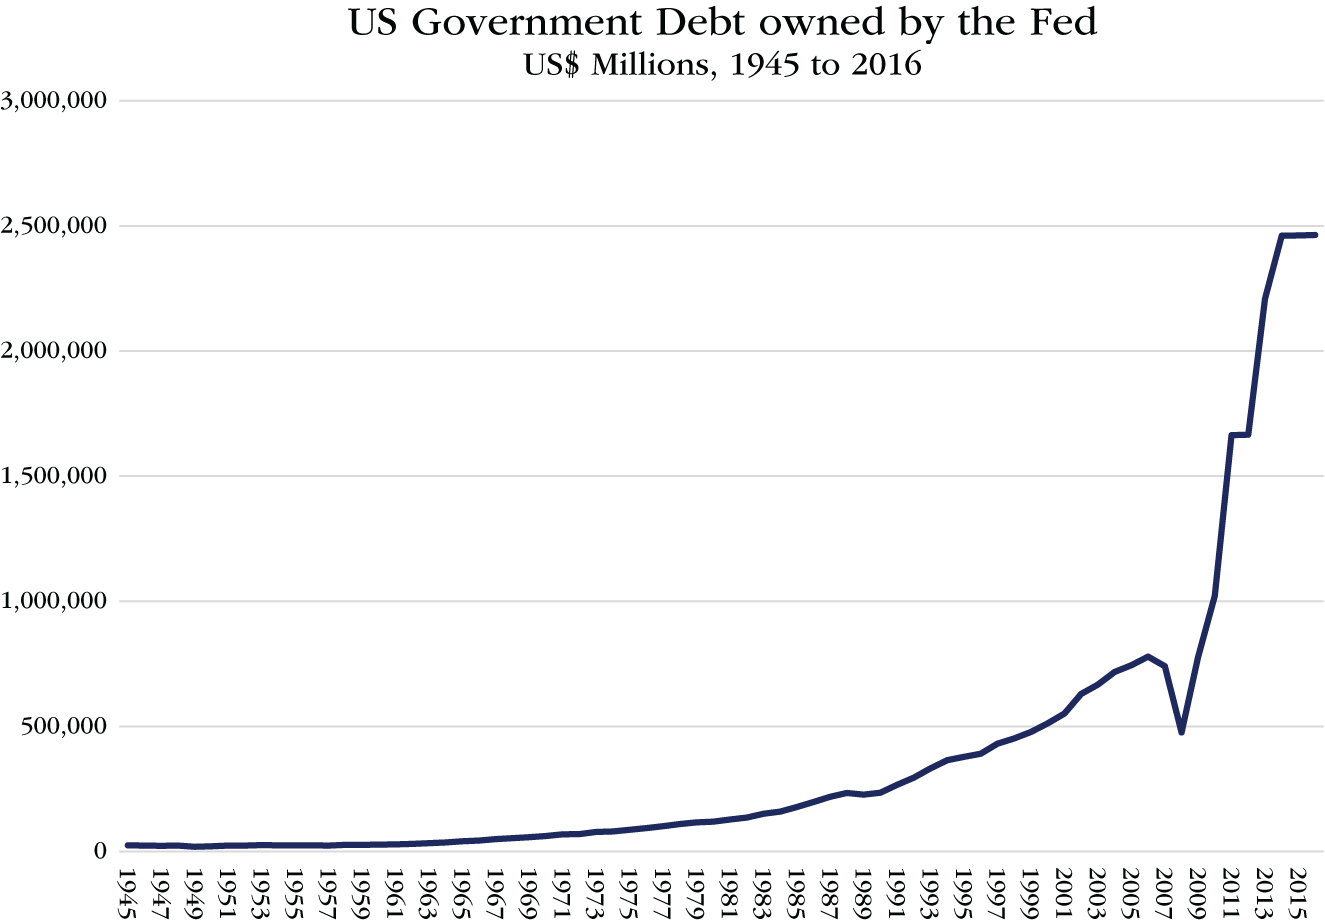
CHART 12.11 US Government Debt Owned by the Fed, 1945 to 2016
Source: Data from the Financial Accounts of the United States, Table L. 109, Monetary Authority. The Federal Reserve22
In addition, the Fed also purchased $1.7 trillion of debt issued or guaranteed by the GSEs. That also helped finance the government's large deficits. When the Fed acquired the GSE-related debt, whomever it acquired that debt from had money to invest elsewhere. Much of that money moved straight into Treasury securities. Money is fungible. That means when the central bank creates money and injects it into the financial system, it increases the supply of money in the system and affects the prices of all asset classes. By acquiring GSE-related debt, the Fed made another $1.7 trillion available to purchase Treasury securities and other assets. That was another important Fed policy measure that helped to hold interest rates down despite the government's heavy borrowing.
In other words, by creating $3.4 trillion during three rounds of QE, the Fed, in effect, financed 54% of the government's budget deficits between 2009 and 2014.
During the crisis, the government increased its spending sharply even though its tax receipts plunged. That government spending directly boosted economic growth at a time when the private sector, both households and businesses, spent much less. Had the government not increased its spending, the economic crisis would have been much deeper and more protracted. Far worse still, had the government attempted to balance its budget by cutting its spending as its tax receipts shrank, the United States economy would, without question, have collapsed into a new Great Depression.
Without the assistance of the Fed, government borrowing of $6.3 trillion over only six years would have pushed interest rates up. The damage caused by the higher interest rates would have offset, to some extent, and perhaps even outweighed, the benefits of the increased government spending. Quantitative Easing, however, held interest rates down and allowed the full benefits of the government stimulus to work its way all through the economy. This combination of very aggressive fiscal policy and very aggressive monetary policy was extraordinarily effective in pulling the economy out of its nosedive and restoring economic growth.
Pushing Up Asset Prices
Next, Quantitative Easing pushed up asset prices, creating a wealth effect that boosted consumption and fueled economic recovery. That process worked in two ways. First, QE pushed down the interest rates available on bonds and bank accounts. Investors, discouraged by low interest rates on debt instruments, moved their money out of bonds and bank accounts and invested it, instead, in the stock market and the property market. That pushed stock prices and property prices higher.
Second, QE also pushed asset prices higher through a process the Fed calls the “portfolio effect.” As the Fed acquired $3.4 trillion of Treasury securities and GSE-related debt, the previous owners of those debt instruments were forced to invest their money somewhere else. Many chose to invest it in stocks and property, which inflated values in those markets.
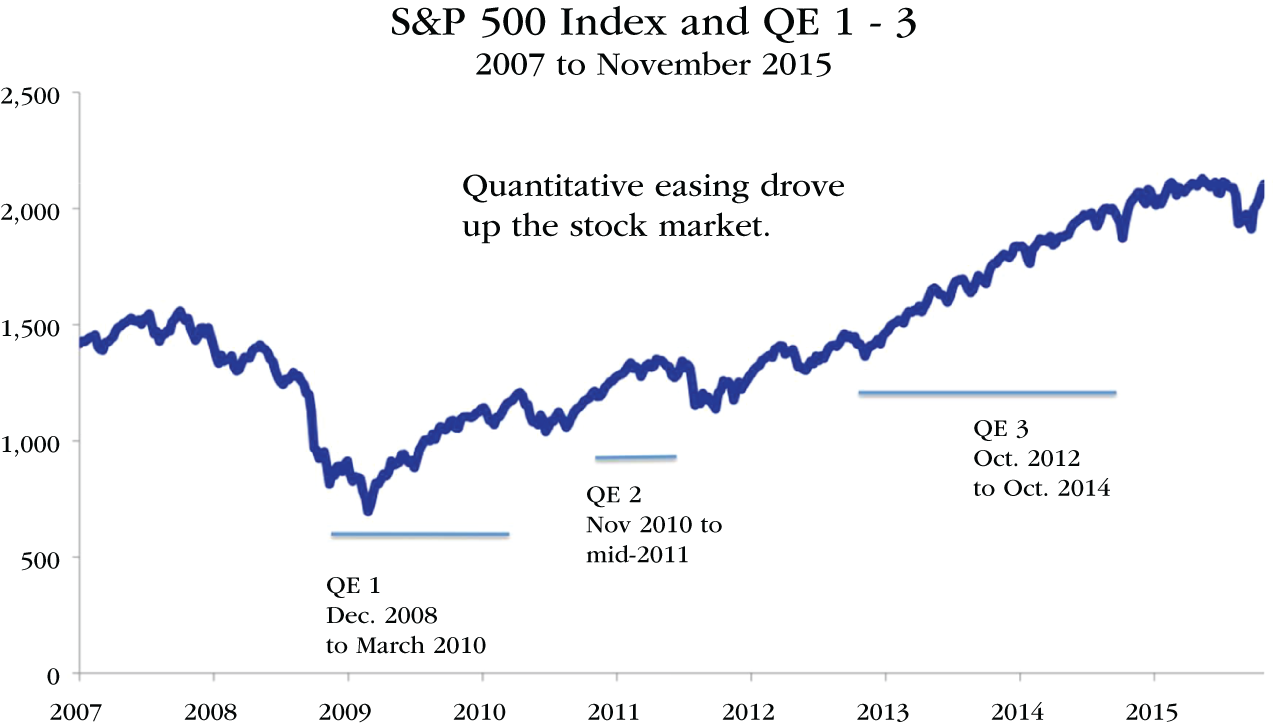
CHART 12.12 QE & the S&P
Source: Federal Reserve Bank of St Louis
Chart 12.12 shows how the S&P 500 Index responded to Quantitative Easing.
Stock prices went higher with every round of Quantitative Easing. Before the first round of QE began, stock prices were in freefall. They rebounded soon after QE began. When QE1 ended, so did the stock market rally. The rally resumed when QE2 was launched, and it ended again in mid-2010 when QE2 was terminated. The third round of Quantitative Easing, which was large and initially open-ended, had the same effect. It drove the stock market higher. During QE1, the S&P 500 Index rose 29%; during QE2, it rose 26%; and during QE3, it rose 40% more.
Property prices also benefited from low interest rates and QE's portfolio effect. Chart 12.13 shows that home prices plunged dramatically from the second quarter of 2007 until mid-2009. They then bounced, but fell again, setting a post-crisis low in March 2012. From there they began to rebound quickly. By the end of 2014, they had recovered more than half their losses.
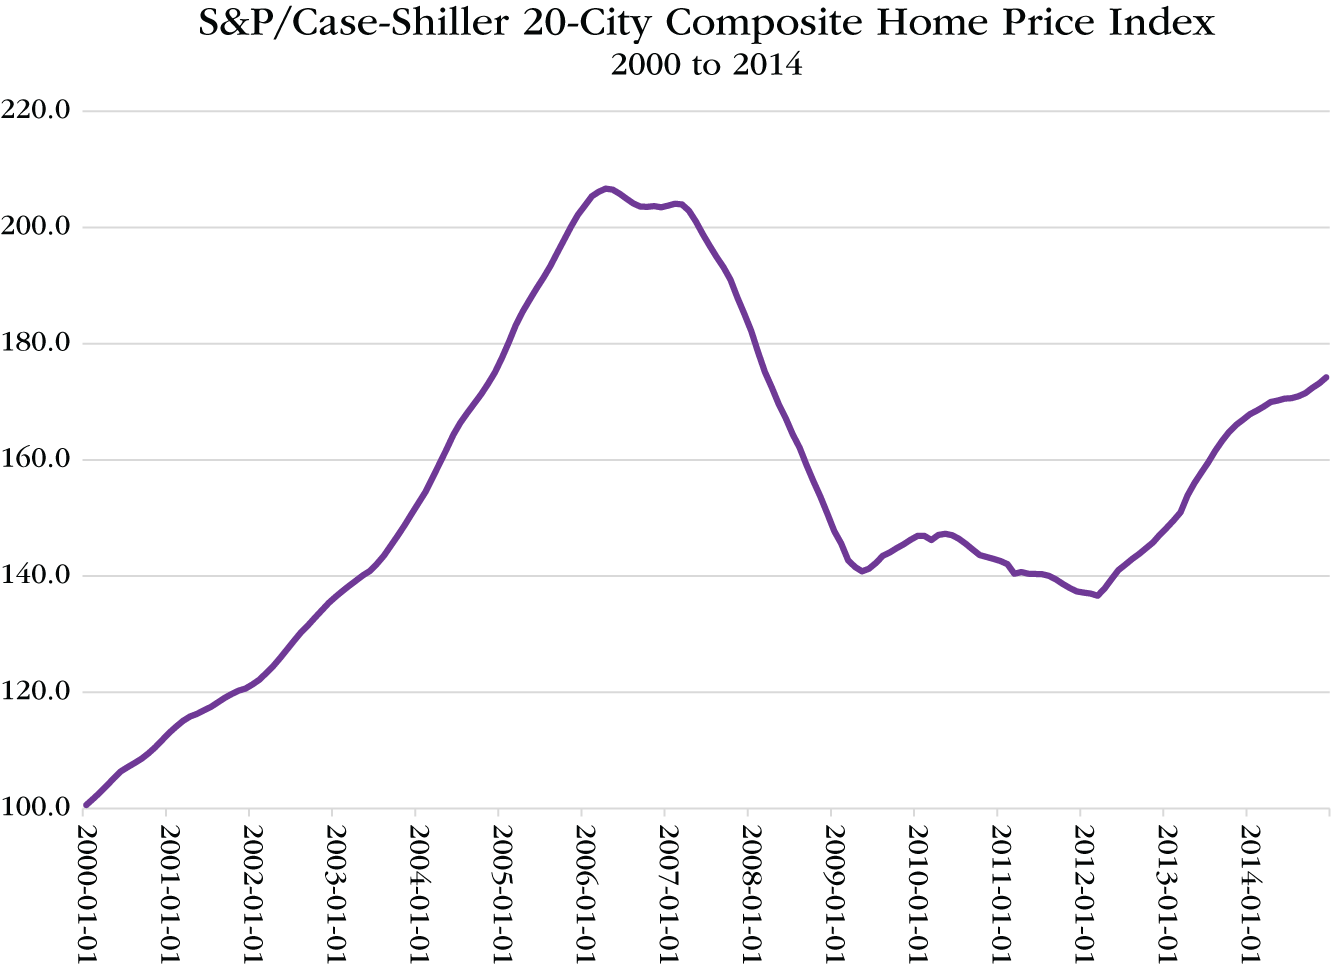
CHART 12.13 S&P/Case Shiller 20 City Composite Home Price Index, 2000 to 2014
Source: Data from the S&P Case-Shiller 20-City Composit Home Price Index
Rising stock prices and property prices made anyone with a home, a stock portfolio, or a pension richer. Chart 12.14 shows US household net worth, which is calculated by deducting all the liabilities from all the assets of the household sector. Thanks to Quantitative Easing and low interest rates, by the end of 2014, household net worth was $30 trillion or 54% higher than at the depth of the crisis in 2009. In fact, and rather astonishingly, it was $16 trillion or 24% higher than its pre-crisis peak in 2007, when the stock market and the property market were both bubbles.
Rising asset prices created wealth and allowed many millions of Americans to spend more, thereby boosting consumption and economic growth. At the same time, higher asset prices returned many banks, businesses, and individuals to solvency by pushing the value of their assets back above the level of their debt. In this way, QE helped bring the crisis in the financial sector to an end, while at the same time strengthening the economy's fundamentals by boosting purchasing power.
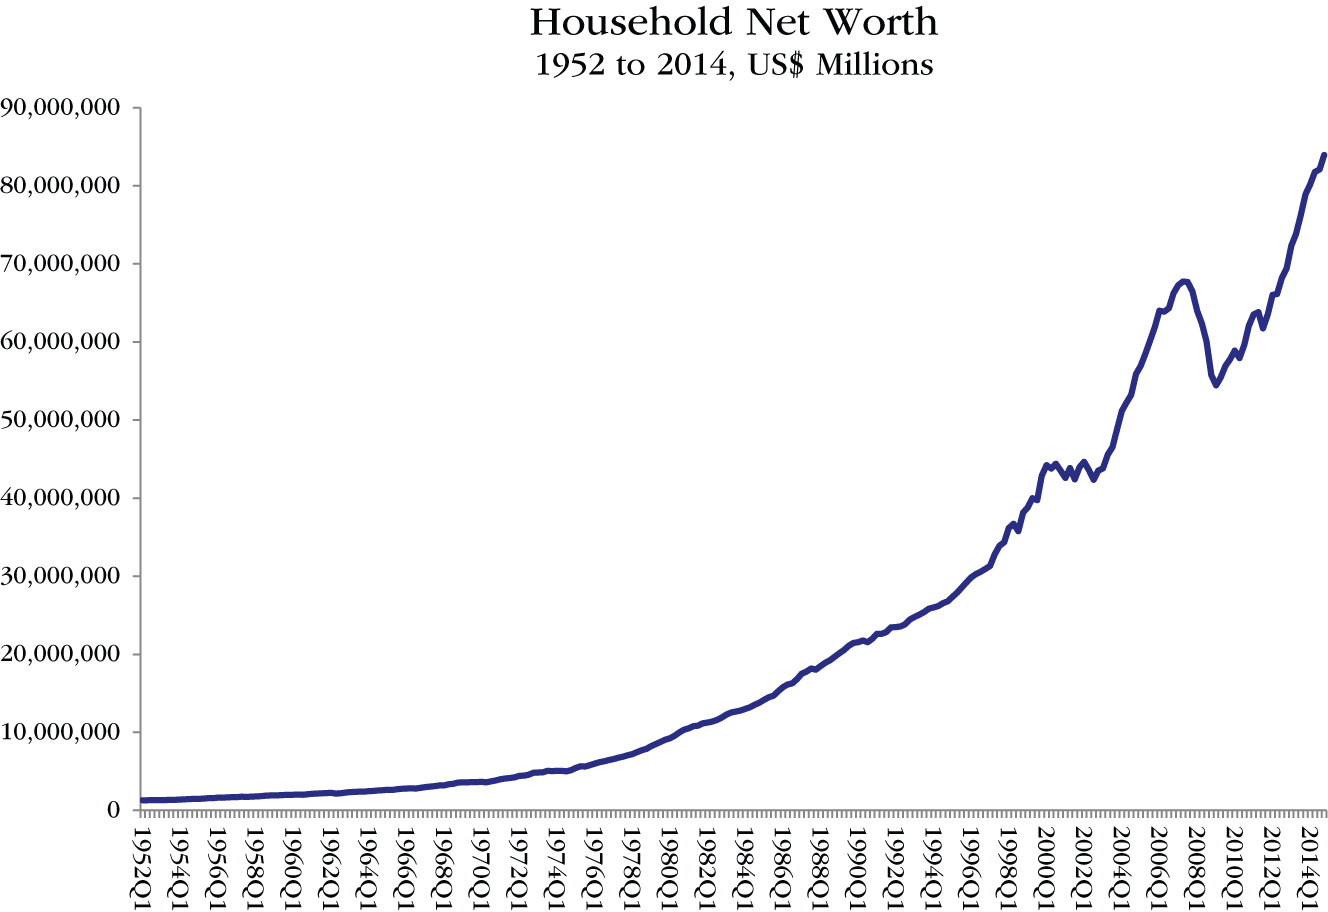
CHART 12.14 Household Net Worth, 1952 to 2014
Source: Data from the Financial Accounts of the United States. Table B.101. The Federal Reserve
Pushing Down Interest Rates
Finally, Quantitative Easing helped revitalize the economy by making borrowing more affordable. QE pushed interest rates down and held them down. The yield on 10-year Treasury securities fell from 4.0% at the end of 2007 to 2.2% at the end of 2014. Over the same period, interest rates on 30-year fixed mortgages and on new auto loans fell from 6.2% to 3.9% and from 7.6% to 4.1%, respectively. Low mortgage rates and cheap auto financing boosted home sales and car sales. Similarly, corporate financing costs, which move in line with, although at a spread above, 10-year Treasury yields, fell and encouraged new business investment by making those investments more profitable.
The Fed, therefore, deserves great praise for the way it responded to the crisis. During the second half of 2008, through its discounting operations, the Fed flooded the capital markets with liquidity until calm was restored and financing once again became plentiful. Then, beginning in December 2008, the Fed, using open market operations, started to reflate the economy by acquiring trillions of dollars of debt instruments by extending Federal Reserve Credit. The Fed's discounting operations ended the financial crisis. Its open market operations played a vital role in ending the economic crisis.
Bank Reserves Are Just a Byproduct of QE
Many people mistakenly believe that Quantitative Easing has no effect on the economy. They point to the buildup in Bank Reserves that occurs when the Fed carries out Quantitative Easing and they argue that QE is ineffective because all the money the Fed creates simply gets stuck in the banks as reserves and, therefore, does not provide any stimulus to the economy. This idea is mistaken, however. It grows out of a misunderstanding of what Bank Reserves actually are. Here a short explanation of what reserves are will help dispel this misunderstanding.
When the Fed buys government bonds, it enables the government to spend that amount of money providing direct support to the economy, as described in the paragraphs above.
The Fed does not buy the bonds directly from the government, however. It buys them from banks. The banks are simply the middlemen. Once the banks have sold the bonds to the Fed, they typically use the proceeds they receive from the Fed to buy more government bonds.
When the Fed buys government bonds from the banks, it pays for those bonds by making deposits into the reserve accounts that those banks hold at the Fed.
In this process, the Fed is not depositing money that already exists. The act of making the deposit creates the money, as explained in Chapter 1.
Of course, the Fed does not really deposit anything physical into the banks' reserve accounts. It just digitally credits those accounts. To help clarify what Bank Reserves really are, imagine that instead of paying for those bonds by digitally crediting the banks' reserve accounts, picture that the Fed pays for the bonds with pennies. Yes, imagine that when the Fed carries out QE that it hands the banks trillions of dollars' worth of pennies – a mountain of pennies – in exchange for those bonds.
The banks are free to spend those pennies on anything they like. For example, they can lend them or invest them. But lending or investing the pennies would not make the mountain of pennies any smaller. Some other bank would end up with the pennies. The pennies will never go away no matter how much the banks lend or invest.
The pennies would go away, however, if the Fed were to sell the bonds it bought from the banks, back to the banks. In this case, when the Fed sells the bonds to the banks, the banks would pay for those bonds by giving the Fed back its pennies. Then there would be fewer pennies in the banking system. When the Fed gets its pennies back, it destroys them. But it is free to create them again any time it wants.
It is the same with Bank Reserves. When the Fed buys bonds from the banks, it pays by making deposits into the reserve accounts that the banks hold at the Fed, thereby creating Bank Reserves. Those reserves are money and the banks can do anything they want with them. They can lend them or invest them, but, when they do, some other bank ends up with the reserves. Lending reserves doesn't reduce the number of reserves, it just sends the reserves to some other bank. That is because when a bank makes a loan, whoever receives the loan then deposits that money into their bank, so the reserves move to their bank. An increase in the level of Bank Reserves simply reflects the increase of liquidity in the financial system. When liquidity increases, financial conditions loosen, interest rates tend to fall, and asset prices tend to rise.
If the Fed were to sells the bonds it bought from the banks back to the banks, then the reserves would disappear. This is what occurs when the Fed conducts open market sales. When the Fed sells bonds back to the banks, in exchange, it debits the reserve accounts that those banks hold at the Fed.
When it debits those reserve accounts, that makes the reserves disappear.
The Fed does not have its own bank account in which it keeps trillions of dollars of reserves. Why would it? The Fed can create reserves any time it wants.
So, the buildup of Bank Reserves in the accounts that the banks hold at the Fed, is simply just a by-product that occurs when the Fed buys government bonds, just as the mountain of pennies would be, if the Fed paid for the bonds it bought with pennies.
Hopefully, this explanation clears up the misunderstanding about Bank Reserves once and for all, because Quantitative Easing is the country's most powerful economic policy tool. It is important to understand that QE works. It is not possible to understand the government's policy response to economic crises in the twenty-first century without understanding that QE does effectively stimulate economic growth.
The Fed Was Helped by Other Central Banks
The Fed was not the only central bank acting to reflate the US economy, however. Other central banks also pumped liquidity into the US economy by creating money and buying US dollar-denominated debt. Chart 12.15 shows total foreign exchange reserves from 1970 to 2014.
A central bank obtains foreign exchange reserves by creating its own currency and using it to buy the currencies of other countries. Total foreign exchange reserves increased by $5.7 trillion between 2007 and 2014, from $6.1 trillion to $11.6 trillion.
If it is assumed that 70% of all foreign exchange reserves are made up of US dollars,23 that means that the dollar holdings of central banks outside the United States increased by $4 trillion ($5.7 trillion multiplied by 70%) between 2007 and 2014. As those dollars were acquired, they were invested in US dollar-denominated assets. Central banks are risk adverse and invest most of their foreign exchange holdings in government bonds. Chart 12.16 shows that between 2007 and 2014, the rest of the world's holdings of US Treasury securities increased by $3.8 trillion to $6.2 trillion. It is very likely that central banks were the buyers of a great majority of those Treasury securities.
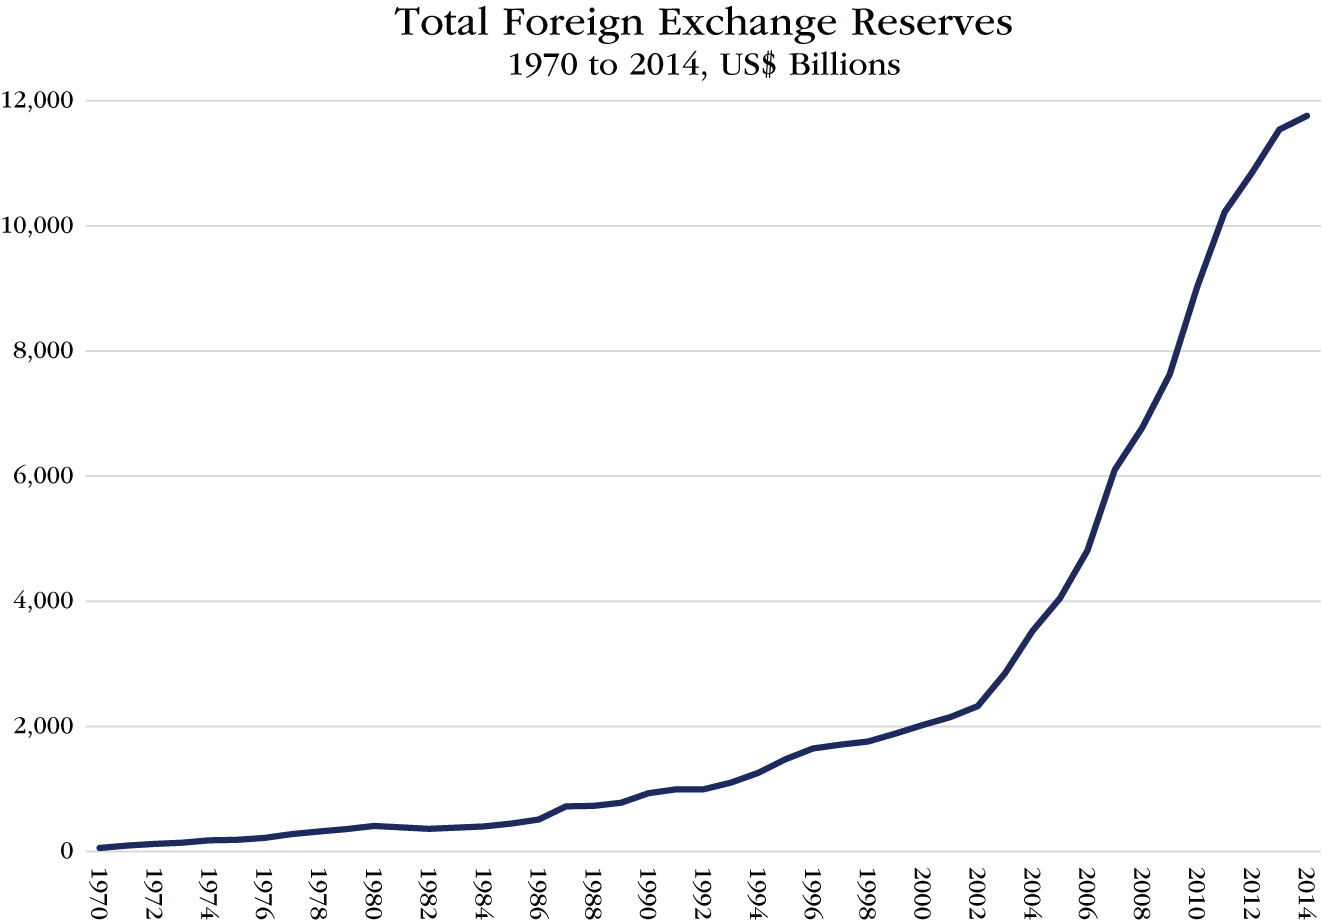
CHART 12.15 Total Foreign Exchange Reserves, 1970 to 2014
Source: The International Monetary Fund
Even if those foreign central banks used their newly acquired dollars to invest in US dollar-denominated assets other than Treasury securities, their investments would still have pushed money into Treasury securities. For example, if the People's Bank of China bought $50 billion of GSE-related debt or of US corporate bonds, whomever it bought those bonds from would have had $50 billion of cash to invest and, sooner or later, much, if not all, of that money would have ended up in US Treasury securities. This is in part because there is only a limited amount of investable securities of all types at any one time and also, in part, because the investment in GSE-related debt would have pushed down the yield on all GSE-related debt, making the yield on US Treasury securities relatively more attractive on a risk-adjusted basis.
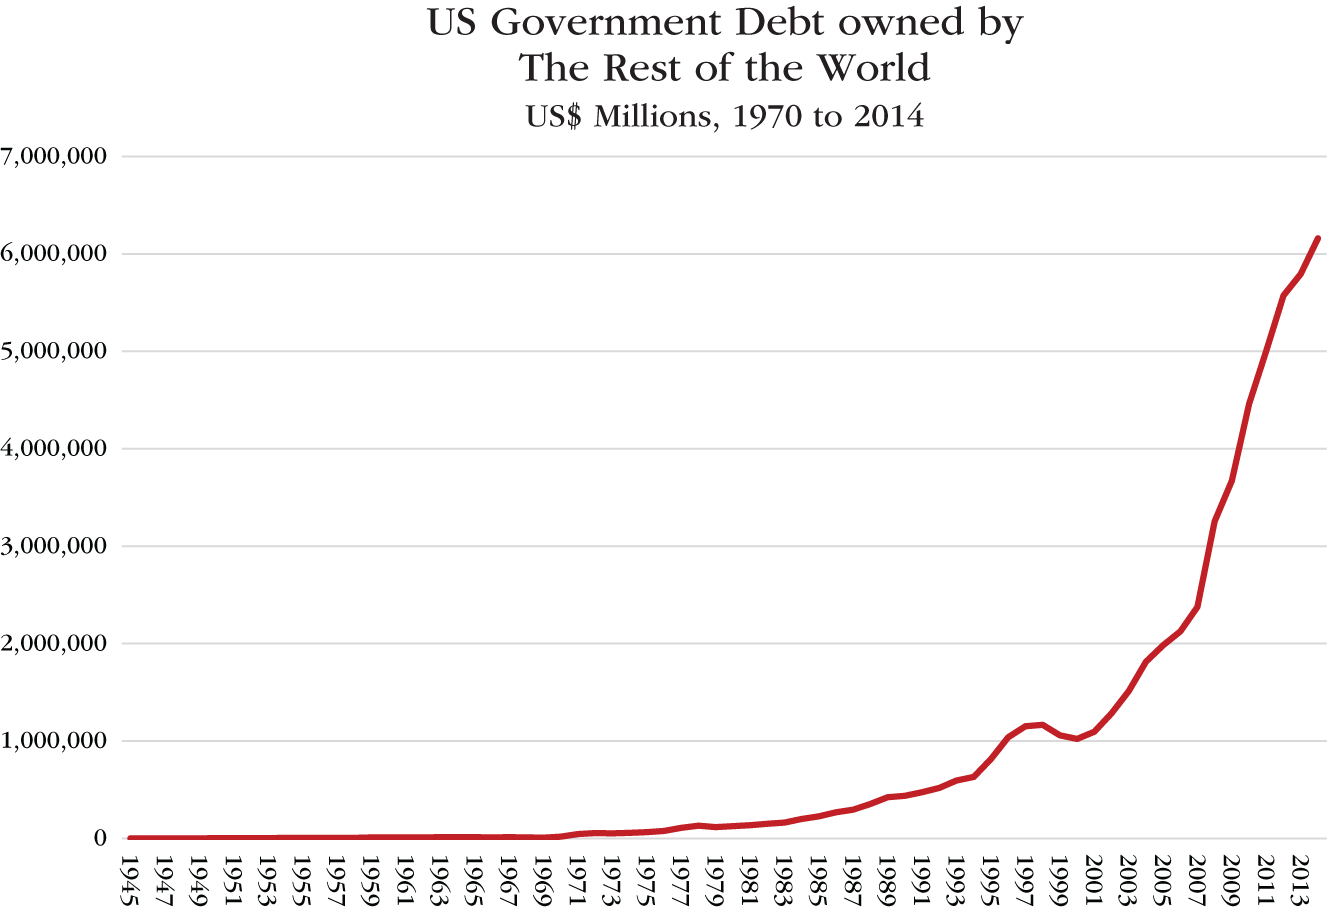
CHART 12.16 US Government Debt Owned by the Rest of the World, 1970 to 2014
Source: Data from the Financial Accounts of the United States. Table L.133. The Federal Reserve
In short, then, the Fed was not alone in monetizing US government debt. In fact, central banks outside the United States monetized more US government debt than the Fed did between 2007 and 2014. The rest of the world's holdings of US Treasury securities increased by $3.8 trillion during those years, whereas the Fed's holdings of US Treasury securities increased by “only” $1.7 trillion. By the end of 2014, as shown in Chart 12.17, out of the $19 trillion of US government debt outstanding at the end of 2014, the rest of the world owned $6.2 trillion, whereas the Fed owned just $2.4 trillion.
The monetization of US government debt by foreign central banks has not been recognized by the economics profession; and, if it has been understood by those behind the “smart money” in the financial markets, they have kept that information to themselves. The sooner this fact is commonly understood, the better. Total foreign exchange reserves peaked at more than $12 trillion during 2014, rising from less than $2 trillion at the turn of the century. That means that the central banks of the trade surplus countries created the equivalent of $10 trillion in just 14 years. It is likely that approximately 70% of that amount, or $7 trillion, ended up being invested in US dollar-denominated assets, primarily Treasury bonds. That dwarfs the $3.6 trillion the Fed created during the first three rounds of Quantitative Easing. That new central bank money profoundly impacted US interest rates and, consequently, the rate of economic growth in the United States and all around the world. Its extraordinary impact further exemplifies the significance of the Money Revolution that occurred once money ceased to be backed by gold five decades ago.

CHART 12.17 US Government Debt Owned by the Fed and the Rest of the World, 1970 to 2014
Source: Data from the Financial Accounts of the United States. Tables L.109 and L.113. The Federal Reserve
Four Charts
Part One traced the evolution of the Fed's balance sheet over six consecutive periods, covering 1914 to 2007. For each period, four charts were used to illustrate changes in the Fed's balance sheet in order to explain Fed policy:
Those charts will now be presented and discussed here for the period 2007 to 2016.
The Fed's total assets increased from $950 billion at the end of 2007 to $4,555 billion at the end of 2014, an increase of 379% over seven years. The third round of Quantitative Easing, which, at its peak, reached $85 billion per month, ended in October 2014. Between 2014 and 2016, the Fed's total assets remained relatively unchanged, ending the period at $4,510 billion. This crisis-driven surge in the Fed's total assets is shown in Chart 12.18.
The evolution of the Fed's major assets and liabilities between 1945 to 2016 is presented in Chart 12.19. Since the preceding paragraphs have discussed the major developments on both the assets side and the liabilities side of the Fed's balance sheet in considerable detail, no further comments will be added here.
The Fed is one of the world's most powerful (and profitable) institutions due to its ability to create credit: Federal Reserve Credit. The Federal Reserve Act of 1913 had envisioned that the Fed would only extend relatively limited amounts of short-term credit to prevent banking crises; and that such credit as the Fed did create would be retired once the panics had passed. As we have seen, that is not how things worked out.
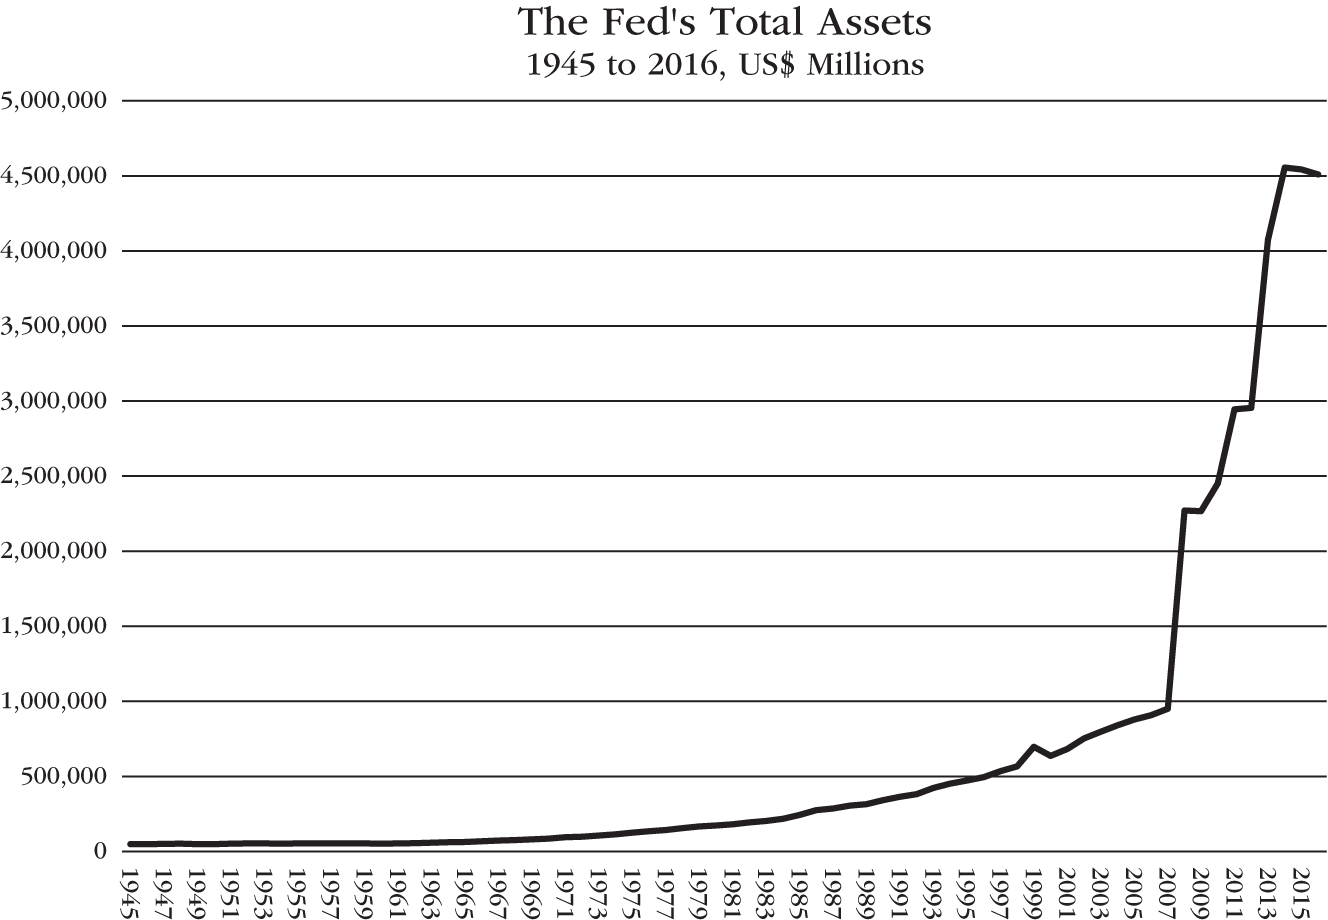
CHART 12.18 The Fed's Total Assets, 1945 to 2016
Source: Data from the Financial Accounts of the United States, Table L. 109, Monetary Authority. The Federal Reserve24
The Fed created $1.4 billion of Federal Reserve Credit in 1918 at the peak of the United States involvement in World War I. Not until World War II did the Fed create so much credit in one year again. The largest annual increase of Federal Reserve Credit during World War II was $7.5 billion in 1944. That peak in credit creation by the Fed was not exceeded until 1971, when the Fed extended $8.6 billion of Federal Reserve Credit.
New record highs were set frequently after 1971, but milestones included 1986, when Federal Reserve Credit expanded by $31 billion, and 1993, when it expanded by $41 billion. The largest amount of Federal Reserve Credit extended in any one year before the crisis of 2008 occurred in 1999, when the Fed flooded the financial markets with liquidity over concerns related to Y2K. It grew by $133 billion that year, but $61 billion of that credit was extinguished the following year. Other than the Y2K-affected year of 1999, the pre-crisis, all-time record expansion of Federal Reserve Credit was $69 billion in 2002.
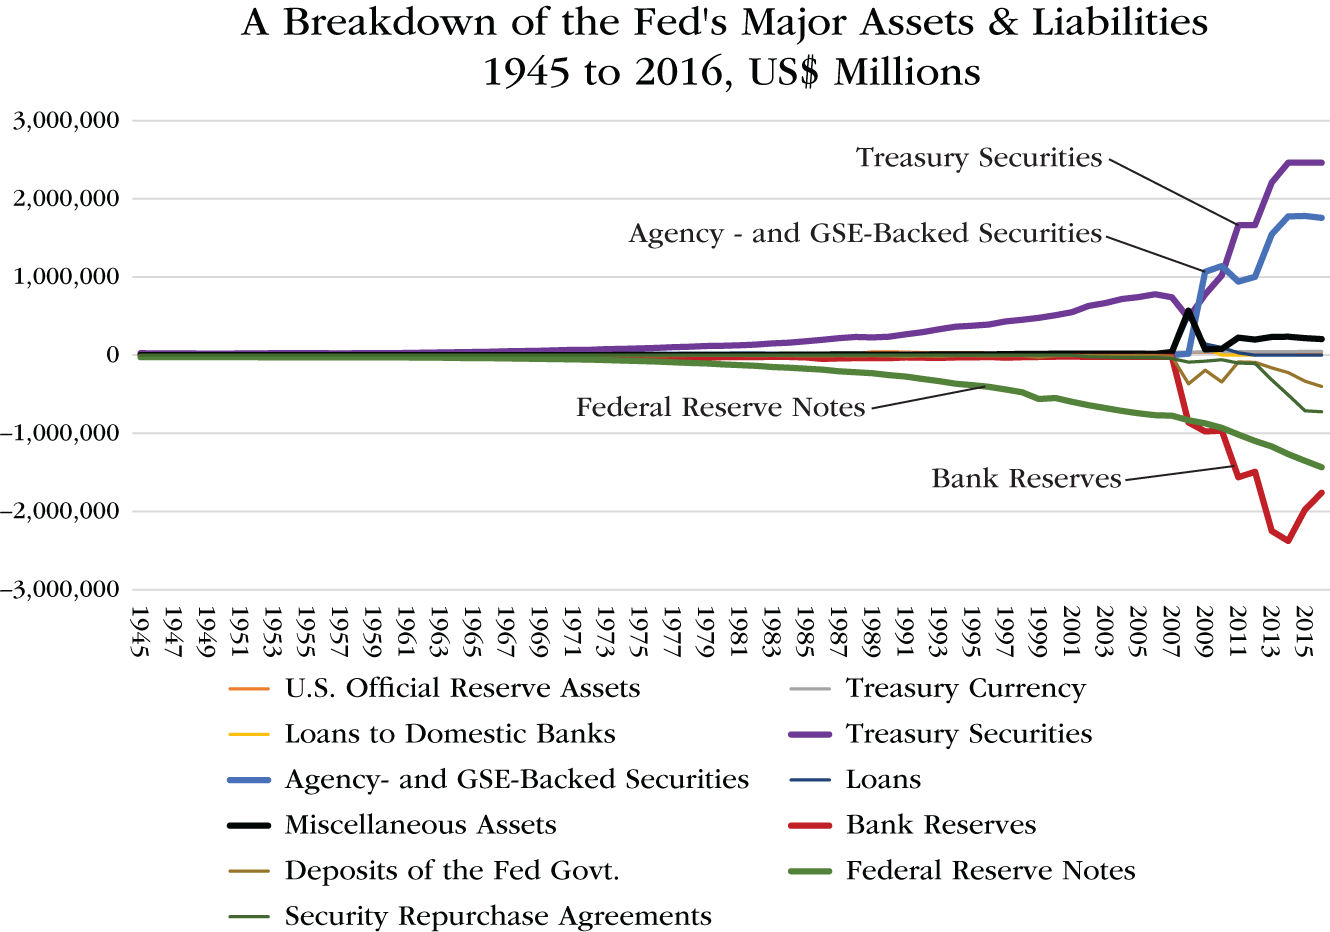
CHART 12.19 A Breakdown of the Fed's Major Assets and Liabilities, 1945 to 2016
Source: Data from the Financial Accounts of the United States, Table L. 109, Monetary Authority. The Federal Reserve25
The Fed extended $1,322 billion of Federal Reserve Credit during 2008. That was 10 times the previous record of $133 billion set in 1999. The 2008 record held until the COVID-19 depression in 2020. Nonetheless, the Fed created extraordinarily large amounts of credit during four out of the six years following 2008. Federal Reserve Credit expanded by $192 billion in 2010, $493 billion in 2011, $1,105 billion in 2013, and $475 billion in 2014. Chart 12.20 illustrates these unprecedented developments.
Chart 12.21 shows total Federal Reserve Credit and the assets the Fed accumulated as a result of extending that credit. That chart shows that total Federal Reserve Credit expanded by $3,448 billion (437%) between 2007 and 2014, before contracting slightly, by $16 billion, over the next two years.
In that chart, Treasury securities and GSE-backed mortgage securities are grouped together as government securities, since GSE debt became government debt, at least effectively, if not officially, after Fannie and Freddie were nationalized in 2008.
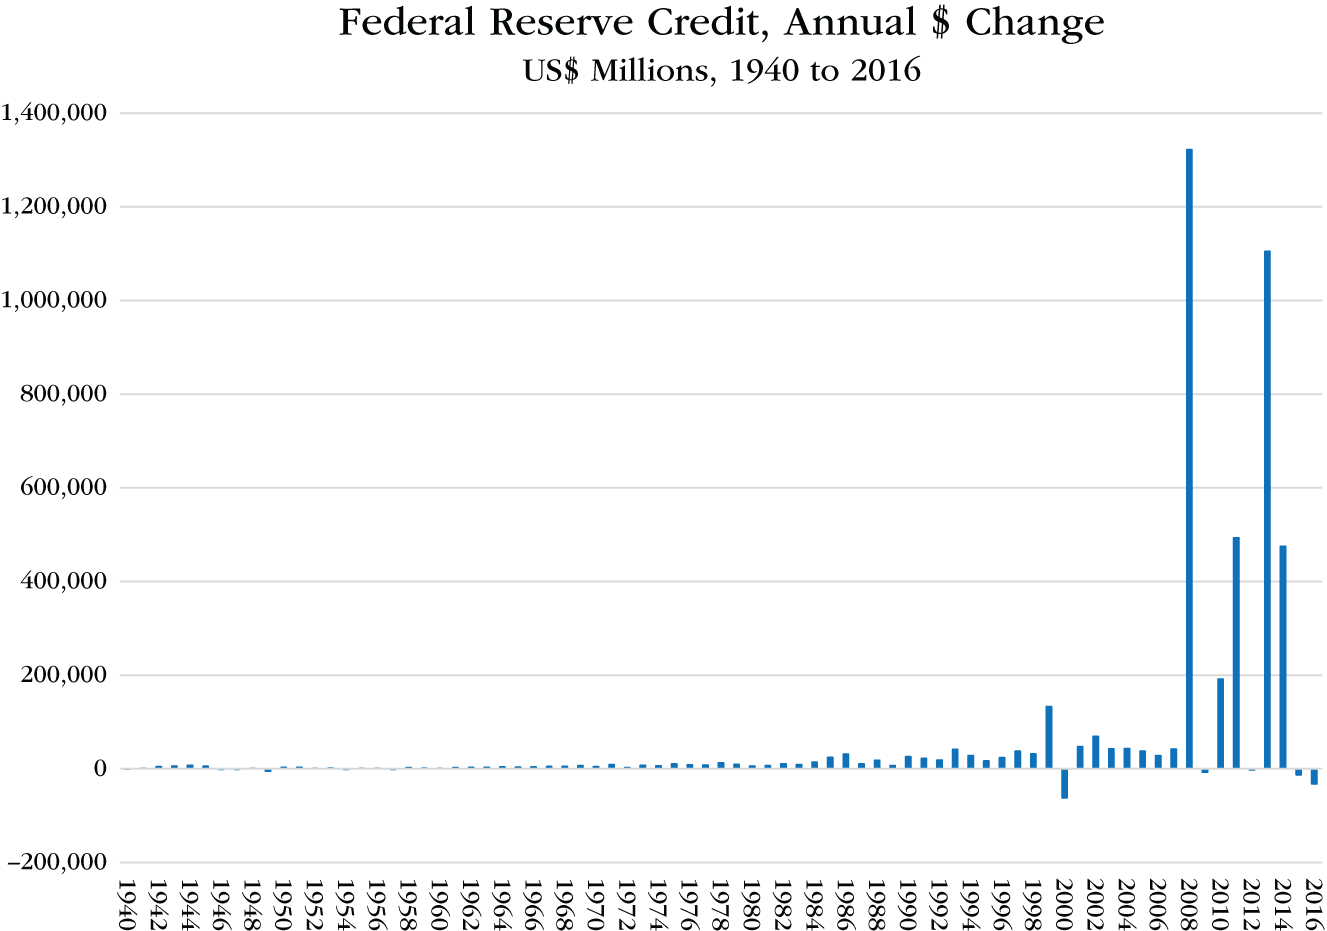
CHART 12.20 Federal Reserve Credit, Annual $ Change, 1940 to 2016
Source: Data from the Federal Reserve’s Annual Report for 2017, Tables 6.A and 6.B
The lines depicting total Federal Reserve Credit and government securities appear indistinguishable in this chart every year except for those years between 2007 and 2011, when the assets the Fed accumulated as collateral through its discounting operations are also visible. Otherwise, at least as far as can be distinguished in this chart, all the Federal Reserve Credit that the Fed created was used to acquire, and thereby to help finance, government debt. It should be noted, however, that up until the early 1930s, the assets the Fed accumulated as collateral by extending Federal Reserve Credit through discounting operations exceeded the government securities it acquired through extending Federal Reserve Credit through open market operations. That cannot be seen in this chart. It is shown and discussed in Chapters 2 to 4, however.
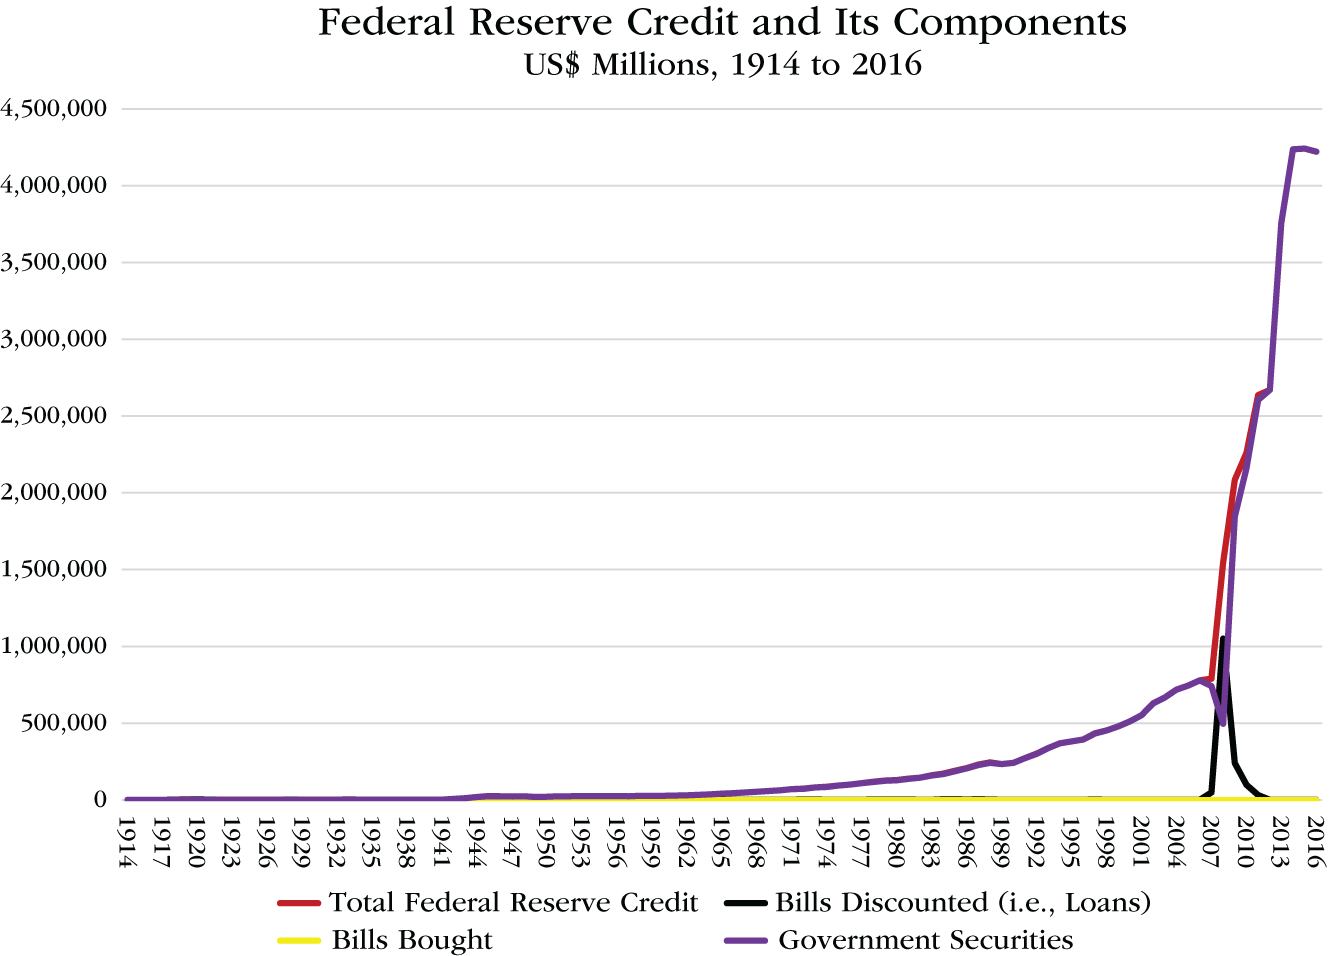
CHART 12.21 Federal Reserve Credit and Its Components, 1914 to 2016
Source: Data from “The Federal Reserve System’s Weekly Balance Sheet Since 1914” and accompanying spreadsheet. Johns Hopkins University, SAE/No.115/July 2018. See Bibliography.26
Conclusion
In 2008, the United States was struck by the most severe financial and economic crisis since the Great Depression. The Fed's discounting operations prevented the collapse of the financial system. Its open market operations played a leading and indispensable part in restoring economic growth.
In the process, the Fed extended $3.4 trillion of Federal Reserve Credit between the end of 2007 and the end of 2014. Consequently, the monetary base of the United States leapt by 370% in only seven years.27 Conventional wisdom suggests that such an extraordinary surge in the money supply over such a short period of time should have resulted in very high rates of inflation. It did not.
Chapter 15 analyzes inflation in the United States over the past century to explain why it didn't. First, however, Chapter 13 will discuss how Creditism fared between 2008 and 2019; and Chapter 14 will describe the extraordinary economic policy response to the COVID-19 pandemic during 2020 and the first half of 2021.
Notes
1. Ben Bernanke, quoted in the Financial Crisis Inquiry Commission Report, p. 354. https://www.govinfo.gov/content/pkg/GPO-FCIC/pdf/GPO-FCIC.pdf
2. Office of Management and Budget, The White House.
3. “The Rescue of Fannie Mae and Freddie Mac,” Federal Reserve Bank of New York Staff Reports, p. 2. https://www.newyorkfed.org/medialibrary/media/research/staff_reports/sr719.pdf
4. The figures for total assets used in this chapter are taken from the Annual Reports and/or 10-K Reports filed by each company, p. xxv. https://www.govinfo.gov/content/pkg/GPO-FCIC/pdf/GPO-FCIC.pdf
5. Phil Angelides (2011), Financial Crisis Inquiry Report.
6. The source for the seven lending facilities is the 2008 Annual Report of the Federal Reserve System, pp. 51–55.
7. Monetary Authority includes the assets and liabilities of Federal Reserve Banks and Treasury monetary accounts that supply or absorb Bank Reserves.
8. Monetary Authority includes the assets and liabilities of Federal Reserve Banks and Treasury monetary accounts that supply or absorb Bank Reserves.
9. Marc Labonte, “Federal Reserve: Emergency Lending,” Congressional Research Service, updated March 27, 2020. https://fas.org/sgp/crs/misc/R44185.pdf
10. Total credit did not actually contract quarter on quarter until the second quarter of 2009. It then contracted for five consecutive quarters. Of course, it would have contracted earlier had the government not borrowed more than $1 trillion during the second half of 2008.
11. The fourth round of QE began in October 2019 following a disruption in the repo market. Then it was expanded enormously beginning in March 2020 as part of the policy response to the economic crisis caused by the COVID-19 pandemic.
12. Board of Governors of the Federal Reserve System 2008 Annual Report, p. 38
13. Board of Governors of the Federal Reserve System 2009 Annual Report, p. 88
14. Board of Governors of the Federal Reserve System 2010 Annual Report, p. 21
15. Board of Governors of the Federal Reserve System 2010 Annual Report, p. 21
16. Board of Governors of the Federal Reserve System 2012 Annual Report, p. 25
17. Monetary Authority includes the assets and liabilities of Federal Reserve Banks and Treasury Monetary accounts that supply or absorb Bank Reserves.
18. Monetary Authority includes the assets and liabilities of Federal Reserve Banks and Treasury Monetary accounts that supply or absorb Bank Reserves.
19. Monetary Authority includes the assets and liabilities of Federal Reserve Banks and Treasury Monetary accounts that supply or absorb Bank Reserves.
20. Monetary Authority includes the assets and liabilities of Federal Reserve Banks and Treasury Monetary accounts that supply or absorb Bank Reserves.
21. Monetary Authority includes the assets and liabilities of Federal Reserve Banks and Treasury Monetary accounts that supply or absorb Bank Reserves.
22. Monetary Authority includes the assets and liabilities of Federal Reserve Banks and Treasury Monetary accounts that supply or absorb Bank Reserves.
23. As discussed in Chapter 10.
24. Monetary Authority includes the assets and liabilities of Federal Reserve Banks and Treasury Monetary accounts that supply or absorb Bank Reserves.
25. Monetary Authority includes the assets and liabilities of Federal Reserve Banks and Treasury Monetary accounts that supply or absorb Bank Reserves.
26. Federal Reserve Credit is here comprised of total loans and securities held by the Fed.
27. US Monetary Base St. Louis Fed. https://fred.stlouisfed.org/series/BOGMBASE