
CHAPTER 18
China may already have surpassed the U.S. in total (R&D) expenditures at some point in 2019.
Julia Phillips, chair of the National Science Board’s science policy committee1
Investment in Research and Development (R&D) is the decisive factor in determining which country leads the world economically, technologically, and militarily. From World War I to 2019, the United States invested more in R&D than any other country. In 2019, however, China overtook the US to become the world leader in R&D investment.
Unless the United States quickly retakes its lead by investing much more in R&D, China will displace the US as the undisputed global superpower within one to two decades. The United States must not allow that to happen. Fortunately, the country has the financial resources to ensure that it does not.
This chapter provides an overview of R&D in the United States at present. It describes the kind of R&D currently being conducted, who is carrying it out, and who is paying for it. It also provides international comparisons of overall R&D spending in the United States vs. the rest of the world. The chapter reveals that, while a great deal of extraordinary work in research and development is being done in the United States, current levels of investment are not enough, because China is investing more.
The final three chapters of this book will describe how the United States can undertake R&D investment on a vastly larger scale, thereby maintaining its global preeminence indefinitely.
Current Investment in R&D
The United States invested $580 billion in research and development during 2018. Chart 18.1 shows the level of R&D investment every year from 1953 to 2018. The data is presented in constant 2012 dollars in order to remove the influence of inflation.
The growth rate in R&D investment has been slowing since the 1950s. The average annual rate of growth between 1954 and 2018 was 4.3%. It has been below average during the last three decades. Average annual growth in R&D investment was 3.3% during the 1990s, 2.9% during the 2000s, and 2.4% between 2010 and 2018. Chart 18.2 shows the clear downward trend since the 1950s.
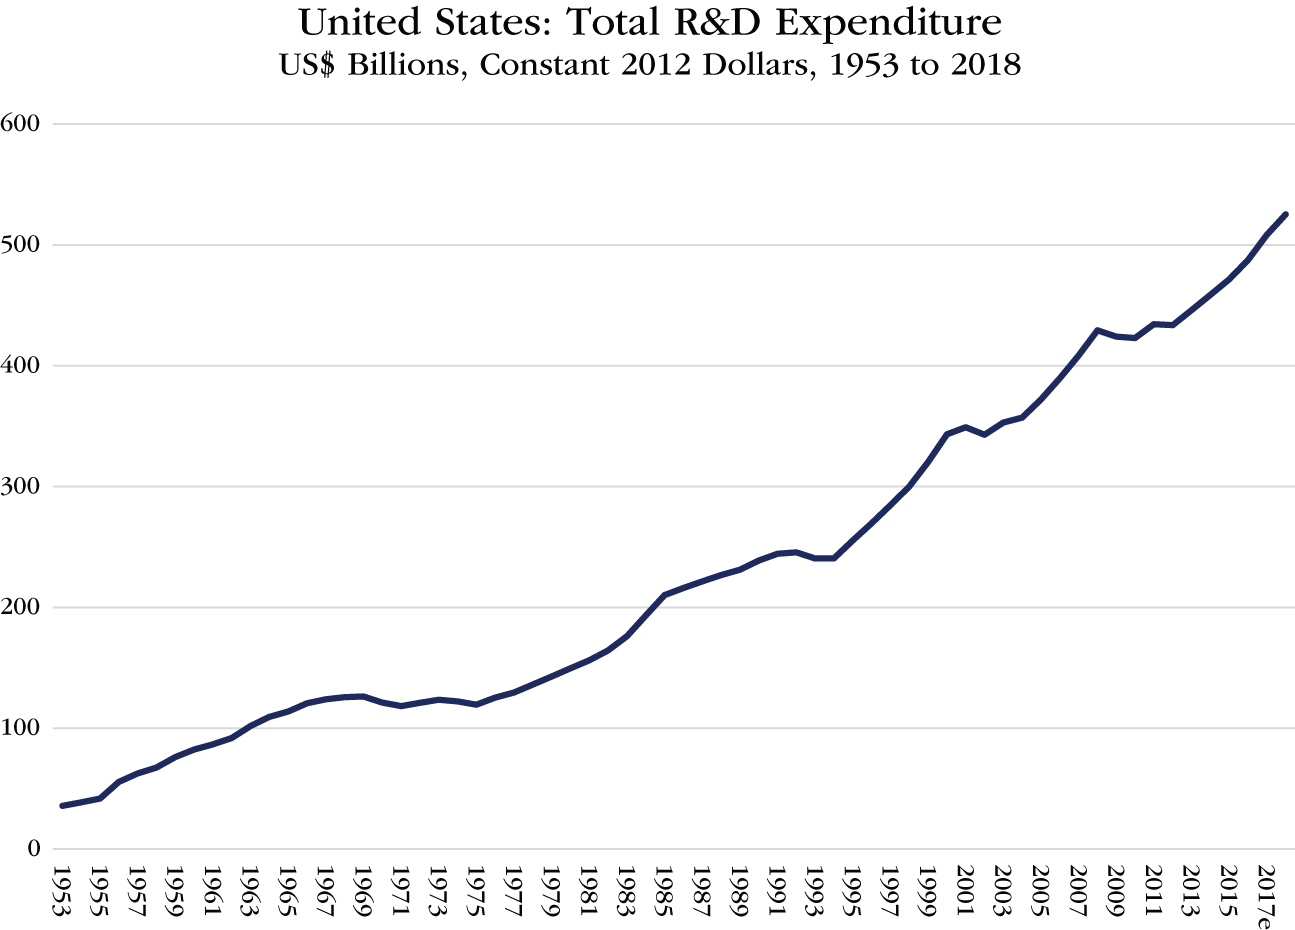
CHART 18.1 United States: Total R&D Expenditure, 1953 to 2018
Source: Data from the National Science Foundation

CHART 18.2 Total R&D Expenditure, Annual Percentage Change, 1954 to 2018
Source: Data from the National Science Foundation
Out of the $580 billion total R&D investment in 2018, the business sector carried out $422 billion of the R&D, or 73% of the total. The Federal Government carried out $58 billion (10%), Higher Education $75 billion (13%), and other Non-Profit Organizations $24 billion (4%). See Table 18.1.
There is some considerable difference between who carries out the R&D and who funds it. In particular, the Federal Government funds a significantly higher share of the R&D than it carries out. It funds 22% of all R&D, but carries out (or performs) only 10%. On the other hand, Higher Education funds significantly less R&D than it performs. Higher Education funds only 4% of all R&D while it performs 13%. These discrepancies result principally from the federal government funding the majority of the research carried out by US universities. The government also funds part of the research carried out by the business sector, although relatively little in comparison with what it provides to universities or in comparison with the business sector's total investment in R&D. Table 18.2 provides the breakdown of the sources of R&D funding in the US.
TABLE 18.1 Who Carries Out the R&D?
Source: Data from the National Science Foundation
|
US R&D Expenditure by Performing Sector: 2018 |
||
|
(Current Dollars) |
US$ Billions |
% of Total |
|
Total |
580 |
100% |
|
Business |
422 |
73% |
|
Federal Government |
58 |
10% |
|
Non-Federal Government |
1 |
0% |
|
Higher Education |
75 |
13% |
|
Non-Profit Organizations |
24 |
4% |
The business sector invested more than three times as much in R&D as the federal government did in 2018. Before 1980, however, the federal government led the country in investing in R&D. In fact, during the decade that followed the Sputnik shock in 1957, the federal government invested twice as much in R&D as the business sector did.
Business investment in R&D only overtook that of the federal government in 1980, but its lead over the government did not begin to become significant until the late 1980s. Afterwards, government investment in R&D began to stagnate, as shown in Chart 18.3.
Through the 1990s, government investment declined in real (inflation-adjusted) terms practically every year. Modest growth resumed during the 2000s, but did not last. Growth gave way to contraction again during most of the 2010s. In 2018, federal government investment in R&D was only 5% larger in real terms than it had been in 1987. The failure of the US government to expand its investment in R&D during the past three decades has been an enormous error. It deterred US productivity growth and, consequently, economic growth. Moreover, it enabled China, which has a very different attitude toward government investment in R&D, not only to catch up with the United States in R&D spending, but to surpass it.
TABLE 18.2 Who Funds the R&D?
Source: Data from the National Science Foundation
|
US R&D Expenditure by Performing Sector: 2018 |
||
|
(Current Dollars) |
US$ Billions |
% of Total |
|
Total |
580 |
100% |
|
Business |
404 |
70% |
|
Federal Government |
127 |
22% |
|
Non-federal Government |
5 |
0% |
|
Higher Education |
21 |
4% |
|
Non-profit Organizations |
23 |
4% |
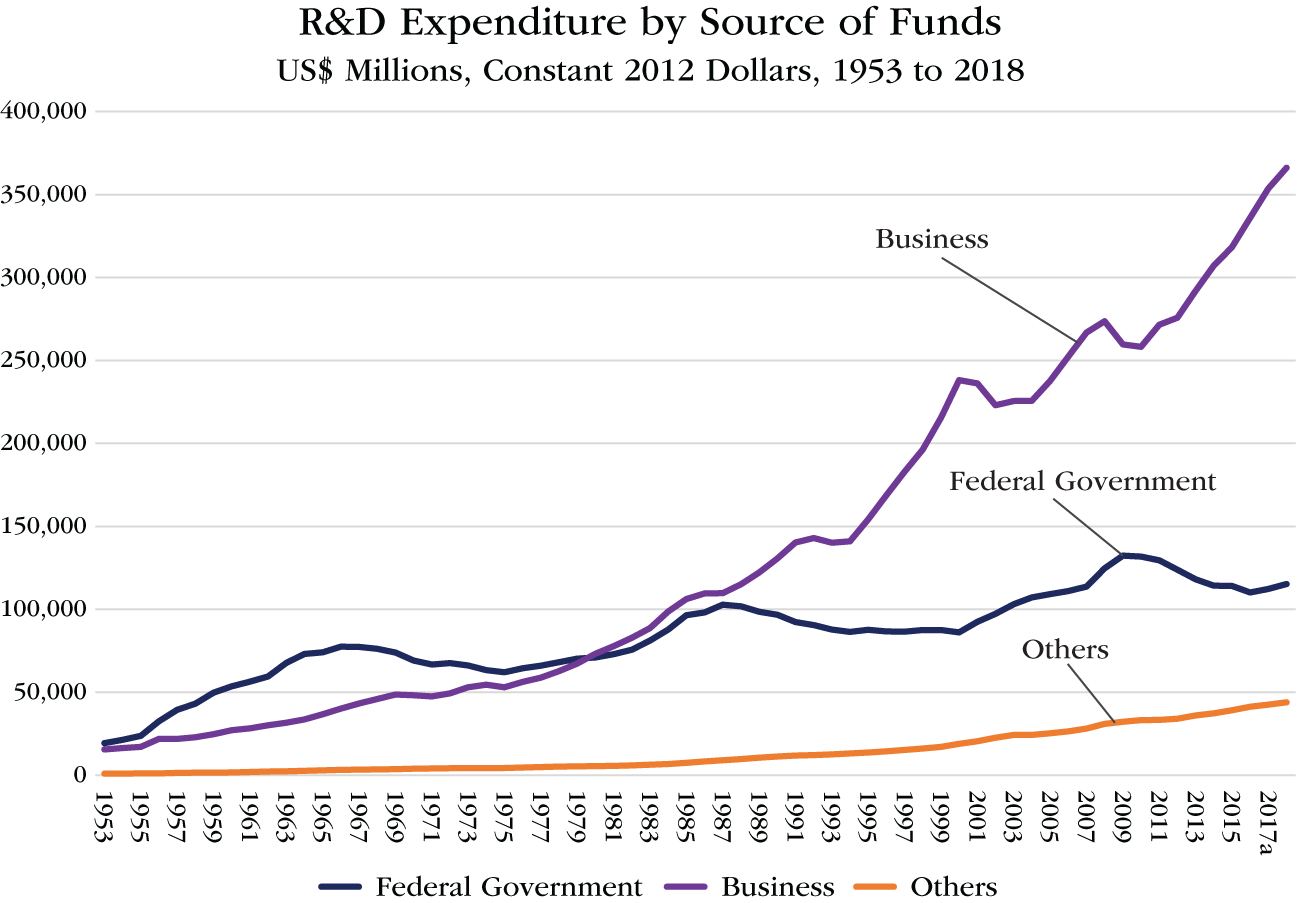
CHART 18.3 R&D Expenditure by Source of Funds, 1953 to 2018
Source: Data from the National Science Foundation
Allocation
The following paragraphs show how the business sector, the universities and the federal government allocate their R&D funding.
The Business Sector
In 2017, the business sector invested $400 billion in R&D. Manufacturing Industries accounted for $257 billion or 64% of that amount. Non-Manufacturing Industries made up the remaining $143 billion, 36%.
Table 18.3 presents the breakdown of R&D spending by the business sector across the Manufacturing Industries.
The Computer and Electronic Products industry invested the most in R&D, $79 billion. That was followed by $66 billion invested in Pharmaceuticals and Medicines, $26 billion in Aerospace Products and Parts and $24 billion in Automobiles, Trailers, and Parts.
Within the Non-Manufacturing Industries, $80 billion was invested in the Information Industry (including $34 billion into Software Publishers) and $37 billion in Professional, Scientific, and Technical Services. Table 18.4 presents the breakdown of the $143 billion invested by the business sector in Non-Manufacturing Industries.
Universities
Universities in the United States spent $79 billion on research and development during 2018. As mentioned above, most of that money was provided by the federal government. Of the $79 billion total, $62 billion was allocated to Science, $12 billion to Engineering and $5 billion to Non-Science and Engineering. Table 18.5 provides a more detailed breakdown of university expenditure by field. Most notably, it shows that universities invested $46 billion in Life Sciences, 58% of all their R&D expenditure.
TABLE 18.3 Business Sector Investment in R&D: Manufacturing Industries, 2017
Source: Based on data from the National Science Board, Science and Engineering Indicators: 2020
|
Manufacturing Industries |
|
|
Funds Spent for Business R&D Performed in the US, Selected Industries: 2017 |
|
|
All R&D |
|
|
All industries |
400,100 |
|
Manufacturing industries |
257,227 |
|
74,977 |
|
66,202 |
|
8,775 |
|
13,197 |
|
78,575 |
|
4,291 |
|
53,292 |
|
23,881 |
|
26,383 |
|
3,028 |
|
32,895 |
Note: n.e.c. – not elsewhere classified
The Federal Government
The federal government invests in R&D primarily through various federal departments and agencies. During FY2018, the government allocated $136 billion in funding for R&D. Table 18.6 lists the departments and agencies ranked by the amount of their R&D funding.
The Department of Defense received $52 billion or 39% of the total that year. The Department of Health and Human Services came next with an allocation of $37 billion, which was 27% of the total. They were followed by the Department of Energy, which received $17 billion, 13% of the total; NASA with $12 billion, 9%; and the National Science Foundation, with $6 billion, 5%. These five received 92% of total agency R&D funding. They will be described in greater detail in Chapter 21.
TABLE 18.4 Business Sector Investment in R&D: Non-manufacturing Industries, 2017
Source: Based on data from the National Science Board, Science and Engineering Indicators: 2020
|
Non-Manufacturing Industries |
|
|
Funds Spent for Business R&D Performed in the US, Selected Industries: 2017 |
|
|
$ Millions |
|
|
Non-Manufacturing industries |
142,874 |
|
80,252 |
|
34,264 |
|
45,988 |
|
7,616 |
|
36,922 |
|
13,327 |
|
17,321 |
|
6,274 |
|
18,084 |
Note: n.e.c. – not elsewhere classified
TABLE 18.5 Higher Education R&D Expenditures, by Field: FY 2018
Source: Data from the National Science Foundation
|
(Dollars in thousands) |
|
|
R&D Field |
All institutions |
|
All R&D expenditures |
79,436,487 |
|
Science |
62,407,007 |
|
2,407,676 |
|
3,171,781 |
|
45,899,964 |
|
757,719 |
|
5,256,018 |
|
1,267,419 |
|
2,755,708 |
|
890,722 |
|
Engineering |
12,386,784 |
|
Non-Science and engineering |
4,642,696 |
TABLE 18.6 Federal Research and Development Funding, By Agency, FY 2018
Source: Data from the Congressional Research Service
|
Federal Agencies ranked by their R&D funding for 2018 |
|||
|
Federal Research and Development Funding |
|||
|
By Agency: FY2018 |
|||
|
$ Billions |
% of Total |
||
|
All agencies |
136 |
100.0% |
|
|
Department of Defense |
52 |
38.6% |
|
|
Department of Health and Human Services |
37 |
27.2% |
|
|
Department of Energy |
17 |
12.9% |
|
|
National Aeronautics and Space Administration |
12 |
8.7% |
|
|
National Science Foundation |
6 |
4.7% |
|
|
Department of Agriculture |
3 |
1.9% |
|
|
Department of Commerce |
2 |
1.5% |
|
|
Department of Veterans Affairs |
1 |
0.9% |
|
|
Department of Transportation |
1 |
0.8% |
|
|
Department of the Interior |
0.9 |
0.7% |
|
|
Department of Homeland Security |
0.7 |
0.5% |
|
|
Environmental Protection Agency |
0.5 |
0.4% |
|
|
Smithsonian Institution |
0.4 |
0.3% |
|
|
Department of Education |
0.3 |
0.2% |
|
|
All other agencies |
1 |
0.9% |
|
Federal government investment in R&D through all government agencies peaked in 2010. The amount invested in 2018 was 10% below the peak. Chart 18.4 shows the federal government's R&D obligations for all agencies in total and for various individual agencies from FY2008 to FY2018. The United States would be richer and more secure today if the government had substantially increased its R&D funding across that decade instead of allowing it to stagnate.
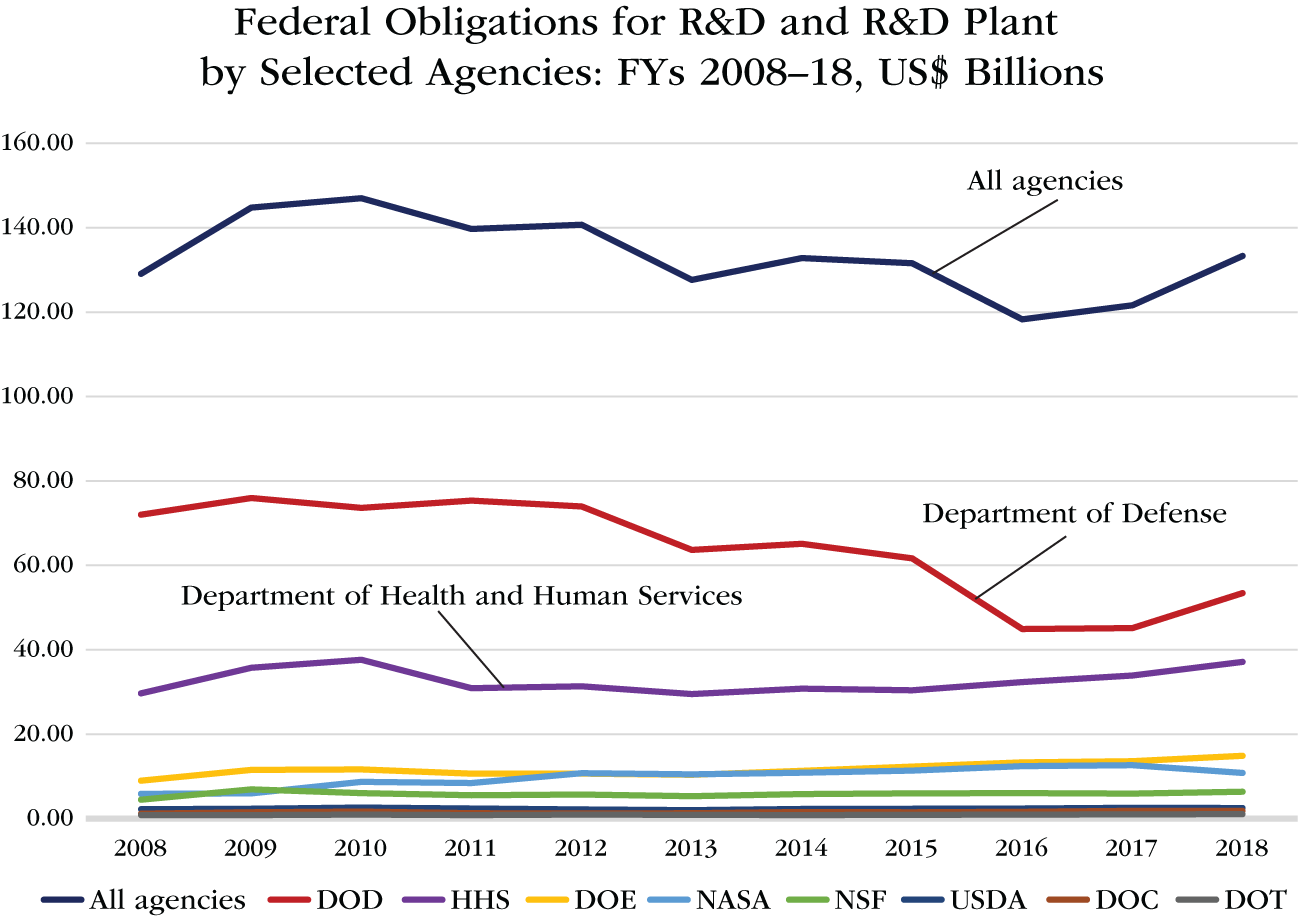
CHART 18.4 Federal Government Obligations for R&D and R&D Plant by Selected Agencies: FYs 2008–2018
Source: Data from the National Science Foundation
Types of R&D
Research and development is divided into three classifications: basic research, applied research, and experimental development. During 2017, 17% of all R&D expenditure in the United States was for basic research, 20% was for applied research, and 63% for experimental development, as shown in Table 18.7.
Basic research is experimental or theoretical work undertaken primarily to acquire new knowledge of the underlying foundations of phenomena and observable facts, without any particular application or use in view.
TABLE 18.7 Types of R&D
Source: Data from the National Science Foundation
|
Types of R&D |
||
|
US R&D Expenditures by Type of Work: 2017 |
||
|
US$ Billions |
% of Total |
|
|
Total R&D |
548 |
100% |
|
Basic research |
91 |
17% |
|
Applied research |
109 |
20% |
|
Experimental development |
348 |
63% |
Applied research is original investigation undertaken in order to acquire new knowledge; directed primarily, however, toward a specific, practical aim or objective.
Experimental development is systematic work, drawing on knowledge gained from research and practical experience and producing additional knowledge, which is directed to producing new products or processes and to improving existing products or processes.2
Basic research is particularly important because applied research and experimental development are generally built on knowledge first derived from basic research. Vannevar Bush, who oversaw the Manhattan Project, described the importance of basic research as follows:
Basic research leads to new knowledge. It provides scientific capital. It creates the fund from which the practical applications of knowledge must be drawn. New products and new processes do not appear full-grown. They are founded on new principles and new conceptions, which in turn are painstakingly developed by research in the purest realms of science.3
The business sector spends less on basic research than the government does because it can take a very long time before basic research can be turned into products that can be sold. Businesses, therefore, focus on experimental development, which is more likely to generate profits sooner. However, their experimental development programs often utilize knowledge that was generated through basic research paid for by the government.
Intel, Apple, Google, and SpaceX are prime examples of companies that prospered by incorporating the products, techniques, and capabilities generated by government funded basic research.
Table 18.8 shows R&D expenditure in the US by type of work and by source of funds. The top half of the table shows the dollar amounts and the bottom half shows the breakdown in percentage terms.
In 2018, the federal government funded 22% of all the R&D that was done in the United States. But it funded 42% of the basic research, 34% of the applied research, and just 13% of the experimental development, whereas, the business sector only funded 29% of the basic research, but 85% of the experimental development. As shown in the top half of Table 18.8, the federal government invested $40 billion in basic research, while the business sector invested only $28 billion in basic research.
In total, the United States invested $96 billion in basic research in 2018 (measured in current dollars). Here, it is worth pointing out that the Federal Reserve is now creating $120 billion per month through its current round of Quantitative Easing. That statistic helps put into perspective how little the United States is actually investing in basic research and also how easy it would be for the country to invest much more by using additional Quantitative Easing to finance the investment. With just 24 days of money creation through QE at its current pace, the United States could double its annual investment in basic research.
Chart 18.5 shows total expenditure on basic research in constant 2012 dollars from 1953 to 2018.
The growth rate for investment in basic research has been weak for decades, but during the past decade it has been particularly depressed. During the 10 years following the Sputnik shock in 1957, total investment in basic research grew at an average annual rate of 12.7%. During the 1990s, it increased only 3.6% a year on average, followed by 4.4% a year during the 2000s, and by only 1.5% during the 2010s. This weakening trend is clear in Chart 18.6, which presents the annual percentage change in expenditure in basic research going back to 1954.
TABLE 18.8 R&D Expenditure: Types of Work and Source of Funds: 2018
Source: Data from the National Science Foundation
|
Source of Funding, US$ Millions, Current Dollars |
||||||
|
Type of R&D |
Total |
Business |
Federal Government |
Non-federal Government |
Higher Education |
Others |
|
Total R&D |
579,985 |
404,231 |
127,246 |
4,726 |
21,120 |
22,662 |
|
Basic research |
96,490 |
27,973 |
40,365 |
2,497 |
13,140 |
12,516 |
|
Applied research |
114,958 |
62,369 |
39,465 |
1,632 |
5,671 |
5,821 |
|
Experimental development |
368,537 |
313,890 |
47,416 |
597 |
2,310 |
4,325 |
|
Source of Funding, % of Total |
||||||
|
Type of R&D |
Total |
Business |
Federal Government |
Non-federal Government |
Higher Education |
Others |
|
Total R&D |
100% |
70% |
22% |
1% |
4% |
4% |
|
Basic research |
17% |
29% |
42% |
3% |
14% |
13% |
|
Applied research |
20% |
54% |
34% |
1% |
5% |
5% |
|
Experimental development |
64% |
85% |
13% |
0% |
1% |
1% |
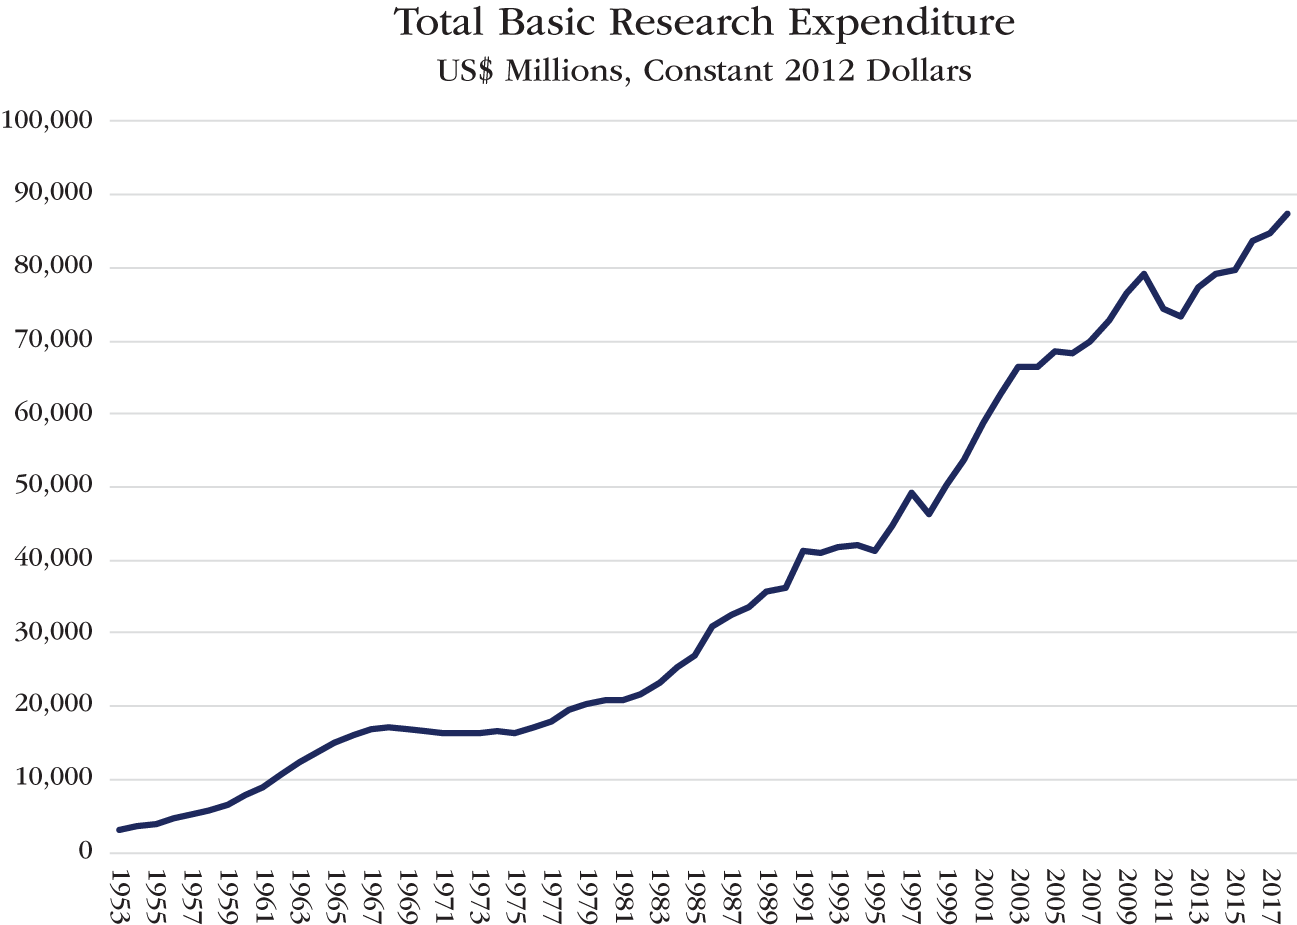
CHART 18.5 US: Total Expenditure on Basic Research, 1953 to 2018
Source: Data from the National Science Foundation
Once again, insufficient government investment is primarily to blame for the tepid growth in the United States' total investment in basic research.
Chart 18.7 shows the breakdown of expenditure on basic research between the federal government, business, and higher education from 1953 to 2018, measured in constant 2012 dollars. Between 2013 and 2018, the federal government invested less in basic research each year than it did in 2002.

CHART 18.6 Annual % Change in Total Expenditure on Basic Research, 1954 to 2018
Source: Data from the National Science Foundation
During the 10 years following the launch of Sputnik, federal government investment in basic research expanded by an average of nearly 16% a year. Since 1970, the average annual growth rate has been just 2.4%. During the 2010s, it weakened still further to just 0.8%. Federal government investment in basic research actually contracted in real terms during 7 out of the last 13 years (see Chart 18.8).
This weak and declining government investment in basic research has been a terrible mistake. The United States economy today would have been a great deal stronger and the country's longer-term prospects very much brighter if the federal government had continued to aggressively expand its investment in basic research even after the United States had won the Space Race. Regrettably, it did not. As a consequence, the United States is once again confronting a new Sputnik moment now that China has overtaken the United States in total R&D investment and, concurrently, won the race to develop 5G.
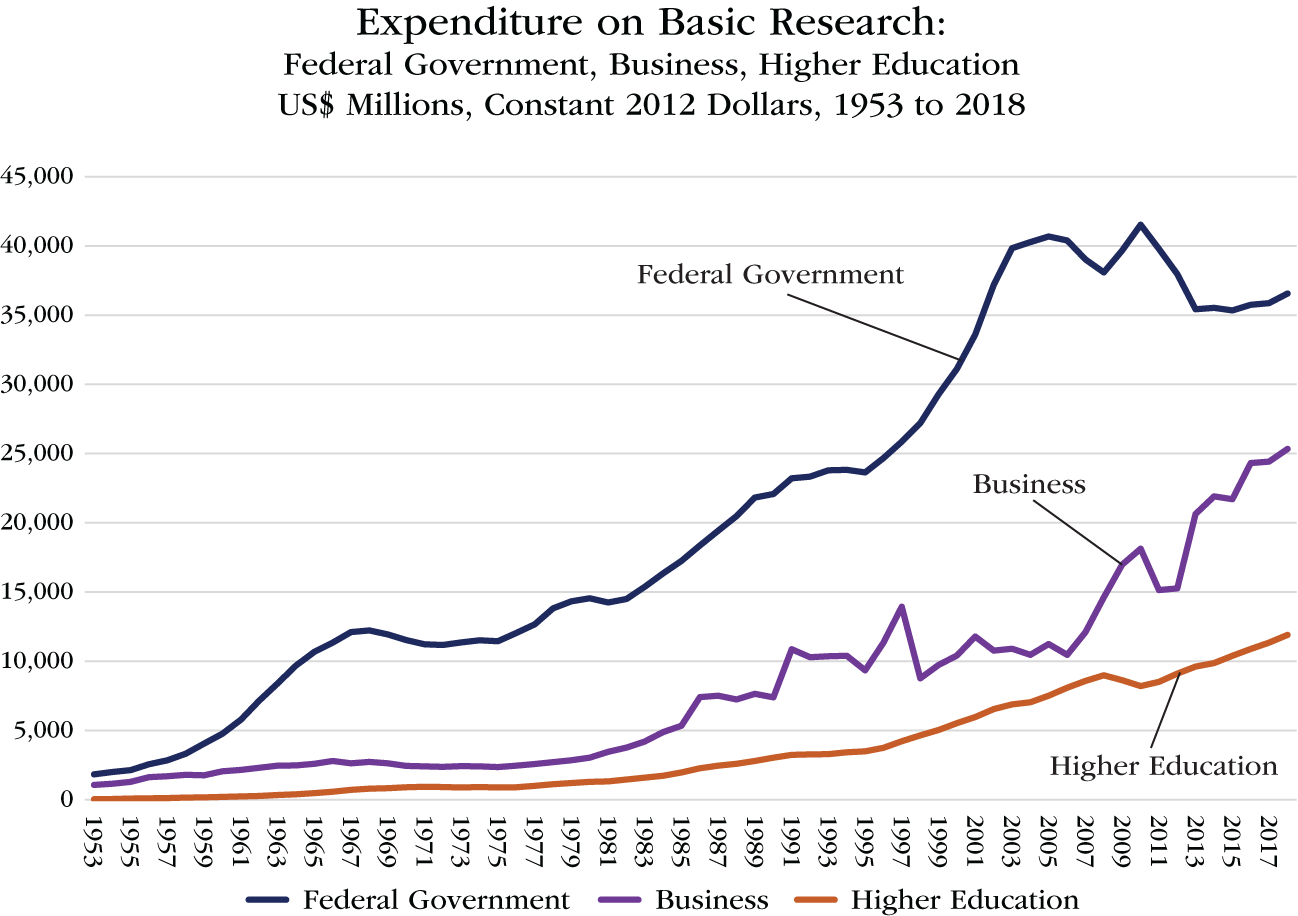
CHART 18.7 Expenditure on Basic Research: Federal Government, Business, and Higher Education, 1953 to 2018
Source: Data from the National Science Foundation
International Comparisons
On January 15, 2020, the National Science Foundation published its biannual Science and Engineering Indicators for 2020. The report provides data on R&D trends in the United States and comparisons with other countries up to 2017. The report shows that the United States still invested more in R&D than any other country in 2017. However, the trends in the rate of annual R&D investment growth strongly suggest that China surpassed the United States in 2019.
Table 18.9 lists the eight countries that invested the most in R&D during 2017. The United States was in first place that year, followed closely by China, and then by Japan, Germany, and South Korea (see Chart 18.9).
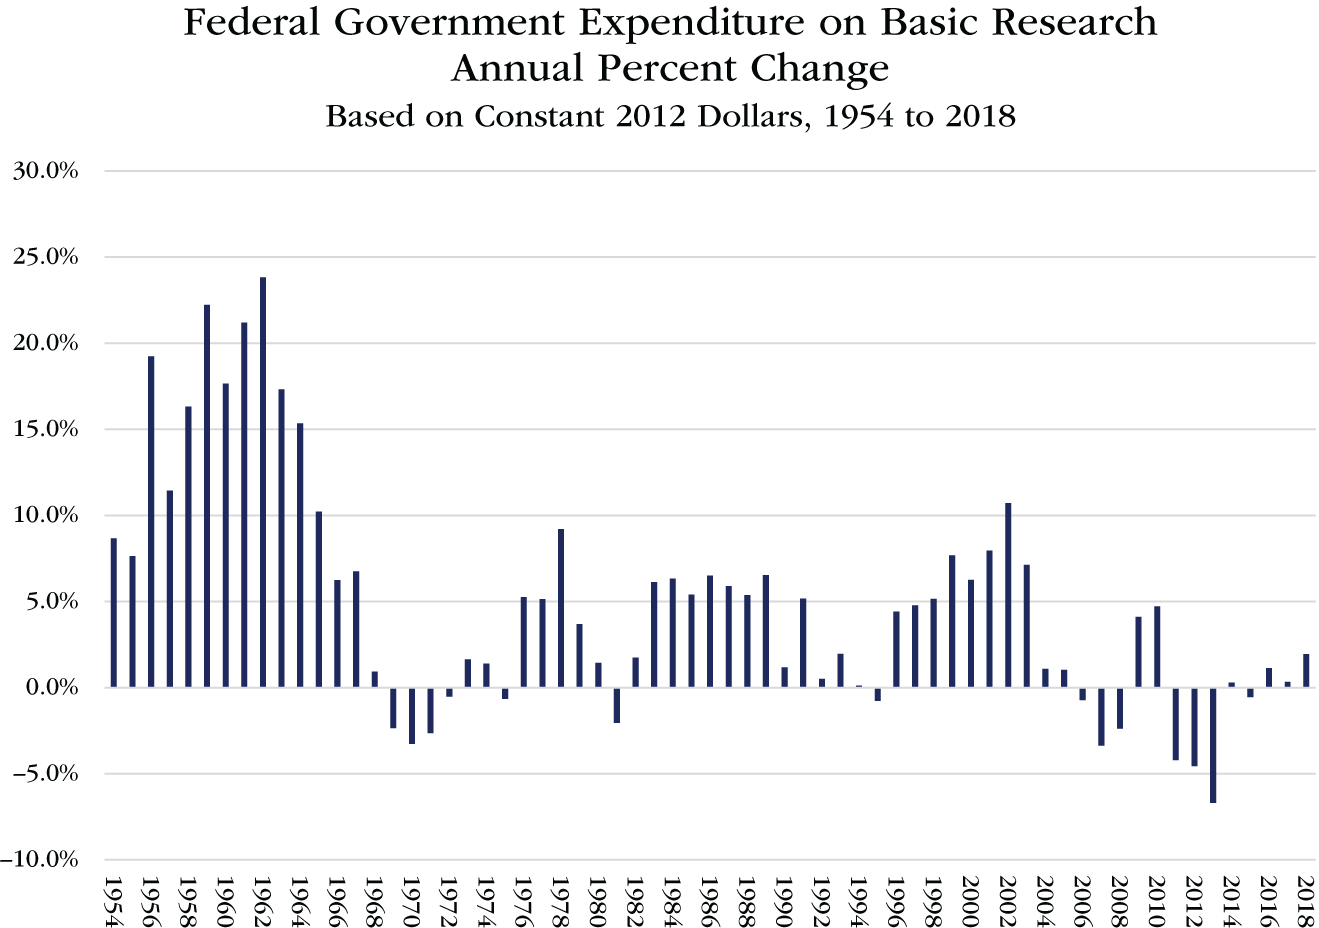
CHART 18.8 Federal Government Expenditure on Basic Research, Annual Percentage Change, 1954 to 2018
Source: Data from the National Science Foundation
TABLE 18.9 Gross Domestic Expenditure on R&D: 2017
Source: Data from the National Science Foundation
|
Gross Domestic Expenditure On R&D: 2017 |
|
|
Selected Countries |
|
|
US$ Billions (Current Dollars, based on purchasing power parity) |
|
|
United States |
549 |
|
China |
496 |
|
Japan |
171 |
|
Germany |
132 |
|
South Korea |
91 |
|
France |
65 |
|
India |
50 |
|
United Kingdom |
49 |

CHART 18.9 Gross Domestic Expenditure on R&D by the United States, the EU, and Selected Other Countries, 1990–2017
Source: National Science Board, Science and Engineering Indicators: 2020
The United States invested eight times more in R&D than China in 2000. By 2017, it only invested 10% more, $549 billion compared with $496 billion invested by China. Chart 18.10 illustrates the extraordinary surge in Chinese R&D investment relative to that of the United States.
Renewable energy provides one example of an important technology where China is investing much more in R&D than the United States. Between 2010 and the first half of 2019, China invested more than twice as much as the United States in renewable energy. China invested $758 billion, whereas the United States invested only $356 billion.4
At the time of the publication of the National Science Board’s Science and Engineering Indicators for 2020, Julia Phillips, chair of the National Science Board's science policy committee, told The Washington Post that “China may already have surpassed the U.S. in total (R&D) expenditures at some point in 2019.”5
Given recent trends in R&D spending by each country, it is likely that China did overtake the United States. Measured in dollars, on a purchasing power parity basis, China has increased its investment in R&D by substantially more than the Uniteds States every year from 2009, as shown in Chart 18.11.

CHART 18.10 Gross Domestic Expenditure on R&D: The US vs. China, 2000 to 2017
Source: National Science Board, Science and Engineering Indicators: 2020
Moreover, Chinese investment in R&D has grown at an average of 17.4% a year since 2000, compared with only 4.3% average annual growth for the United States (see Chart 18.12).
During 2017, the most recent year comparable data is available, the growth rate of Chinese investment had slowed to 9.9%, whereas that of the United States was above average, at 6.3%. Nevertheless, the rate of growth in Chinese investment in R&D remained 57% larger. Assuming each country retained its 2017 rate of R&D investment growth every year this decade, China would invest nearly 40% more than the United States in R&D by 2030, as shown in Chart 18.13. Should the United States allow that scenario to play out, it will become a vulnerable, second rate power long before mid-century.
Next, Table 18.10 shows gross expenditure on R&D by type of work in the United States vs. China.

CHART 18.11 R&D Investment, Annual Dollar Change: The US vs. China, 2001 to 2017
Source: National Science Board, Science and Engineering Indicators: 2020
In the United States, 17% of all R&D expenditure is for basic research. In China, only 6% is spent on basic research. In China, 84% is spent on experimental development; whereas, the US only spends 64% on experimental development.
This suggests China is utilizing the knowledge derived from other countries' basic research to conduct its experimental development, which it then turns into products that it sells to the countries that funded the basic research in the first place. In 2017, China actually spent more on experimental development, $416 billion, than the United States, $348 billion.
The Second Great Divergence
5G, fifth generation wireless technology, is 100 times faster than 4G. China launched 5G in 50 Chinese cities in November 2019. By the end of 2019, there were more than 130,000 5G base stations in China. There will soon be millions.6

CHART 18.12 R&D Investment, Annual Percentage Change: The US vs. China, 2001 to 2017
Source: National Science Board, Science and Engineering Indicators: 2020
China has an enormous lead over the United States in 5G. Not only has China won the 5G race, the United States is not even in the race. Huawei is the world leader. Ericsson of Sweden is in second place. No American companies are even in the running.
5G supremacy will give China a great advantage in developing autonomous vehicles, drones, and augmented and virtual reality, as well as in developing the Internet of Things (IoT). Moreover, the nature of the 5G network makes it a national security risk for other countries because the 5G equipment can be used for espionage. If a country adopts China's 5G equipment, then the Chinese government would be able to access all the data transmitted across that equipment.

CHART 18.13 Gross Domestic Expenditure on R&D: The US vs. China, 2000 to 2030 estimate
Source: National Science Board, Science and Engineering Indicators: 2020. Author’s projections
TABLE 18.10 Gross Expenditure on R&D by Type of Work: The US vs. China, 2017
Source: Based on data from the National Science Foundation
|
Gross expenditures on R&D, by type of work: The US vs. China 2017 |
||||
|
(PPP billions of dollars and percent share) |
||||
|
Total R&D PPP US$ Billions |
Basic |
Applied |
Experimental Dev. |
|
|
United States |
549 |
92 |
109 |
348 |
|
China |
496 |
28 |
52 |
416 |
|
Share of total (%) |
||||
|
United States |
100% |
17% |
20% |
63% |
|
China |
100% |
6% |
11% |
84% |
If China wins the AI Race, as it has won the 5G Race, then China will rule the world. The first country to achieve artificial general intelligence, the point where machines can perform any task that a human can, is likely to have the rest of the world at its mercy, because, after that, AI will quickly accelerate exponentially beyond human intelligence.
The Carnegie Endowment for International Peace published a report in October 2019 stating:
… some international relations analysts and historians point out that AI technology could bring about a “Second Great Divergence” of productivity – allowing countries and firms that are the earliest and most successful adopters to leap ahead of other peers – following the First Great Divergence brought about by the Industrial Revolution.7
The Industrial Revolution enabled Western Europe to conquer most of the rest of the world. The AI Race is a winner take all contest. The winner will have the twenty-first century equivalent of a nuclear weapons monopoly.
China has a plan to win that race. They have given that plan a name. It is called Made in China 2025. It was announced by China's State Council in May 2015.
Made in China 2025 is stage one of an ambitious three-stage, state-led program with the ultimate aim of making China the world's leading manufacturing power by 2049. It established “Nine Priority Tasks.” These are
The 10 key sectors to be promoted are
The United States doesn't have a plan. But it desperately needs one.
When the Soviet Union beat the United States into space by launching the world's first satellite in 1957, the US government responded by creating NASA in 1958. During the next three decades, the US government invested so aggressively in missile technology that the USSR could not keep up. It went bankrupt trying and ultimately collapsed because its government was unable to invest as much as the US government did. This policy response enabled the United States to retain its global preeminence for another 60 years.
China's lead in 5G technology is, at least, as great a threat to the United States as the Soviet Union's lead in the Space Race was. If China continues to invest more in R&D than the United States does, it will quickly surpass the United States and become the world's leading technological, economic, and military superpower.
The rest of this book will describe how the United States can prevent that from happening by investing much more in R&D than China can afford to do.
Notes
1. Quoted in “Science and engineering report shows continued loss of U.S. dominance,” Washington Post, January 15, 2020.
2. Science and Engineering Indicators 2018, National Science Foundation, p. 44.
3. Vannevar Bush, “Science, the Endless Frontier,” National Science Foundation, July 1945. https://basicresearch.defense.gov
4. Global Trends in Renewable Energy Investment: 2019, p. 56.
5. “Science and engineering report shows continued loss of U.S. dominance,” Washington Post, January 15, 2020.
6. “What is the difference between 4G and 5G?” Just Ask Thales. https://www.justaskthales.com/en/difference-4g-5g/
7. “Competing With China on Technology and Innovation,” The Carnegie Endowment for International Peace. October 2019.
8. “Made in China 2025” Industrial Policies: Issues for Congress, Congressional Research Service, August 11, 2020. https://fas.org/sgp/crs/row/IF10964.pdf