
CHAPTER 20
Financing isn't a constraint; real resources are.
Stephanie Kelton1
The Fed has the power to create money, as this book has shown again and again.
It has exercised that power in a dramatic fashion during four great national emergencies: World War I, World War II, the financial crisis of 2008 and the COVID-19 pandemic of 2020. It should use that power now to finance a multitrillion-dollar investment program targeting the Industries of the Future over the next 10 years. If it does, the entire investment program could be carried out at no cost whatsoever to the American taxpayer. This chapter discusses the mechanics of how that could be done.
Financing the Investment Program at No Cost
As stated in Chapter 16, the correct approach is for the US government to invest as much as possible as quickly as possible, with the exact amount and speed to be determined through trial and error. The previous chapter used an example of a $10 trillion investment program carried out over 10 years to illustrate how the government's fiscal position would be impacted by such an investment under various scenarios. This chapter will use the same amount and time frame, $10 trillion over 10 years, to portray how the Fed's balance sheet would be affected by a large-scale investment program of this type.
This chapter will argue that the Fed should monetize the entire cost of the investment program. In this approach, when the investment program is announced, it would include a commitment from the Fed to finance the entire program by creating $10 trillion over 10 years and buying all the bonds the government would issue to fund the investments. Technically, the government would pay the Fed interest on all those bonds every year, but since the Fed is required to return all its profits to the government, the net cost to the government would be zero, or, at least, very close to zero.
The Fed would also specify that it would never sell those bonds and that it would always roll them over when they mature. Or, to make matters simpler still, the government could sell the Fed perpetual bonds that never mature. That would make it clear that the $10 trillion of government debt issued to finance the investment program would be cost-free debt, with the principal never to be repaid and the annual interest expense returned to the Treasury Department each year, forever.
For all intents and purposes, such an approach would cancel all $10 trillion of the debt the government would issue to finance the investment program. Debt never to be repaid and paying no net interest would be debt in name only. It could be forgotten as it would never cost the Treasury Department or American taxpayers anything.
However, to finance the investment program at no cost to the taxpayer, the Fed would have to stop paying interest on the Bank Reserves that commercial banks hold at the Fed. This would require the Fed to raise the required reserve ratio high enough to absorb all the Bank Reserves that would be created as a result of the Fed creating money to buy the government's $10 trillion of investment-related debt.
Here some background information is required.
Seigniorage and Bank Reserves
It is amazing how much money you can make when you make the money. The Federal Reserve is one of the world's most profitable institutions. Luckily for US taxpayers, the Fed is required to hand over all of its profits to the US Treasury Department every year. Between 1914 and 2020 the Fed gave the Treasury Department $1.6 trillion, as shown in Chart 20.1.
The US government debt is more than $1.6 trillion lower now than it would have been thanks to the transfer of the Fed's profits to the Treasury. It is more than $1.6 trillion lower because interest expense would have accumulated on the additional $1.6 trillion of debt and added to the government's total debt. Ninety-nine percent of the Fed's remittances to the Treasury occurred after 1971, when dollars ceased to be linked to gold. 60% occurred after 2008, as the Fed created trillions of dollars in response to the economic crisis and, more recently, in response to the COVID-19 pandemic.

CHART 20.1 The Fed's Remittances to the US Treasury Department, 1914 to 2020
Source: The Federal Reserve
If the Fed were a corporation, in 2020, based on its remittances to the Treasury of $86.9 billion, it would have been the most profitable corporation in the world. Apple, which was the world's most profitable corporation in 2020, would have come in second place with $57.4 billion of earnings.2
Before the crisis of 2008, most of the Fed's earnings came from issuing Federal Reserve Notes. The Fed supplies currency to commercial banks upon demand, but it does not give the dollars away for free. The Fed is required to hold Treasury securities for the dollars it issues. So, in essence, the Fed provides the banks with dollars in exchange for government bonds. The Fed makes a profit in the process because it earns interest income on the government bonds it acquires but pays no interest on the currency it issues. This process is known as seigniorage.3
Chart 20.2 illustrates this in a simplified balance sheet of the Fed from 1945 to 2006. By 2006, the Fed had issued $783 billion of Federal Reserve Notes and acquired $779 billion of government securities.

CHART 20.2 The Fed's Balance Sheet, Major Items Only, 1945 to 2006
Source: Data from the Federal Reserve’s Annual Reports
During the years following the economic crisis, the Fed's profits became very substantially larger as the result of Quantitative Easing. Between the end of 2007 and end of 2014, the Fed's total assets grew by $3.6 trillion as it bought government securities and mortgage-backed securities issued or guaranteed by the government-sponsored enterprises (GSEs). It acquired those bonds by making deposits into the reserve accounts at the Fed of the banks from which it purchased the bonds. The Fed earned a higher rate of interest on the bonds it acquired than it paid on the reserves held by the banks. Consequently, the Fed's profits soared, peaking at $117 billion in 2015 versus a pre-2008 crisis peak of $35 billion in 2007.
By 2014, the Fed's holdings of Treasury securities had increased to nearly $2.6 trillion and its holdings of GSE-related debt had jumped from zero in 2006 to almost $1.8 trillion. Meanwhile, on the liabilities side of the Fed's balance sheet, Bank Reserves has surged to nearly $2.4 trillion, while currency had grown to $1.3 trillion. Chart 20.3 illustrates these changes.
Notice that Bank Reserves did not increase in line with the Fed's holdings of Treasury securities and GSE-related debt. Between the end of 2007 and the end of 2014, the former increased by only $2.4 trillion, while the latter grew by $3.6 trillion. The $500 billion increase in currency accounts for part of the $1.2 trillion difference. That is because when the banks obtain currency from the Fed, the Fed debits their reserve accounts in exchange. In other words, as currency expands, it absorbs Bank Reserves. An increase in reverse repurchase agreements of $469 billion and a $219 billion increase in the deposits in the Treasury's General Account at the Fed made up most of the rest of the difference between the growth in the Fed's total assets and the growth in Bank Reserves. When reverse repurchase agreements and the deposits in the Treasury's General Account increase, they also absorb Bank Reserves. However, they don't increase on a permanent basis the way that currency steadily has in recent decades.4

CHART 20.3 The Fed's Balance Sheet, Major Items Only, 1945 to 2014
Source: Data from the Federal Reserve’s Annual Reports
The Fed's interest income surged as it accumulated trillions of dollars' worth of interest earning assets. Meanwhile, its expenses remained limited. As mentioned above, the Fed does not pay interest on the currency it issues. It only began paying interest on Bank Reserves in 2008. The law prohibited the Fed from paying interest on Bank Reserves until Congress removed that prohibition that year. Even then, the interest rate the Fed paid on Bank Reserves was less than 0.25% per annum until December 2015.
Before 2008, there was no need for the Fed to pay interest on Bank Reserves. However, the Fed's policy response to the crisis disrupted the Fed's traditional operating procedures, making it difficult for the Fed to control the federal funds rate in the way that it had done in the past.
Traditionally, the Fed had controlled the federal funds rate by keeping Bank Reserves scarce. If it wanted the federal funds rate to rise, it could conduct an open market operation that would remove reserves from the banking system. More specifically, the Fed would sell to a bank a government bond that it had bought in the past. In such a transaction, the Fed would collect payment for the bond by debiting the reserve account the acquiring bank held at the Fed, thereby reducing that bank's reserves and, therefore, the reserves of the entire banking system. With fewer reserves in the system, the federal funds rate would rise.
Conversely, if the Fed wanted the federal funds rate to fall, it would acquire a government bond from a bank by crediting that bank's reserve account at the Fed. The injection of new reserves would make reserves more plentiful throughout the banking system, causing the federal funds rate to fall.
After 2008, however, Bank Reserves were no longer scarce. In response to the crisis of 2008, the Fed injected trillions of dollars into the banking sector, first through discounting operations and then through open market operations (QE). Afterwards, so long as Bank Reserves remained superabundant, the Fed could no longer control the federal funds rate as it had in the past. Small-scale open market sales would have no impact on the federal funds rate. Only the complete reversal of Quantitative Easing would have served to make the reserves of the banking system scarce enough to enable the Fed to adjust the federal funds rate using the methods it had employed before 2008.
The federal funds rate was set at a range between 0% and 0.25% from December 2008 and December 2015. In December 2015, the Fed decided to begin tightening monetary policy with a 25-basis point rate hike which took the federal funds rate to a range of 0.25% to 0.5%. In order to make this decision effective, the Fed began paying just above 0.25% interest on the reserves banks held in their reserve accounts at the Fed. That ensured that the banks would not lend to anyone at less than 0.25%, since they could earn a little more than 0.25% by holding reserves at the Fed.
Between December 2015 and December 2018, the Fed gradually increased the federal funds rate to a range of 2.25% to 2.5%. It accomplished this by increasing the interest rate it paid on Bank Reserves to just above 2.25% (see Chart 20.4).

CHART 20.4 The Effective Federal Funds Rate, 2008 to mid-2021
Source: Data from the Federal Reserve Bank of St. Louis
When the Fed began moving the federal funds rate up by paying more interest on Bank Reserves starting in December 2015, its profits began to fall. Until then, nearly all of the interest income it earned on the bonds it had acquired through its Quantitative Easing program had gone straight to the Fed's bottom line as profits. Once it began hiking the interest it paid on Bank Reserves, however, the interest it paid to banks had to be deducted from its interest income. That reduced the Fed's profits and, therefore, the amount of money the Fed handed over the Treasury Department each year thereafter. When the Fed began reducing the size of its assets through Quantitative Tightening in October 2017, that further reduced the Fed's profitability. By 2019, the Fed's profits had fallen by more than half from the peak, to $55 billion. In 2020, they rebounded sharply back to $86.9 billion, first because the Fed acquired an additional $3.2 trillion of interest-earning assets during the year and, second, because it also slashed the rate of interest it paid on Bank Reserves back very close to 0% in March, as part of its policy response to the pandemic.
The Fed's Balance Sheet Projected to 2031
This section describes how the Fed's balance sheet would evolve between 2019 and 2031, assuming the US government finances a $10 trillion investment program between 2022 and 2031 and assuming that the Fed creates $10 trillion in order to monetize the cost of the entire investment program. It is also assumed that the Fed continues its ongoing asset purchase program at the current pace of $120 billion a month through the end of 2021 and then tapers its asset purchases by $10 billion each month starting in January 2022, thereby bringing this round of Quantitative Easing to an end in December 2022. Under these assumptions, the Fed's total assets would increase by a total of $2.1 trillion during 2021 and 2022 as the result of Quantitative Easing, and by a further $10 trillion between 2022 and 2031 as a result of financing the investment program.
Altogether, therefore, the Fed's assets would increase from $7.4 trillion at the end of 2020 to $19.5 trillion at the end of 2031, or by $12.1 trillion over 11 years. This would come on top of the $3.2 trillion (76%) jump in the Fed's total assets during 2020. The total increase between the end of 2019, the eve of the pandemic, and 2031 would be $15.3 trillion or 366% over 12 years.
While that would be a very large increase in over just a dozen years, it would still be less than the 417% increase in the Fed's total assets during the seven years between 2007 and 2014 in the aftermath of the crisis of 2008. Chart 20.5 shows the increase in the Fed's total assets out to 2031, given the assumptions described above.
In that scenario, and also adopting the unrealistically pessimistic assumption that the $10 trillion investment program would have no impact on the size of the US economy whatsoever, then the Fed's total assets relative to the size of the US economy would increase from 35% of GDP in 2020 to 58% of GDP in 2031, as depicted in Chart 20.6.
That would mean that 10 years from now, after the Fed had financed much of the government's policy response to the COVID-19 pandemic, as well as a $10 trillion investment program that had failed to generate a single cent of economic growth, then the ratio of the Fed's total assets to GDP, at 58%, would be at the same ratio that the Bank of Japan's (BOJ) total assets to Japanese GDP reached in 2014 and only 56% as large as that Japanese ratio was on the eve of the pandemic in 2019, when it reached 104%. By the end of 2020, the ratio of the BOJ's total assets to Japanese GDP had spiked to 127% due to Japan's policy response to the pandemic. Given that Japan has not experienced any harmful consequences as the result of the BOJ accumulating assets in excess of the size of Japan's GDP, the growth in the ratio of the Fed's total assets to GDP to 58% by 2031 should be easily manageable even in an unrealistic worst-case scenario as the one presented here. The ratio of the BOJ's total assets to GDP from 2000 to 2020 is shown in Chart 20.7.
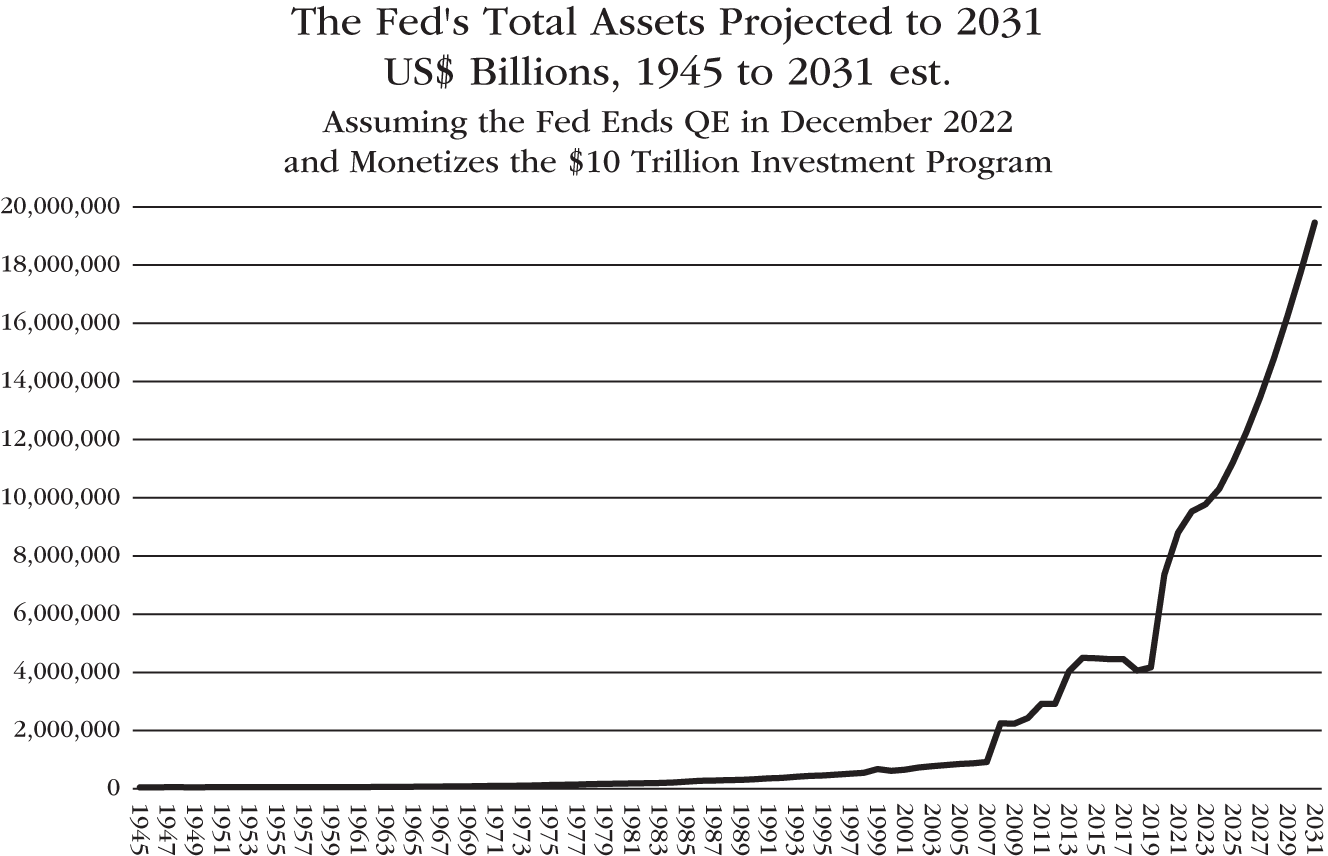
CHART 20.5 The Fed's Total Assets Projected to 2031 est.
Source: Data from the Federal Reserve’s Annual Reports, incorporating the author’s projections for the Investment Program
It should also be noted that the ratio of the European Central Bank's5 total assets had reached 62% of the Euro Area’s GDP at the end of 2020.6 That is already larger than the Fed's total assets relative to US GDP would be in 2031 in the scenario discussed above.

CHART 20.6 Fed's Total Assets as a Percentage of GDP, 1945 to 2031 est.
Source: Data from the Federal Reserve’s Annual Reports, and the Bureau of Economic Analysis, incorporating the author’s projections for the Investment Program
How, then, would a $12.1 trillion expansion of the Fed's total assets between 2020 and 2031 impact the major items on the Fed's balance sheet, and, in particular, how large would interest-bearing Bank Reserves grow in this scenario?
How the Fed's balance sheet evolves on the asset side would depend on the split between the Fed's purchases of Treasury securities and its purchases of agency and GSE-backed securities. The evolution of the liabilities side of the balance sheet would be determined primarily by the growth in currency in circulation. Chart 20.8 presents one scenario of what the evolution of the four major items on the Fed's balance sheet could look like between 2019 and 2031.

CHART 20.7 BOJ Total Assets as Percentage of GDP, 2000 to 2020
Source: Data from the Federal Reserve Bank of St. Louis

CHART 20.8 The Fed's Balance Sheet Projected to 2031, Major Items Only, 1945 to 2031 est.
Source: Data from the Federal Reserve, incorporating the author’s projections
In this scenario, on the asset side of the Fed's balance sheet, the Fed's holdings of Treasury securities would increase to $16.1 trillion in 2031, while its holdings of agency and GSE-backed securities would rise to $2.8 trillion that year. On the liabilities side of the balance sheet, currency in circulation (Federal Reserve Notes) would grow to $5.8 trillion in 2031, while Bank Reserves would expand to $11.5 trillion. The appendix to this chapter explains the assumptions behind these estimates.
The increase in Bank Reserves is what interests us most here. That is because, since 2008, the Fed has paid interest on Bank Reserves. That interest expense reduces the Fed's profits and, therefore, its remittances to the Treasury Department. In the scenario discussed here, in 2031, Bank Reserves would be $8.3 trillion larger than they were in 2020 as the result of the money created by the Fed during the 11 intervening years.
Given the Fed's current operating procedures for controlling the federal funds rate, if the federal funds rate were above 0%, the Fed would have to pay interest to the commercial banks on the additional $8.3 trillion of Bank Reserves.
Therefore, even though the Fed would still return all the profits it earned on the interest income from its portfolio of government bonds and mortgage-backed securities to the Treasury Department, those profits would be reduced by the amount of interest the Fed would have to pay on the banks' reserves. Consequently, Fed financing of the $10 trillion investment program would not be cost-free. There would be a cost. That cost would be determined by the federal funds rate. For instance, if the federal funds rate were 1.0%, the Fed would have to pay the banks 1% on the additional $8.3 trillion of Bank Reserves that would exist in 2031 as the result of the Fed financing the investment program. That would amount to $83 billion per year. Of course, if the federal funds rate were 0%, then there would be no cost. On the other hand, if the federal funds rate moved up to 5%, then the cost would be $415 billion per year.
However, the Fed can and should avoid paying any interest on Bank Reserves by reverting to its traditional operating procedure. Instead of paying interest on Bank Reserves to control the federal funds rate, the Fed could raise the required reserve ratio as high as necessary to make reserves in the banking system scarce again, despite the additional $8.3 trillion of new Bank Reserves that would be created as the Fed acquires $12.1 trillion of new government bonds, and agency and GSE-backed securities, between the end of 2020 and the end of 2031.

CHART 20.9 Bank Reserves as a percentage of Bank Deposits, 1945 to 2031 est.
Source: Data from the Federal Reserve, incorporating the author’s projections
Chart 20.9 presents an estimate of the level of Bank Reserves relative to the size of the banking sector's customer deposits out to the end of 2031.7 It puts that increase in Bank Reserves into perspective by showing the ratio of reserves to total deposits for private depository institutions in the United States beginning in 1945.
The ratio of Bank Reserves to total liabilities was 13.1% in 1948. The Fed did not pay interest on Bank Reserves then. In 2013, that ratio hit 19.2%. The Fed paid less than 0.25% interest on Bank Reserves that year.
The ratio of Bank Reserves to total deposits will increase as the Fed monetizes the debt the government issues to finance the $10 trillion investment program. That ratio will rise from 16.7% in 2020 to 21.3% in 2031.
At its most recent Federal Open Market Committee meeting (June 15-16, 2021), the Fed indicated that it was unlikely to begin increasing the federal funds rate from its current near 0% lower bound to 0.25% until 2023. Therefore, the Fed is likely to pay only a very small amount of interest on Bank Reserves until, at least, 2023. However, before the Fed does begin to hike interest rates, it should revert to its traditional method of pushing rates higher by making excess Bank Reserves scarce. It could accomplish this by raising the required reserve ratio as high as necessary to absorb all excess Bank Reserves.
For instance, in 2023, the ratio of Bank Reserves to bank customer deposits is expected to be 19.5%, as shown in Chart 20.9. If the Fed decides to increase the federal funds rate that year, it should set the required reserve ratio of Bank Reserves to bank customer deposits at precisely 19.5%. Then banks would be legally required to hold that level of reserves. Therefore, there would be no excess reserves in the banking sector.
Over time, as the ratio of Bank Reserves to bank customer deposits changed, as in the projections shown in Chart 20.9, the Fed could adjust the required reserve ratio so that it would also be exactly the same level as the actual ratio of Bank Reserves to bank deposits. For instance, in 2024, the required reserve ratio could be reduced to 18.6% and then raised again to 19.3% in 2026, and so on. The large increase in the required reserve ratio is not without precedent. Between July 1936 and May 1937, the Fed doubled the required reserve ratio on demand deposits of central reserve city banks from 13% to 26%, as shown in Table 4.1 in Chapter 4.8
The much higher required reserve ratio would be, in effect, a windfall profits tax on the commercial banks. It would prevent them from profiting from the Fed financing the government's investment program, to which they had contributed nothing. There is no justification for the Fed paying interest to commercial banks on the Bank Reserves that the Fed had created, when the Fed could simply increase the required reserve ratio instead. The banks themselves would have done nothing to earn those reserves. They would not have obtained them as the result of making a successful loan to a small business in Kansas City, Missouri, for instance, nor from financing a multibillion-dollar merger in the tech industry, nor, even, from making a large successful bet on the direction of the price of pork bellies. Banks do not obtain reserves as the result of earning profits. Banks do not “earn” reserves. Bank Reserves are created by the Fed, entirely independently from any action taken or decision made by the banking sector.
Bank Reserves expand in only one way. They expand when the Fed makes a deposit into the reserve accounts that the commercial banks hold at the Fed. Therefore, there is absolutely no reason the Fed should pay interest on those reserves, thereby lowering its own profits and, consequently, reducing the remittances it hands over to the Treasury Department (i.e., US taxpayers) each year, while, in the process, boosting the earnings of the commercial banks directly in line with the amount of interest paid. Raising the required reserve ratio high enough to absorb all excess reserves in the banking sector would simply eliminate these unearned bank profits and place this money with the US taxpayers where it belongs.
Even if the Fed did increase the required reserve ratio as described above, it is very likely that the profitability of commercial banks would improve considerably, nevertheless, as the $10 trillion investment program supercharged economic growth. An additional benefit of this approach would be that a much higher level of Bank Reserves would also ensure that the banks would have more than enough reserves to withstand any future economic crisis. Then, rather than the banks being too big to fail, they would be too well reserved to fail.
With this approach, the Fed would not have to pay interest on the currency it issues or on the Bank Reserves it creates, as was the case before 2008. That would mean that the government would earn seigniorage not only on the currency it issues, but also on the Bank Reserves the Fed creates when it purchases government bonds, and agency and mortgage-backed securities.
Raising the required reserve ratio as high as necessary to absorb all the Bank Reserves created by the Fed would make all the debt issued by the government to fund the $10 trillion investment program cost-free debt. It would also make most of the debt issued by the government to fight the economic fallout from COVID-19 cost-free debt, while, at the same time, making all the debt the Fed acquired through its numerous rounds of Quantitative Easing between the crisis of 2008 and the beginning of the pandemic cost-free debt. Reverting to the Fed's traditional method of controlling the federal funds rate by keeping Bank Reserves scarce would boost the Fed's profits by hundreds of billions of dollars during the decades ahead and make it possible for the US government to finance a transformative $10 trillion investment program over the next 10 years at no cost whatsoever to US taxpayers.
Before us is a once-in-history opportunity for the US government to invest in new industries and technologies on an enormous scale at essentially no cost. The deflationary forces of globalization, in combination with the ability of central banks to create money without gold backing, makes this possible. It is an opportunity that we must not let slip past us.
What Could the Negative Consequences Be?
In the worst-case scenario outlined above, by 2031, the ratio of government debt to GDP would rise to 151% and the Fed would create $12.1 trillion between 2020 and 2031 to help finance the increase in government debt at low interest rates.
What are the negative consequences that could result from such a large increase in government debt and Federal Reserve Credit? Three possibilities immediately jump to mind:
The following paragraphs will discuss – and dismiss – each of those concerns in turn.
Consumer Price Inflation
The surge in government debt during World War II caused high rates of consumer price inflation, which the government attempted to restrain through price controls. At the beginning of the war, the phenomenal increase in government spending to manufacture war materials and to carry out the war pulled the United States out of the Great Depression and quickly led to full employment and full industrial capacity utilization. Consequently, the economy overheated and wages and prices rose. In other words, the war generated an inflationary demand shock. That wartime experience is discussed in Chapter 15.
The early months of the COVID-19 pandemic produced a set of circumstances nearly opposite to those of World War II. The countrywide lockdown prevented consumers from spending and businesses from investing. Unemployment surged to Depression Era levels. Demand collapsed. As it did, prices fell. In March 2020, consumer price inflation fell 0.3% compared with one month earlier. In April and May, CPI fell a further 0.7% and 0.1% month-on-month, respectively. During those months the United States experienced a deflationary demand shock (see Chart 20.10).
During June 2020, the relaxation of lockdowns, combined with enhanced purchasing power resulting from the $2 trillion CARES Act, which had been signed into law on March 27, brought about a rebound in spending that pushed prices 0.5% higher compared with May. From July to October 2020, price pressures moderated, as the purchasing power from the CARES Act dissipated.
A new $900 billion stimulus bill was enacted in December, followed by the American Rescue Plan Act in March, which pumped $1.9 trillion more into the economy. Enhanced purchasing power stemming from the December and March stimulus bills fueled demand during the first half of 2021, just as COVID-induced supply bottlenecks began to disrupt supply chains around the world, leading to shortages of many goods.

CHART 20.10 Consumer Price Inflation, Monthly Percentage Change, January 2018 to June 2021
Source: Data from the Federal Reserve Bank of St. Louis
The combination of increased demand with curtailed supply pushed prices higher. Between March and June 2021 the month-on-month increase in consumer prices ranged from 0.6% and 0.9%.
By June, the year-on-year increase in CPI had risen to 5.4%, the highest since 2008. This was above the Fed's inflation target of an average of 2% over the long run. However, the high year-on-year increase in inflation was due in large part to a base effect, since prices had fallen between March and May 2020. For instance, the price level in June 2021 was only 6.0% higher than it was in June 2019, meaning that prices had risen by a significantly less worrying rate of 3.0% a year on average over those two years.
At the time of writing, it appears likely that inflationary pressures will abate during the second half of 2021 and into 2022. No further stimulus bills are expected. That suggests that demand will weaken once consumers have exhausted the relief money they received from the government during the first months of 2021.
Moreover, the supply bottlenecks that helped push prices higher during the first half of 2021 are likely to be overcome during the quarters ahead. As they are, price pressures are likely to lessen. For example, during the first half of 2021, a shortage of semiconductors disrupted the production of new cars and trucks. That led to a 40% year-on-year jump in the price of used cars and trucks during that period. That surge in used car prices accounted for nearly a third of the month-on-month rise in CPI during the second quarter of 2021.
When semiconductor supply bottlenecks are overcome and the production of new cars returns to normal, the price of used cars and trucks is very likely to fall sharply. That deflation in used car prices will offset a significant part of any remaining inflationary pressure that persists into 2022.
Therefore, with demand likely to weaken just as supply recovers, inflation should be substantially lower in 2022 than in 2021. In other words, the inflation of mid-2021 is likely to prove to be transitory, just as the Fed has said that it would be.
But what impact would a 10-year, Fed-financed, multitrillion-dollar investment program have on prices?
Assuming that a $10 trillion investment program is adopted and phased in gradually as discussed in Chapter 19, its impact on inflation would likely be modest. Even in 2031, when the investment program is at its peak, at $1.7 trillion, that would still produce only a 6.8% increase in government debt that year (under unrealistically pessimistic assumptions that ignore the positive impact that increased investment would have on tax revenues). That increase in government debt would be only 36% as large as the 18.7% jump in government debt during 2020 relative to 2019.
Assuming that the Fed created enough money to finance all of the investment program, the Fed's total assets would increase by 9.4% in 2031 compared with 2030. The consequences of that should be modest given that the Fed's total assets soared by 76% in 2020 vs. 2019.
These comparisons suggest a 10-year, $10 trillion investment program could be carried out without causing high rates of inflation.
Altogether, during the 11 years between 2020 and 2031, government debt would increase by 89% and the Fed's total assets would expand by 164%. Compare that with developments following the crisis of 2008. During the seven years between 2007 and 2014, government debt increased by 98% from $9.0 trillion to $17.8 trillion9; and the Fed's total assets expanded nearly fivefold, from $915 billion to $4.5 trillion. And, yet, there was no significant spike in inflation then. The Consumer Price Index peaked at just 3.9% in 2011 and then fell back below 0% in early 2015. The Core Consumer Price Index, which excludes food and energy, never rose as high as 2.4%. In fact, between the crisis of 2008 and the start of the pandemic, the Fed struggled to prevent deflation. Policymakers would have welcomed higher inflation, since the economic damage caused by deflation is far greater than the damage caused by inflation.
There was very little inflation following the crisis of 2008 because the deflationary pressures stemming from globalization outweighed the inflationary pressures that would have been expected to arise from such a large increase in government debt and such a large increase in the monetary base. This subject was discussed in greater detail in Chapter 15.
Therefore, so long as globalization survives, a jump in government debt and in the Fed's total assets resulting from a large investment program would be unlikely to cause a worrying rise in US consumer price inflation. However, as mentioned in Chapter 16, if the large-scale investment program did begin to push inflation to undesirably high levels at any time, the investment program could be slowed down until the supply bottlenecks responsible for the inflation had been overcome. Then the investment program could reaccelerate.
Asset Price Inflation and Rising Income Inequality
Asset price inflation leading to greater income inequality is probably a greater risk than the return of persistently high rates of consumer price inflation. Following the crisis of 2008, the fivefold expansion of Federal Reserve Credit, combined with very low interest rates, drove up stock prices and property prices to such an extent that household sector net worth practically doubled between 2009 and 2019. Those who owned stocks and property became much richer, while those who did not were left far behind.
The policy response to the pandemic has produced a similar outcome. The S&P 500 Index bottomed on March 23 when the Fed announced “QE Infinity.” By the end of August, it had recovered all of its losses and began to set new highs. The new money that the Fed would create to finance the investment program between 2022 and 2031 is likely to continue driving asset prices higher. Should that occur, income inequality could become more extreme.
Great income inequality is undesirable because it undermines democracy. Therefore, if the investment program threatens to exacerbate it, legislative action should be brought to bear to reverse it. Significantly higher tax rates could be imposed on the highest income brackets; and capital gains exceeding $1 million, for instance, could be taxed at significantly higher rates. Inheritance taxes on estates above $50 million dollars could also be raised enough to prevent income inequality from worsening. The wealthiest Americans would have no grounds to object to paying higher taxes on the additional wealth they accumulated as the direct result of government policy, additional wealth that was entirely unconnected to any effort made on their part.
Therefore, while the surge in government debt and money creation necessitated by the urgent need to invest in the Industries of the Future may continue to push asset prices higher, the new wealth created by that investment need not be allowed to threaten democracy in America. It can be taxed, with the tax revenues being used to invest in new industries and technologies; investments that would improve the well-being of every American.
A Threat to the Dollar Standard?
There simply is no alternative to the dollar standard, nor will there be any time within the foreseeable future.
First of all, all the other major central banks in the world are creating enormous amounts of their currencies in response to the pandemic, just as the Federal Reserve is. In fact, some were doing so even before the pandemic began. The Bank of Japan was the pioneer of Quantitative Easing and it has been conducting QE for decades. As of March 31, 2021, the BOJ's assets amounted to 131% of Japan's GDP. The European Central Bank total assets amounted to 62% of the Euro Area's GDP at the end of 2020, while the People's Bank of China’s total assets equaled 38% of China's GDP.
The ratio of the Fed's total assets to US GDP was 35.6% at the end of June 2021. This is likely to increase during the second half of the year due to the ongoing policy response to COVID-19. But the same is likely to be true for all the other major central banks in the world. The ratio of their total assets to GDP will rise for the same reason. So, on a relative basis, the policy response to this pandemic will leave the US dollar no less attractive than it was at the end of 2019.
Once the investment program is underway, it is more likely to strengthen the position of the dollar rather than to weaken it, given the extraordinary enhancement to the US economy that it would bring about.
The US dollar emerged as the principal international reserve currency in the aftermath of World War II because the United States had won the war and held most of the world's gold. However, the dollar has remained the principal international reserve currency during the half century since money ceased to be backed by gold because the United States' enormous annual trade deficits have flooded the world with dollars.
For example, between 2014 and 2018, China's trade surplus with the United States averaged approximately $1 billion per day.10 Chinese companies sold their goods in the United States. They were paid in US dollars. Once China had the dollars, it had to invest them in US dollar-denominated assets, like US government securities. Consequently, China's stockpile of dollars grew by more than $1 billion a day.
China could have exchanged some of those dollars into some other currency, euros, for instance. However, whomever China bought the euros from would then have owned the dollars and they would have had to invest them in US dollar-denominated securities. Dollars are like farmland. When a farmer sells the farmland, it does not disappear. Someone else owns it. The same is true for dollars.
Therefore, the gigantic pool of dollars that currently exists in the world is going to continue to circulate around the globe for generations to come. Moreover, as long as the United States continues to have a large trade deficit every year, that stockpile will become larger and larger. And, all those dollars will have to be invested in US dollar-denominated assets if they are going to generate any investment income.
The Chinese yuan is not going to replace the dollar as the preeminent international reserve currency. There are relatively few Chinese yuan circulating in the world because China always has a very large trade surplus. It never has a trade deficit that throws yuan out into the global economy in the way that the US trade deficit throws dollars into the global economy every hour of every day. That is not going to change. Nor does the currency of any other country pose a threat to US dollar hegemony for the same reasons.
There will never be a return to a gold standard unless civilization collapses and we return to a Mad Max world in which trade can only be conducted through barter. Our civilization is built on credit. There is $84.6 trillion of US dollar-denominated credit in the United States alone as of mid-2021. That credit structure would completely collapse if anything remotely resembling a return to the gold standard were attempted. All around the world, that reality is understood by every single policymaker holding any position of influence. There is no going back to a gold standard.
As for Bitcoin, its value lies primarily in its usefulness in allowing wealthy individuals to move large sums of money around the world illegally, in the (mistaken) belief that their Bitcoin transactions are going undetected by national and international authorities. The authorities are watching; and those individuals who use Bitcoin for this purpose who lack sufficient political influence are likely to eventually be brought to account. If the Bitcoin mania were to become too widespread among the general public, it would be outlawed. No one should doubt the power of the US government to put an end to the possession and trading of Bitcoin by any American (and for that matter, by most other nationalities) anywhere in the world. The government arrests people who counterfeit money, just as it arrests Americans who don't pay their taxes, regardless of where in the world they live. Bitcoin is certainly no threat to the dollar, nor will it ever be.
Therefore, the very large expansion of US government debt and of Federal Reserve Credit that would be required to fund a multitrillion-dollar investment program would not undermine the dollar or the dollar standard.
Appendix
The Assumptions Underlying the Projections
The projections discussed in this chapter and depicted in its charts are not intended to be precise forecasts, but merely very rough estimates of possible outcomes under a specific set of assumptions. They involve far too many variables, as the future always does, to forecast with any great degree of certainty. Nevertheless, it is hoped that they are useful in enabling the reader to imagine how the Fed's total assets, the composition of the Fed's balance sheet and the ratio of Bank Reserves to customer deposits could evolve in the scenario outlined in this chapter, in order to demonstrate how the proposed investment program could be financed by the Fed at no cost to US taxpayers.
The following paragraphs discuss the most important assumptions that have been incorporated into these projections.
First, it is assumed that the Fed's total assets would increase by $12.1 trillion between 2020 and 2031 for the reasons described above.
Next, Chart 20.8, which projects the evolution of the four major items on the Fed's balance sheet out to 2031, requires assumptions concerning the kind of assets the Fed would acquire and, most importantly, how much currency would expand each year out to 2031.
Regarding the assets the Fed would acquire, during the second half of 2021 and until Quantitative Easing ends in late 2022, it is assumed that the Fed would continue to acquire twice as many Treasury securities as mortgage-backed securities, as it has been doing since the second quarter of 2020. From 2023 to 2031, it is assumed the Fed would acquire only Treasury bonds. That would take the Fed's holdings for Treasury securities up from $4.7 trillion in 2020 to $16.1 trillion in 2031, an increase of $11.4 trillion. Meanwhile, the Fed's holdings of agency and GSE-backed securities would increase from $2.0 trillion in 2020 to $2.8 trillion in 2022 (an increase of $720 billion over two years), from which point they would remain stable out to 2031. Adding the Fed's holdings of Treasury securities together with its holdings of agency and GSE-backed securities, the Fed's total assets would increase by $12.1 trillion, from $7.4 trillion in 2020 to $19.5 trillion in 2031. Since money is fungible, it does not matter that part ($720 billion) of the $12.1 trillion the Fed would create would be used to buy agency and GSE-backed securities instead of all $12.1 trillion being used to buy Treasury securities, because the $720 billion that would be spent to acquire the agency and GSE-backed securities would still find its way into Treasury securities.
The more consequential question is: How much would currency in circulation expand between 2020 and 2031? That question is more important for this inquiry because, as currency expands, it absorbs Bank Reserves. We are interested in how large Bank Reserves will become because, under the Fed's current process for controlling the federal funds rate, the Fed must pay interest on Bank Reserves. Therefore, the growth in currency affects the quantity of Bank Reserves and the quantity of Bank Reserves affects the size of the Fed's profits and, therefore, the Fed's remittances to the Treasury.
Between 1971 and 2019, US currency in circulation expanded by 7.5% a year on average. However, during the extraordinary circumstances surrounding the COVID-19 pandemic, currency expanded by 16% during 2020. The large increase in currency outstanding during this period seems to have been caused both by the large increase in the amount of dollars created by the Fed and by the public's desire to hold more cash during this period of crisis and uncertainty. It is very difficult to estimate with any degree of certainty what the demand for cash will be going forward. Here, in light of the extraordinary amount of money the Fed is expected to create by 2031 in this scenario, it is assumed that currency in circulation will expand by 10% every year between 2021 and 2031.
In that case, currency in circulation would reach $5.8 trillion in 2031, an increase of $3.8 from 2020. The increase in currency would absorb Bank Reserves as it expands. Therefore, Bank Reserves would not grow exactly in line with the $12.1 trillion increase in the Fed's total assets (even though the Fed would deposit money into the banks' reserve accounts at the Fed when it acquires the additional Treasury securities and agency and GSE-backed securities). Instead, Bank Reserves would expand by $8.3 trillion (i.e., $12.1 trillion less the $3.8 trillion expansion of currency in circulation).
Finally, Chart 20.9, which projects the ratio of Bank Reserves to bank customers' deposits, requires one additional assumption concerning the annual growth rate of customer deposits at banks.
Between 1971 and 2019, deposits by the banks' customers increased by an average of 6.7% a year. However, during 2020, they jumped by 21.4% compared with the end of 2019. This 2020 surge in deposits resulted from the stimulus associated with a $4.5 trillion increase in government debt that year,11 combined with money creation of $3.2 trillion by the Fed. Again, it is very difficult to project with any degree of certainty the annual growth rate of deposits out to 2031. However, given the large increase in government borrowing and the large increase in the amount of money that the Fed would create in this scenario, here it has been assumed that deposits will increase by an average annual rate of 10% a year between 2021 and 2031.
One of the main purposes of making all the projections discussed above is to estimate how high the required reserve ratio would have to be raised in order to make Bank Reserves scarce enough so that the Fed would no longer have to pay interest on Bank Reserves to control the federal funds rate – even after the Fed created an extraordinary amount of Bank Reserves as it acquired government bonds to finance the proposed $10 trillion investment program.
A large number of variables and an even larger number of assumptions concerning those variables are involved in reaching the projections shown in Chart 20.9. For instance, if the Fed creates less than $12.1 trillion, all the variables discussed here would change. If currency grows by less than 10% a year, then the level of Bank Reserves and the ratio of Bank Reserves to deposits would both be higher than projected. Similarly, if customer deposits grow by less than 10% a year, then the ratio of Bank Reserves to deposits would be higher than projected.
However, none of these uncertainties undermines the main argument being presented here. No matter how high the ratio of Bank Reserves to customer deposits climbs, the required reserve ratio could be increased to WHATEVER LEVEL IS REQUIRED to absorb ALL excess Bank Reserves until Bank Reserves are once again made scarce, thereby allowing the Fed to control the federal funds rate without paying interest on Bank Reserves, just as it did up until 2008.
Raising the required reserve ratio to that requisite level would enable the Fed to avoid paying interest on Bank Reserves, making it possible for the Fed to create money and finance the entire cost of the proposed investment program in a way that would cost US taxpayers nothing whatsoever.
Notes
1. Stephanie Kelton, The Deficit Myth, p. 207. PublicAffairs, New York, 2021
2. Apple's 2020 Form 10-Filing, p. 19 United States Securities and Exchange Commission. https://s2.q4cdn.com/470004039/files/doc_financials/2020/ar/_10-K-2020-(As-Filed).pdf
3. The Treasury Department ultimately reaps the benefits of seigniorage because the Fed pays the Treasury all the profits it earns through this process.
4. Reverse repos and deposits in the Treasury's General Account at the Fed are not shown in these charts.
5. Technically, the Eurosystem's total assets to Euro Area GDP.
6. Weekly Financial Statements of the Eurosystem, European Central Bank, reproduced by St. Louis Fed. https://fred.stlouisfed.org/series/ECBASSETSW#0
7. The key assumption here involves the growth rate of the banks' customer deposits. The assumptions behind these projections are also discussed in the appendix to this chapter.
8. 1936 Annual Report of the Board of Governors of the Federal Reserve System, p. 11.
9. Office of Management and Budget, Historical Tables. Table 7.1 – Federal Debt at the End of Year: 1940–2026, The White House. https://www.whitehouse.gov/omb/historical-tables/
10. US Trade in Goods by Country US Census Bureau, Foreign Trade. https://www.census.gov/foreign-trade/balance/c5700.html
11. Debt to the Penny, TreasuryDirect. https://treasurydirect.gov/govt/reports/pd/debttothepenny.htm