
CHAPTER 2
The Federal Reserve system has been of incalculable value during this period of war financing on the most extensive scale ever undertaken by any nation in the history of the world. It would have been impossible to carry through these unprecedented financing operations under our old banking system.
Treasury Secretary William Gibbs McAdoo1
World War I erupted in August 1914, three months before the Fed became operational in November 1914. Consequently, the new institution began its existence under conditions radically different from those imagined by its founders. The Federal Reserve Act had structured the Fed to be a relatively passive lender of last resort. It was designed to expand the currency when the public required more cash and to extend short-term loans to member banks when they asked to borrow. The war forced the Fed to take on a much more active role. This chapter describes how the Fed played an invaluable part in financing the debt the United States government had to issue to pay for the war. It also shows how the Fed was transformed in the process.
The Balance Sheet
World War I caused an extraordinary change in the size and composition of the Fed's balance sheet.
The Fed's total assets increased from $250 million at the end of 1914 to $6 billion at the end of 1920, as shown in Chart 2.1.
Chart 2.2 shows how the balance sheet evolved during those six years. Only the largest and most significant items are shown.
Assets are shown as positive numbers. Liabilities are shown as negative numbers. As with all balance sheets, total assets equal total liabilities. A change in the size of one side of the balance sheet is always accompanied by a change on the other side of the balance sheet of exactly the same amount.
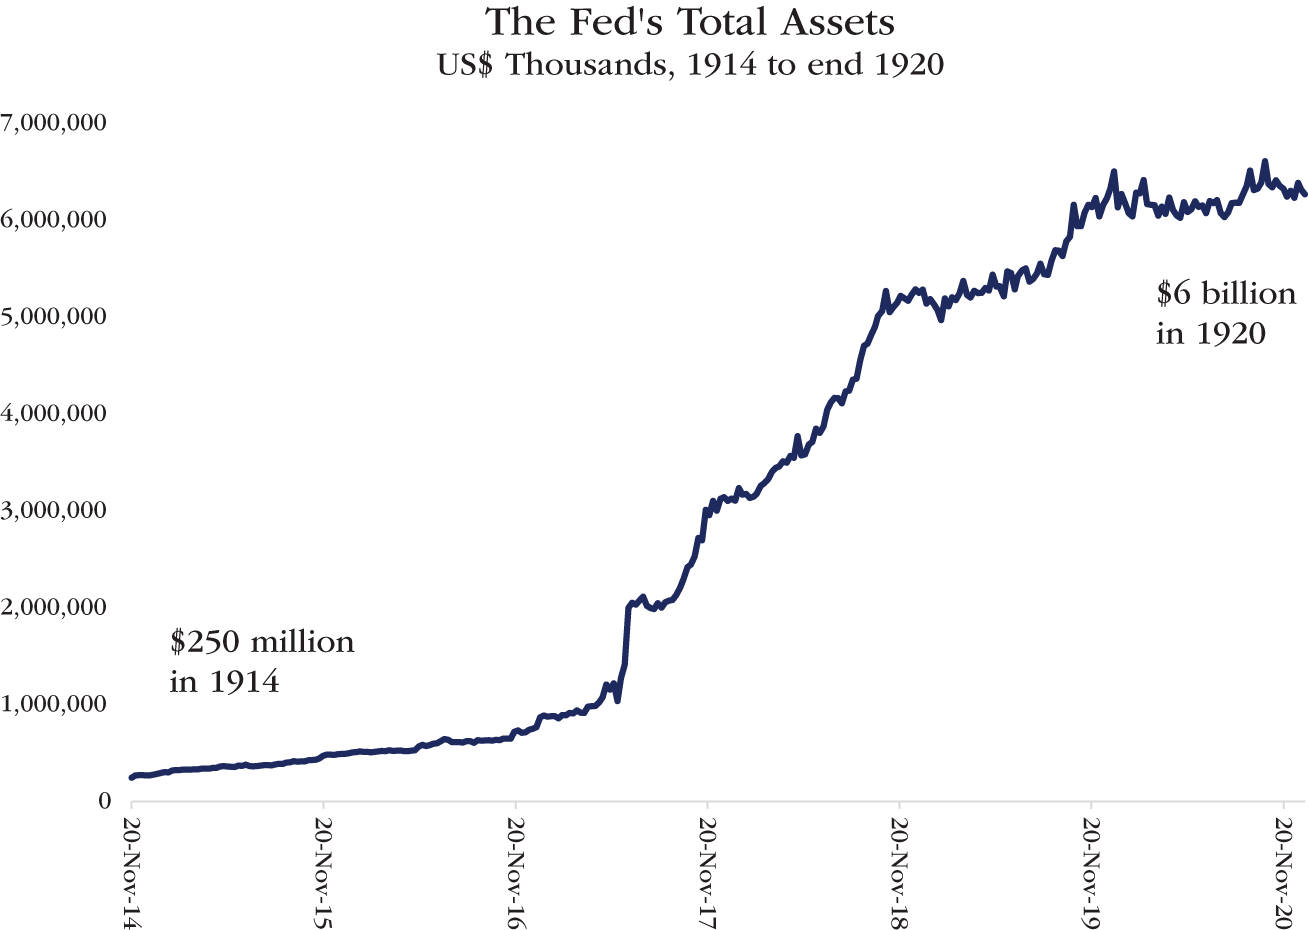
CHART 2.1 The Fed's Total Assets, 1914 to 1920
Source: Data from “The Federal Reserve System’s Weekly Balance Sheet Since 1914” and accompanying spreadsheet. John Hopkins University, SAE/No.115/July 2018. See Bibliography.

CHART 2.2 A Breakdown of the Fed's Major Assets and Liabilities, 1914 to 1920
Source: Data from “The Federal Reserve System’s Weekly Balance Sheet Since 1914” and accompanying spreadsheet. Johns Hopkins University, SAE/No.115/July 2018. See Bibliography.
Assets
On the asset side, the growth in the Fed's holdings of gold and bills discounted stand out. During the two years and seven months between the beginning of the war in August 1914 and the United States' entry into the war in April 1917, American companies made very large profits selling commodities, supplies, and weapons to England, her allies and to non-belligerent nations. They were paid with gold. (England's naval blockade severely restricted direct US sales to Germany and her allies.) The gold stock of the United States increased by 82% during those 32 months, from $1,566 million to $2,850 million.
When the companies earning those profits deposited their gold into their US bank accounts, their banks had to increase the amount of reserves (i.e., gold or legal tender) they were required to hold on deposit at the Fed to meet their minimum reserve requirements. Consequently, the level of gold held by the Fed increased sharply as a result of World War I. Between November 20, 1914 (the Fed's first balance sheet), and June 15, 1917, the Fed's gold holdings increased from $205 million to $591 million, 188%.
Then, in June 1917, the Fed's gold holdings roughly doubled. Up until then, member banks had been permitted to hold part of their reserves as vault cash or as deposits in commercial banks in the larger financial centers, known as reserve cities and central reserve cities. However, beginning in June 1917, member banks were required to hold all of their reserves with their Federal Reserve banks. The transfer of their reserves to the Fed explains the large increase in the Fed's gold holdings that month.2
After the United States entered the war in 1917, the large inflows of gold into the US stopped. Rather than forcing its allies to pay gold for the war materials they bought from the United States, the US government allowed them to finance their purchases with credit. Nevertheless, the amount of gold held by the Fed continued to expand. During the war, bank credit expanded rapidly in the United States. When the commercial banks made loans, that caused the deposits in the banking system to expand as well. Commercial banks therefore were required to continue increasing their reserves against their customers' deposits by adding gold to their reserve accounts at the Fed. The Fed's gold holding increased from $1,295 million on July 29, 1917, to $2,065 million on November 29, 1918, by which time the Fed held 72% of the stock of gold in the United States.
When the United States entered the war, the Fed was compelled to take on a completely different role than that which had originally been envisioned for it. The Fed had been created to serve as a lender of last resort to prevent the recurrence of panics in the banking sector. When the United States entered the war, the Fed's responsibilities changed. Its principal responsibility became to ensure that the US government could borrow as much money as it required to fight and win the war.
To fulfill that duty, the Fed put in place an interest rate structure that guaranteed a profit to member banks when they acquired government bonds. To do that, the Fed announced that it would discount bills that were backed with government securities as collateral at an interest rate that was 1/2% to 1% below the rate of interest offered on government securities. In practice, that meant that a member bank could buy a government Liberty Bond paying 4% interest when it was first sold by the government; and then offer that bond as collateral to the Fed in exchange for a loan that cost the member bank 3.5% interest. The member bank could then take the money that it had received from the Fed as a loan and buy a new government Liberty Bond paying 4% interest, thereby locking in a profit of 1/2 of 1% on every dollar it invested in government bonds.
With both patriotism and profitability in mind, commercial banks were quick to take advantage of this opportunity to earn a guaranteed return. Their holdings of government securities increased from $733 million at the end of 1916 to $5.8 billion at the end of 1919. The jump in the banks' holdings of government securities is shown in Chart 2.3. The banks' holdings of government securities increased by $600 million in 1917, $1.9 billion in 1918 and $2.2 billion in 1919.
The amount of money the banks borrowed from the Fed is reflected on the Fed's balance sheet in the growth in “bills discounted,” which increased from just $50 million in June 1917 to a peak of nearly $2.8 billion in November 1920, as shown in Chart 2.2.
The Fed also bought government securities for its own account to help finance the war. At the peak, in October 1918, the Fed owned $350 million of government securities.
When the Fed lent money to member banks, it did so by making deposits into the reserve accounts that those member banks held at the Fed. And when the Fed purchased government securities for its own account, it acquired them from member banks and paid for them by making deposits into the reserve accounts those banks held at the Fed. As discussed in Chapter 1, when the Fed deposits money into a member bank's reserve account at the Fed, it is not depositing money that already exists. Instead, it is paying with credit, Federal Reserve Credit, that is created through the act of making the deposit.

CHART 2.3 All Banks' Investments in US Government Obligations, Annual $ Change, 1897 to 1920
Source: Data from Historical Statistics of the United States: From Colonial Times to 1957, Chapter 10, Banking and Finance, US Census Bureau
Federal Reserve Credit extended by the Fed increased by just $142 million in 1916. In 1917, it rose by $850 million, in 1918 by $1.4 billion, and in 1919 by $794 million more, as can be seen in Chart 2.4.
Total Federal Reserve Credit outstanding soared from $226 million in April 1917, when the US entered the war, to $3.2 billion in January 1920. Chart 2.5. shows the growth in Federal Reserve Credit between 1914 and 1920, as well as the types of assets the Fed acquired through the process of extending that credit.

CHART 2.4 Federal Reserve Credit, Annual $ Change, 1915 to 1920
Source: Data for 1914 to 1917 from “The Federal Reserve System’s Weekly Balance Sheet Since 1914” and accompanying spreadsheet. Johns Hopkins University, SAE/No.115/July 2018. See Bibliography.
Data for 1918 to 1920 from The Fed’s 2017 Annual Report, page 306
The top (dark gray) line shows the growth in total Federal Reserve Credit from 1914 to 1920. The remining three lines represent the assets the Fed obtained by extending that credit. It can be seen that most of the Federal Reserve Credit that was created was used to make loans to member banks through discounting paper backed by government securities. That is reflected in the black line representing “Bills Discounted.” The rest of the Federal Reserve Credit that was created was used to acquire commercial paper (shown as “Bills Bought” in the light gray line) and to acquire government securities (for the Fed's own account), represented by the medium gray line.
As mentioned above, the Fed's assets are comprised primarily of gold and the items acquired through the extension of Federal Reserve Credit. Chart 2.6 shows how the mix between those two types of assets changed between 1914 and 1920.
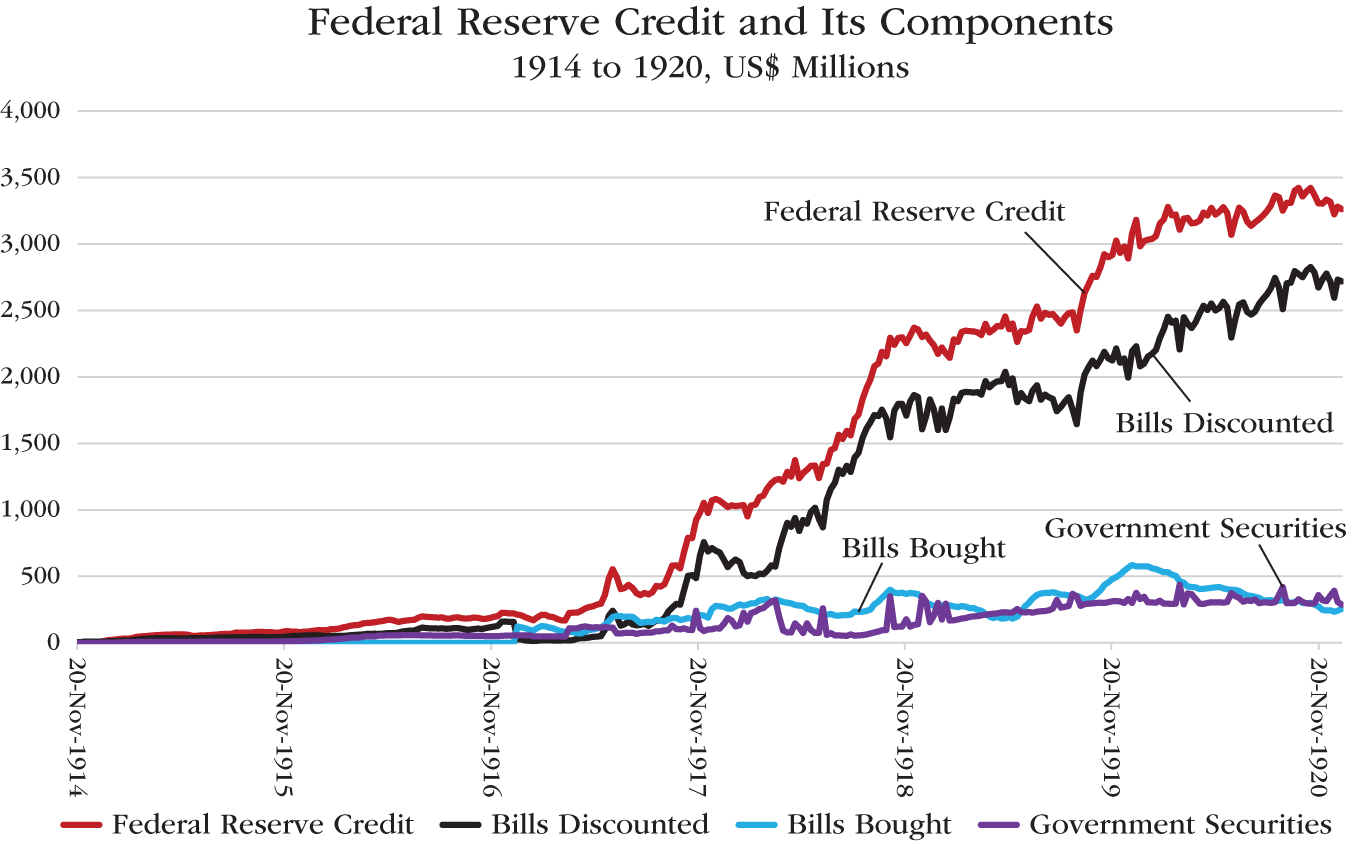
CHART 2.5 Federal Reserve Credit and Its Components, 1914 to 1920
Source: Data from “The Federal Reserve System’s Weekly Balance Sheet Since 1914” and accompanying spreadsheet. John Hopkins University, SAE/No.115/July 2018. See Bibliography.
The top light gray line represents the Fed's total assets. The dotted line represents the Fed's gold holdings. The dark gray line shows the Fed's assets acquired through the extension of Federal Reserve Credit. Initially, gold made up nearly all of the Fed's assets. However, once the United States entered the war, the assets it acquired through the extension of Federal Reserve Credit began to grow rapidly, until, in September 1918, they accounted for a larger share of the Fed's total assets than gold. In other words, at that point, assets acquired with Federal Reserve Credit overtook gold as the largest item on the asset side of the Fed's balance sheet.
Liabilities
Finally, consider the changes in the Fed's liabilities during these years. These can be seen in Chart 2.2. Gold inflows and the extension of Federal Reserve Credit are accompanied by a corresponding increase in member bank reserves on the liabilities side of the Fed's balance sheet. During this period, when gold entered the US, it was deposited into commercial banks. As their deposits grew, those banks were required to deposit more gold at the Fed as reserves against their deposits. Those deposits caused the Fed's gold holdings to expand on the asset side of its balance sheet and its reserve liabilities to increase on the liabilities side of its balance sheet. The extension of Federal Reserve Credit also caused Bank Reserves to expand, since the credit was extended through the act of the Fed making deposits into the member banks' reserve accounts at the Fed.

CHART 2.6 The Fed's Total Assets: Gold vs. Assets Acquired with Federal Reserve Credit, 1914 to 1920
Source: Data from “The Federal Reserve System’s Weekly Balance Sheet Since 1914” and accompanying spreadsheet. Johns Hopkins University, SAE/No.115/July 2018. See Bibliography.
Chart 2.2 also shows that Bank Reserves (represented by the dark gray line) did grow during these years. However, they did not increase as much as would have been expected given the increase in the Fed's gold holdings combined with the increase in Federal Reserve Credit. That is because the demand for cash increased very sharply during the war. As the public withdrew cash from their commercial banks, those banks obtained more currency in the form of Federal Reserve Notes from the Fed, causing the central bank's Federal Reserve Note liabilities to expand rapidly (as shown in the dashed line). In exchange for giving the commercial banks cash, the Fed debited the reserve accounts the banks held at the Fed. Therefore, growth in Bank Reserves was largely offset by the increase in Federal Reserve Notes in circulation.
Next, consider the impact that the growth in the Fed's assets and liabilities had on its gold coverage ratio. Recall that the Fed was required to hold an amount of gold equivalent to at least 40% of the Federal Reserve Notes it issued and also to hold gold equivalent to at least 35% of the reserves that member banks held in their reserve accounts at the Fed. When the Fed opened its doors in November 1914, it held an amount of gold equivalent to 105% of its note and deposit liabilities. However, by May 1920, that ratio had fallen to just 42.6% as the result of the huge expansion of Federal Reserve Notes and Bank Reserves that had occurred during the preceding five and a half years. That was uncomfortably close to the statutory limit. This plunge in the Fed's gold coverage ratio is shown in Chart 2.7.
To summarize then, between 1914 and 1917, the large gold inflows into the United States caused a large expansion of the Fed's assets and liabilities. No new operating procedure was required. As customer deposits at commercial banks expanded, the liquidity reserves that the member banks were required to hold in their reserve accounts at the Fed naturally grew. That was how the Fed was designed to work. Although the Fed's balance sheet grew rapidly during that period, the Fed did not undertake any action to bring about that outcome. It was passive.
When the United States entered the war, however, the Fed adopted new procedures that enabled it to help finance the war at low interest rates. It created as much Federal Reserve Credit as necessary to enable the commercial banks to satisfy the government's funding requirements. If the Fed had not existed in 1917, it would have had to be created to serve that purpose. Wars require extraordinarily large amounts of money; money that governments must obtain through taxes and borrowing. The Fed put in place an interest rate structure that ensured the government could borrow as much credit as it needed to fight the war.

CHART 2.7 Gold Coverage Ratio: Ratio of the Fed’s Gold Reserves to Its Note and Deposit Liabilities, 1914 to 1920
Source: Data from Ratio of Reserves to Note and Deposit Liabilities, Federal Reserve Banks for United States, St. Louis Fed., 1914 to 1920
The Fed extended Federal Reserve Credit to the commercial banks, which enabled the banks to purchase government bonds for their own account. That Federal Reserve Credit also allowed the banks to extend additional loans to their customers, enabling them to buy government bonds and also to finance private sector investment in the plant and equipment needed for the war effort. Chart 2.8 shows there was a marked increase in the annual growth of the banks' other loans and investments (excluding their investments in government securities) from 1916 to 1920.
If the Fed had not increased the availability of credit by extending Federal Reserve Credit, government demand for loans would have pushed up interest rates to extraordinarily high levels. That, in turn, would have wrecked the economy and made it much more difficult for the United States to successfully conduct the war.

CHART 2.8 All Banks: Loans & Investments Other Than Investments in Government Securities, Annual $ Change, 1897 to 1920
Source: Data from Historical Statistics of the United States: From Colonial Times to 1957, Chapter 10, Banking and Finance, US Census Bureau
The preceding paragraphs explain why and how the Fed's total assets increased 2,300%, from $250 million to $6 billion, during the first six years of its existence.
Notes
1. Treasury Secretary William Gibbs McAdoo, The Annual Report of the Secretary of the Treasury on the State of the Finances for the Fiscal Year Ending June 30, 1917, p. 22.
2. The Fed's 1916 Annual Report, p. 23, and the Fed's 1917 Annual Report, p. 12.