MANY OF THE DATA in this book have come from survey research, and most of the analyses cited have been based on findings from survey research. For more than seventy years, the data from the American National Election Studies (ANES), as well as from other major survey projects in political science, have been available through the Inter-university Consortium for Political and Social Research and have formed the basis for countless research projects in many fields by scholars, graduate students, and undergraduates. Given this widespread use of survey data, it is appropriate to give some description of the data-collection methods that underlie them.
During the past eighty years, social scientists have developed an impressive array of techniques for discovering and measuring individual attitudes and behavior. Basically, survey research relies on giving a standard questionnaire to the individuals to be studied. In most major studies of the national electorate over the years, trained interviewers ask the questions and record the responses in a face-to-face interview with each respondent. A few studies depend on the respondents themselves filling out the questionnaires. Recently, the rising costs of survey research, the pressure for quick results, and the availability of random-digit telephone dialing have led both commercial and academic pollsters to rely increasingly on telephone interviewing. The ANES used both face-to-face and telephone interviewing in 2000 but returned to using face-to-face interviews exclusively in 2004 and 2008. Beginning in 2012 and continuing in 2016, the ANES used face-to-face interviews but also had a sample of respondents answer the survey on the web. Due to COVID-19 in 2020, the ANES used a combination of web, phone, and video to administer the surveys. Web-based surveys are increasingly common, with organizations having respondents fill out questionnaires on a survey organization’s website. Also, for several decades, news organizations have conducted exit polls on Election Day to give an early estimate of the outcome and gather additional information about voters that election statistics do not provide.
SURVEY DATA COLLECTION
We describe four data-collection phases in the survey research process, noting the ways these steps vary depending on whether the surveys are face-to-face, telephone, internet, or an exit poll. The four phases are sampling, questionnaire constructing, interviewing, and coding.
Sampling
The key to survey research is probability sampling. It may seem inappropriate to analyze the entire American electorate using studies composed of fewer than two thousand individuals, which is about the average number of respondents in the studies used in this book. But it would be prohibitively expensive to interview the entire electorate, and the only way to study public opinion nationally is by interviewing relatively few individuals who accurately represent the entire electorate. Probability sampling is the method used to ensure that the individuals selected for interviewing will be representative of the total population. Probability sampling attempts to select respondents in such a way that every individual in the population has an equal chance of being selected for interviewing. If the respondents are selected in this way, the analyst can be confident that the characteristics of the sample are approximately the same as those of the whole population.
It would be impossible to make a list of every adult in the United States and then draw names from the list randomly. All survey organizations depart from such strict random procedures in some way. The ANES surveys, the General Social Survey (GSS), and other high-quality surveys using face-to-face interviews employ stratified cluster samples, based on households.
Stratification means that random selection occurs within subpopulations. In the United States, the sample is customarily selected within regions to guarantee that all sections are represented and within communities of different sizes as well. Clustering means that relatively small geographical areas, called primary sampling units, are randomly selected within the stratified categories so that many interviews are concentrated within a small area to reduce the costs and inconvenience for interviewers. Finally, the ANES samples households instead of individuals (although within households individuals are randomly selected and interviewed), which means that within sampling areas households are enumerated and selected at random. (This sampling procedure means that no respondents are selected in military bases, hospitals, hotels, prisons, or other places where people do not live in households. However, after the enfranchisement of eighteen-year-olds, the ANES and GSS began to include college dormitories as residences to be sampled.)
Increasingly, the commercial polling organizations have turned to telephone interviewing as a faster and cheaper alternative to field interviewing. Random-digit dialing is typically used by these polling operations to select both listed and unlisted numbers and to give each residential number the same chance of being called. Telephone sampling has an advantage over field surveys because it does not require clustering.
Telephone sampling added cell phone–only households only recently and still ignores individuals without telephones. Otherwise, no major obstacles prevent drawing an excellent sample of telephone numbers. The problems begin at that point. Success in reaching a person and completing a telephone interview is uneven, and failures may run as high as 50 percent, or even higher. Some polling organizations make repeated callbacks, as the chances of getting an answer increase with the number of callbacks. Repeated callbacks, however, slow the data collection and increase the costs. Because an important reason for using the telephone is speed and low costs, most polling organizations do not call back.
Once the telephone is answered or the household is contacted for a face-to-face interview, a respondent from the household must be selected. Some randomizing procedure is typically used to select the respondent. There are two methods for selecting respondents, and they have different consequences. The best sampling procedure, but a costly and time-consuming one, is to identify all the eligible members of the household and select one at random. If the respondent selected is not at home, an appointment is arranged for a callback. In a high-quality survey such as the ANES, many attempts are made to interview the individual randomly selected, but no substitutions are made. Telephone surveys typically allow a huge proportion of their respondents to be substitutes for the respondents who should have been interviewed. The alternative, and more common, method of selection identifies the respondent among those eligible who is available, and the interview is conducted immediately. This further compromises the sample, making it a selection among those people who happen to be at home or answer their phone when the interviewer calls.
The more often the randomly selected respondents cannot be contacted or refuse to be interviewed, the more the sample departs from its original design. Probability samples, with either face-to-face or telephone interviews, can result in unrepresentative samples if the nonresponse rate is high. The nonresponse rate refers to the number of respondents originally selected who, for whatever reason, are not interviewed and thus do not appear in the sample.1 Should these nonrespondents share some characteristic disproportionately, the resulting sample will underrepresent that type of person. For example, residents of high-crime neighborhoods and the elderly may be reluctant to answer the door for a face-to-face interview; busy people with multiple jobs may not be at home enough to be reached by landline telephone. When this happens, the sample will have fewer of these people than occur in the population, and thus the sample will be biased. All the polling organizations take steps to counter these tendencies by weighting the results to compensate for various demographic biases.2 This is a difficult problem to solve, however. The likelihood is high that the people who consent to be interviewed are different from, and therefore not representative of, those who refuse. If this is the case, counting those who are interviewed more heavily (which is essentially what weighting the sample does) does not eliminate the bias.
Internet polls and exit polls have their own sampling problems. Self-administered internet polls are increasingly common. Random-digit dialing is used to draw a sample of residential telephones, similar to a telephone poll, and create a “panel”—a large group of individuals who agree to answer a questionnaire and participate in future studies. These individuals are provided with internet access and a computer, if necessary, so the panel is not limited to those who already have such access. Each study draws a sample from the larger panel, and these respondents are informed of the opportunity to go online to answer a questionnaire at a secure website. Although the sampling design initially produces a representative set of potential respondents, people who are willing to join the panel and participate in particular studies may be different from the rest of the public. The ANES has started to use internet surveys in addition to the traditional face-to-face method. The ANES selects households in a manner similar to the face-to-face interviews and sends an invitation to participate in the study via the mail. A screening instrument is used to sample one person living at the address to complete the survey. Given the potential differences of these two methods with respect to comparability over time, we report only the face-to-face ANES results from 1952 to 2016 in this book. In 2020, due to COVID-19, ANES did telephone or web, not face-to-face, surveys. We utilize these phone and web data that were fresh samples (not the panel samples).
Internet polls have nothing in common with the self-selected “vote on the internet” polls favored by some television programs and social media. When people take the initiative to respond, instead of being chosen to respond through a random selection procedure, there can be no claim that they are a representative sample of the public.
Exit polls involve random selection of polling places. Interviewers go to each of the randomly selected polling places and are instructed to select, say, every tenth voter emerging from the polling place for an interview. At midday, the interviewers call in the results of the first set of completed interviews, and at this time the central office may adjust the interval of voters to speed up or slow down the pace of interviewing. A number of biases can be introduced in the sampling process, as busy voters refuse to be interviewed and other voters avoid interviewers on the basis of age or race. With so many people not voting in person on Election Day in 2020, exit polls in that year became even less representative.
Questionnaire Constructing
In survey questionnaires, several types of questions will ordinarily be used. Public opinion surveys began years ago with forced-choice questions that a respondent was asked to answer by choosing among a set of offered alternatives, none of which included “don’t know” or “no opinion.” For example, forced-choice questions frequently take the form of stating a position on public policy and asking the respondent to “agree” or “disagree” with the statement. The analysis in Chapter 6 was based in part on the answers to forced-choice questions on public policy that were used in ANES questionnaires in which respondents were asked to “agree strongly,” “agree,” “disagree,” or “disagree strongly.” Some respondents gave qualified answers that did not fit into these prearranged categories or volunteered that they had no opinions.
A major innovation associated with the Survey Research Center at the University of Michigan is the use of open-ended questioning. Open-ended questions give respondents the opportunity to express their opinions in their own way without being forced to select among categories provided by the questionnaire. Questions such as “Is there anything in particular you like about the Democratic Party?” or “What are the most important problems facing the country today?” permit the respondents to answer in their own terms. Interviewers encourage respondents to answer such questions as fully as they can with neutral “probes” such as “Could you tell me more about that?” or “Anything else?” or similar queries that draw forth more discussion. Open-ended questions are a superior method of eliciting accurate expressions of opinion, but they have two major disadvantages: (1) They place more of a burden on interviewers to record the responses, and (2) the burden of reducing the many responses to a dimension that can be analyzed is left for the coders. For example, if Americans are asked, “Do you think of yourself as a Democrat, a Republican, an independent, or something else?,” almost all the responses will fit usefully into the designated categories:
· Democrat
· Independent
· Republican
· Something else
· Don’t know
If a relatively unstructured, open-ended question is used, however—such as “How do you think of yourself politically?”—some people will answer with “Democrat,” “Republican,” and so forth, but many others will give answers that are substantially different, such as “liberal,” “conservative,” “radical,” “moderate,” “pragmatic,” or “I hate politics”—and these cannot easily be compared with the partisan categories. Analysts often intend to force responses into a single dimension, such as partisanship, whether the respondents would have volunteered an answer along that dimension or not. This is essential if researchers are to develop single dimensions for analytic purposes. Modern survey research includes questions and techniques considerably more complex than these examples for establishing dimensions.
Questionnaires differ a great deal in their complexity and sophistication. Face-to-face interviews with well-trained interviewers may have many open-ended questions or questions with branching, conditional on the responses to previous questions. Telephone interviews using computer-assisted telephone interview (CATI) technology and online internet polls can also be complex, relying on computer branching to guide the respondent through the questionnaire. At the other extreme, exit polls are entirely forced-choice questions that can be completed quickly by the voter without instruction.
Writing good survey questions is an art. The questions should be clear, direct, and able to be understood in the same way by all respondents, regardless of age, education, or regional or subcultural differences. They need to avoid various technical mistakes, like asking two things in one question (a so-called double-barreled question). A professionally done poll that seeks accurate results—whether an academic survey, a journalistic poll, or a political poll that wants both the good news and the bad news for its client—will try very hard to ask unbiased questions that reflect the actual opinions of the respondents rather than leading them to answer in any particular way. Not all survey operations have this as a goal, however. The following examples come from a Republican Party survey, the “Mainstream Media Accountability Survey,” conducted in February 2017. Respondents were asked, “Do you believe the mainstream media does not do their due diligence fact-checking before publishing stories on the Trump administration?” and “Do you believe the media uses slurs rather than facts to attack conservative stances on issues like border control, religious liberties, and ObamaCare?”3 The purpose of the questions was not to elicit an accurate picture of public opinion on media coverage of the Trump administration but to reinforce the view among some Republicans that the media are out to get Donald Trump and other Republicans.
Interviewing
The selection of the sample can depend in part on the interviewer, but even more important is the role of the interviewer in asking questions of the respondent and in recording the answers. Motivated, well-trained interviewers are crucial to the success of face-to-face and telephone survey research. The interviewer has several major responsibilities. First, the interviewer must select the respondents according to sampling instructions. Second, the interviewer must develop rapport with the respondents so that they will be willing to go through with the interview, which may last an hour or more. Third, the interviewer must ask the questions in a friendly way and encourage the respondents to answer fully without leading them to distort their views. Fourth, the interviewer must record the answers of the respondents fully and accurately. The best survey organizations keep a permanent staff of highly trained interviewers for this purpose.
A technological innovation used in telephone interviewing is the CATI system. The interviewer sits at the telephone, with the questionnaire appearing on a computer screen. As the interviewer moves through the questionnaire, responses are entered directly into the computer and automatically coded. Complicated branching to different questions, conditional on the responses given to preceding questions, is possible.
Telephone interviewing has some real advantages. The travel costs of a field staff are eliminated. Having interviewing conducted from a call room allows for direct supervision of the interviewing staff, enhancing the uniformity of the administration of the questionnaires. Within-interview “experiments” are possible with the CATI system. Also, changing the content of the questionnaire during the course of the study is easy and inexpensive. The great disadvantage is that face-to-face interviews yield higher-quality data.
In internet polling, on the one hand, there are no interviewers, which is a great saving in cost. On the other hand, there is no interviewer to help the respondents navigate the questionnaire or to keep the respondents motivated—or to make judgments about the plausibility of the responses.
Exit polls generally use a combination of self-administered questionnaires with interviewers available to read the questionnaires and record responses for those voters who need assistance. Given that exit polls might provide one day of work every couple of years, exit poll interviewers are not seasoned professionals. They also work in scattered locations with no direct supervision. Errors in implementing the sampling technique or in administering the questionnaires would rarely be caught and unlikely to be corrected in the short time span of Election Day.
Coding
Once the interviewers administer the questionnaires to respondents, the verbal information is reduced to a numerical form, according to a code. Numeric information, unlike verbal information, can be processed and manipulated by high-speed data-processing equipment. The coder’s task may be simple or complex. For example, to code the respondent’s voter registration status can be as simple as requiring a simple code: 1 = registered to vote, 2 = not registered to vote. A data field that contains information on the respondent will have a location designated for indicating the respondent’s registration status. A value of 1 will indicate registered, and a value of 2 will indicate not registered. Printed questionnaires for face-to-face interviews are precoded for many of the more straightforward questions, and the CATI system allows precoded categories to be assigned automatically as the interviewer records the respondent’s answers.
Some coding is complicated, with elaborate arrays of categories. For example, coding the responses to a question such as “Is there anything in particular you like about the Democratic Party?” might include hundreds of categories covering such details as “I like the party’s farm policies,” “I like the party’s tax program,” and “I’ve just always been a Democrat.” Some codes require coders to make judgments about the respondents’ answers. In political surveys, these codes have included judgments on the level of sophistication of the respondents’ answers and about the main reason for respondents’ vote choices.
After the verbal information has been converted into numbers according to the coding instructions, the data are ready for analysis by computer. At this point, the survey research process ends, and the political analysts take over to make what use of the data they can.
VALIDITY OF SURVEY QUESTIONS
A frequent set of criticisms directed at public opinion research questions the validity of the responses to survey items. Validity simply means the extent to which there is correspondence between the response given to a question and the attitude or behavior of the respondent that the question is designed to measure. There is no one answer to doubts about validity because each item has a validity applicable to it alone. Some items are notoriously invalid; others have nearly perfect validity. Many survey items have not been independently tested for their validity, and for practical purposes, researchers are forced to say that they are interested in analyzing the responses, whatever they mean to the respondent. In other instances, the sample result can be compared with the known population value.
The items with the most questionable validity in political studies come from those situations in which respondents have some incentive to misrepresent the facts or when their memories may not be accurate. Questions about voter turnout or level of income are noteworthy in this regard. Validity checks reveal that respondents are about as likely to underestimate their income as overestimate it, and a noticeable percentage of respondents claim to have voted when they did not.4
Advantages and Disadvantages of Different Types of Surveys
FACE-TO-FACE INTERVIEWS WITH RESPONDENTS DRAWN FROM A SAMPLE OF HOUSEHOLDS
· Advantages
o High-quality data
o Allows for longer, more in-depth interviews
· Disadvantages
o High cost
o Slow data collection and processing
TELEPHONE INTERVIEWS OF RESPONDENTS DRAWN FROM A SAMPLE OF RESIDENTIAL AND CELL PHONE NUMBERS
· Advantages
o Lower cost
o Fast turnaround, especially using a CATI system
o Allows direct supervision of interviewing process
· Disadvantages
o No-phone households are excluded
o Call screening and resistance to stranger calls further degrade the sample
SELF-ADMINISTERED INTERNET POLLS
· Advantages
o Less expensive once the panel is set up
o Subsamples with particular characteristics can be drawn from the panel
· Disadvantages
o Those who agree to participate may be unrepresentative of the population
EXIT POLLS
· Advantages
o Provides a large number of journalists with material for reporting and commentary immediately after an election
· Disadvantages
o Lack of training and supervision of interviewers
o With increase in absentee and mail-in voting, poll needs to be supplemented with telephone survey of voters who do not go to a polling place
Recall of past voting behavior falls victim to failing memories and intervening events. Changes in party identification, past votes cast, the party identification of one’s parents—all may contain substantial error. For example, during November and December immediately after the 1960 election, respondents were asked how they had voted for president. Most remembered voting for either John F. Kennedy or Richard M. Nixon, and as shown in Table A-1, they were divided about evenly between the two. (The slight deviation of 1 percent from the actual results is within sampling error by any reasonable standards.) The 1962 and 1964 sample estimates of the 1960 vote reveal increasing departures from the actual outcome. Granting that some change in the population over four years may affect vote-choice percentages, a substantial proportion of the 1964 sample gave responses to the question of 1960 presidential vote choice that misrepresented their vote. The validity of this item always declines over a four-year period, but President Kennedy’s assassination in the intervening years created an unusually large distortion in recalled vote.
Table A-1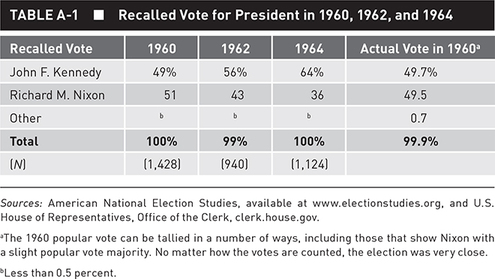
Sources: American National Election Studies, available at www.electionstudies.org, and U.S. House of Representatives, Office of the Clerk, clerk.house.gov.
a The 1960 popular vote can be tallied in a number of ways, including those that show Nixon with a slight popular vote majority. No matter how the votes are counted, the election was very close.
b Less than 0.5 percent.
VALIDITY VERSUS CONTINUITY
One of the important features of the ANES is its continuity over a seventy-year time span. Samples of the American population have been asked the same questions during every national election campaign throughout this period, offering an extraordinary opportunity for studying trends in the attitudes of the American electorate. The development of this valuable, continuous series does have one unfortunate aspect, however. Because the value of the series depends on the comparability of the questions, researchers are reluctant to alter questions, even when doubts about their validity arise. Improving the questions undermines comparability. Therefore, a choice between continuity and validity must be made.
The ANES questions concerning religious preference provide a recent example in which validity was chosen over continuity. For years, respondents were simply asked, “What is your religious preference?” Although a small percentage in each survey answered “none,” it was clear that a significant number of those answering “Protestant,” and fewer numbers citing other religions, had no meaningful religious affiliation. In the 1992 survey, the ANES began asking the question differently. Respondents were first asked, “Do you ever attend religious services, apart from occasional weddings, baptisms, and funerals?” Those who answered “no” were asked an additional question about their religious preference: “Regardless of whether you now attend any religious services, do you ever think of yourself as part of a particular church or denomination?” Those who did not answer “yes” to one of these two screening questions were not asked the traditional question about religious affiliation that then followed. As a result, the percentage of the population categorized as having no religious affiliation increased dramatically. This new question more validly reflects the religious sentiments of the American public, but it is now impossible to compare these later results with those of previous years. We cannot infer a large drop in religious affiliation on the basis of the responses to these new and different questions. In this instance, continuity has been sacrificed in favor of validity.
Despite inevitable concerns about validity, survey research provides the best means of investigating the attitudes and behavior of large populations of individuals such as the American electorate.
Suggested Readings
Fowler, Floyd J., Jr. Survey Research Methods, 5th ed. Thousand Oaks, CA: SAGE, 2014. Comprehensive overview of survey research.
Groves, Robert M., Floyd J. Fowler Jr., Mick P. Couper, James M. Lepkowski, Eleanor Singer, and Roger Tourangeau. Survey Methodology, 2nd ed. Hoboken, NJ: Wiley, 2009. Excellent coverage of the many topics of survey methods.
Kish, Leslie. Survey Sampling. New York: Wiley, 1965. By far the most authoritative work on survey sampling.
Mann, Thomas E., and Gary R. Orren, eds. Media Polls in American Politics. Washington, DC: Brookings Institution Press, 1992. An excellent collection of essays on the use of polls in contemporary media analysis.
Marsden, Peter V., and James D. Wright, eds. Handbook of Survey Research. Bingley, England: Emerald, 2010. Excellent source from top survey researchers.
Weisberg, Herbert F. The Total Survey Error Approach. Chicago: University of Chicago Press, 2005. A comprehensive treatment of survey research methods.
Weisberg, Herbert F., Jon Krosnick, and Bruce D. Bowen. An Introduction to Survey Research and Data Analysis. San Francisco: W. H. Freeman, 1989. A good, methodological textbook on survey research and the interpretation of statistical analysis.
Internet Resources
The website of the American National Election Studies, www.electionstudies.org, has extensive information on survey methodology.
Some other websites with methodological information are the Gallup poll, www.gallup.com, and the General Social Survey, http://gss.norc.org/.
The Pew Research Center, www.pewresearch.org/topic/methodological-research/, has done interesting methodological analyses and offers important information on survey sampling and methods.
NOTES
1. See John Brehm, The Phantom Respondents (Ann Arbor: University of Michigan Press, 1993).
2. Jelke G. Bethlehem, “Weighting Nonresponse Adjustments Based on Auxiliary Information,” in Survey Nonresponse, eds. Robert M. Groves, Don A. Dillman, John L. Eltinge, and Roderick J. A. Little (New York: Wiley, 2002), Chapter 18, 275–288.
3. Danielle Kurtzleben, “The Trump Media Survey Is Phenomenally Biased. It’s Also Useful,” NPR, February 17, 2017, http://www.npr.org/2017/02/17/515791540/the-trump-media-survey-is-phenomenally-biased-it-also-does-its-job-well.
4. Paul Abramson and William Claggett, “Race-Related Differences in Self-Reported and Validated Turnout,” Journal of Politics 46 (August 1984): 719–738.