A CENTRAL FOCUS of research on American political behavior is vote choice, especially presidential vote choice. Most Americans follow presidential campaigns with greater attention than they give other elections, and eventually over 50 percent of the electorate expresses a preference by voting. The results of presidential balloting are reported and analyzed far more extensively than any others. This chapter explores the main determinants of vote choice and the interpretation of election outcomes in light of these determinants. The 2020 election was different from past elections in many ways. It took place during the COVID-19 pandemic when health and the economy were front and center. The United States was (and is) more polarized than it has been in a very long time. The racial reckoning following the killing of George Floyd led to widespread protests. The sitting president, Donald Trump, had lost the popular vote but won the Electoral College vote in 2016 and never saw his approval ratings hit 50 percent.1 As we will show in this chapter, what is striking about the 2020 election is not only how different it was but also how normal it was in terms of the factors that explain vote choice.
In their pioneering work The American Voter, Angus Campbell, Philip E. Converse, Warren E. Miller, and Donald E. Stokes introduced the metaphor of the “funnel of causality” to depict the way multiple factors have an impact on an individual’s vote choice.2 As they envisioned it, at the narrow end of the funnel is the dependent variable, vote choice. At the wide end of the funnel are social characteristics, such as race, gender, social class, and level of education—factors that shape many facets of an individual’s life and that are related to political attitudes and, ultimately, vote choice. These relationships, however, are not especially strong. Next in the funnel are long-term predispositions, including partisanship (Chapter 5) and ideology (Chapter 6), that orient and predispose an individual to view the world and act in particular ways. These predispositions are related to social characteristics, but not wholly determined by them. They are also more strongly related to vote choice than are the social characteristics, but by no means do they determine it. Moving further toward the narrow end of the funnel, we find attitudes toward issues that are important to the individual as well as evaluations of the current parties’ candidates. Again, these attitudes are related to the long-term predispositions of party and ideology and, to a lesser extent, to the individual’s social characteristics. They are also more closely linked to, and more predictive of, how the individual will vote. The preceding chapters have looked in depth at the various factors. In this chapter, we bring them all together to answer the question “Why do people vote the way they do?” starting with the factors that are furthest from vote choice.
Learning objectives for Chapter 8 include:
· Exploring how the long-term factors that people bring into any given election affect their presidential vote choice
· Learning what short-term factors add to predicting election outcomes
· Engaging with ideas for changing the Electoral College as the way Americans elect their president
· Examining voters’ choices in lower-level elections
· Interpreting the meaning of the 2020 election
LONG-TERM DETERMINANTS OF PRESIDENTIAL VOTE CHOICE
Social Characteristics
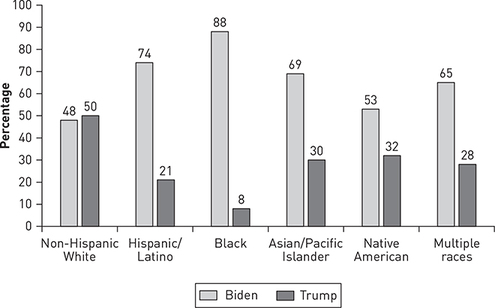
Social characteristics such as an individual’s race, religion, social class, and gender are unlikely to change over the course of a campaign. They are, rather, a set of long-term factors that both analysts and politicians link to vote choice. Social analysis of the 2020 presidential election reveals striking patterns, shown in Figure 8-1. A key feature of the 2020 election was the demographic makeup of the American people and how this played out in support for the two major-party candidates. According to the 2019 U.S. Census Bureau American Community Survey data, Hispanics and Latin@s make up 18 percent of the American population. Among non-Hispanics, the American population consists of 60 percent whites, 12 percent Black and African Americans, 6 percent Asians and Pacific Islanders, 1 percent Native North Americans, and 2.5 percent more than one race.3 The United States has become increasingly diverse in its population over time. If the various racial and ethnic groups all had the same vote choice distribution, the changing demographics would be politically uninteresting. Instead, they are highly interesting. Figure 8-1 shows that whites were more likely to support Republican Donald Trump than Democrat Joe Biden, whereas every other racial and ethnic group was much more likely to support Biden over Trump.
In 2020, Black voters heavily favored Democratic candidate Joe Biden, but their support for him was lower than was their support for Barack Obama in 2008 and 2012. Drawing on data from the American National Election Studies (ANES), Blacks were nearly unanimous in voting for Obama in 2008 (99.5 percent) and in 2012 (98 percent). Their vote dropped to 90 percent for Democratic candidate Hillary Clinton in 2016 and to 88 percent for Biden in 2020. Recall that Black voters have overwhelmingly supported the Democratic candidate—usually by 90 percent or more—for decades (see also Chapter 6). The impact that a Black candidate had on Black voting behavior was seen both in heightened turnout and in enthusiasm for his candidacy. Clinton and Biden did not generate an equal level of enthusiasm or votes.
 Description
Figure 8-1 Vote for President, by Race and Ethnicity, 2020
Source: 2020 American National Election Studies, available at www.electionstudies.org.
Biden also did quite well among other people of color (see Figure 8-1). In recent years, Republicans have had hopes of making inroads among Hispanic and Latin@ voters, but since 2004 the numbers overall seem to be moving in the wrong direction for the Grand Old Party (GOP). Hispanics and Latin@s gave Democrat John Kerry 60 percent of their vote in 2004, Obama 73 percent in 2008 and 76.5 percent in 2012, and Clinton 69 percent in 2016. Biden comparatively did very well among Hispanics and Latin@s, with 74 percent voting for him compared to only 21 percent for Trump. Asian Americans have turned to the Democratic Party over the past couple of decades. The Democratic share of the Asian American vote was 31 percent in 1992, 62 percent in 2008, 73 percent in 2012, and 63 percent in 2016. In 2020, Biden garnered 69 percent of the Asian American vote.4 The number of Native Americans and people who identify as more than one race included in the 2020 ANES survey was very small, so the percentages provided in Figure 8-1 are not as reliable, in terms of the results being generalizable to the Native American and mixed-race populations, as the other numbers. The results, however, fit the pattern of other people of color: support for Democrat Joe Biden was much stronger among these groups than was support for Republican Donald Trump.
White Americans were more supportive of Trump than were the other major racial and ethnic groups, with 50 percent supporting Trump and 48 percent supporting Biden. Trump did worse among whites in 2020 than he had in 2016, when he received 53 percent of the white vote (and Clinton won only 42 percent). We further break down the white vote by education, a social characteristic that increasingly differentiates white Republican and Democratic voters. Whites with a bachelor’s or graduate degree strongly backed Biden, giving him 62 percent of their vote. In contrast, whites who had not graduated from college were supporters of Trump, with 61 percent voting for the sitting president.
With a woman on the ticket as the Democrats’ vice-presidential candidate, pundits wondered if this would draw more women to vote for Biden. Overall, women voted for Biden over Trump, 58 percent to 39 percent. Unlike in 2016, when men were evenly divided in their votes for Trump and Clinton, men in 2020 were strong supporters of Biden, giving him 55 percent of their vote to Trump’s 42 percent. These data hide the large differences between whites and people of color. White women were slightly more likely to vote for Trump (49 percent) than Biden (48.5 percent). Women of color overwhelmingly voted for Biden (79 percent) over Trump (16 percent). Among men, 51 percent of white men voted for Trump and 47 percent for Biden, whereas 22.5 percent of men of color voted for Trump and 73 percent for Biden.
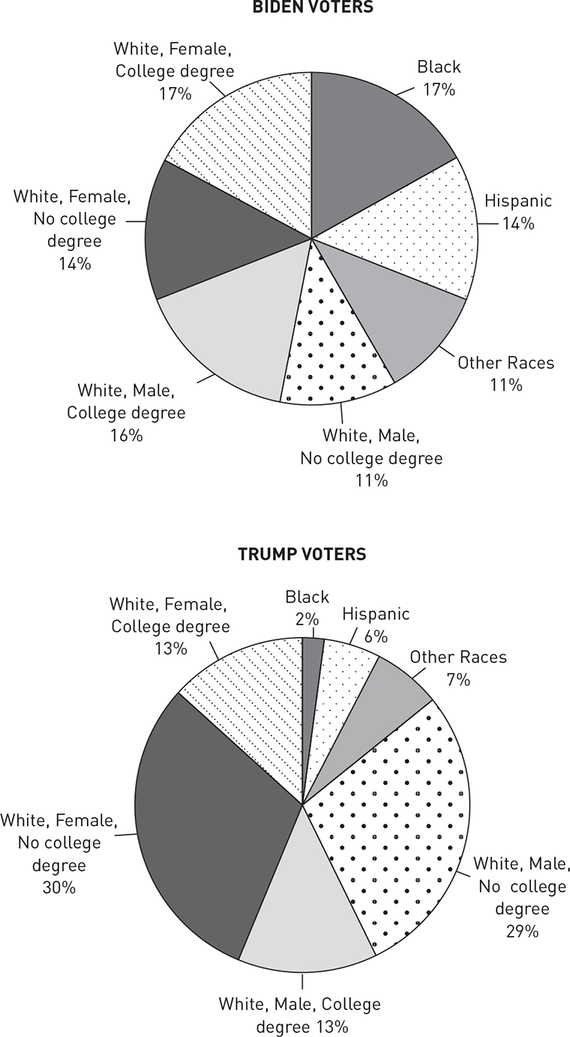
We can also look at the ways various social groups contributed to the vote totals of the two candidates. Figure 8-2 shows the analysis of the “composition” of Trump’s and Biden’s votes, in contrast to how the social groups voted. We further categorize white voters by gender and education level to determine from whom each candidate drew his white support. The composition of Biden’s vote total reflects his and the Democratic Party’s appeal to diverse groups in American society: Black people made up 17 percent of Biden’s vote, Hispanics 14 percent, other people of color 11 percent, and white people 58 percent. Among these white supporters, Biden received most of his support from those with a college education. White, college-educated women made up 17 percent of his voters, and white, college-educated men made up another 16 percent. Less-educated whites made up a smaller portion of his voter base (11 percent men and 14 percent women). Trump voters were much less diverse racially and ethnically. Trump voters were 2 percent Black, 6 percent Hispanic, 7 percent other people of color, and 85 percent white. Among white Trump voters, those without a college degree were much more numerous (59 percent) than those with a college degree (26 percent), fairly evenly divided between men and women.
 Description
Figure 8-2 Social Composition of the Vote for President, by Race, Ethnicity, Gender, and Education, 2020
Source: 2020 American National Election Studies, available at www.electionstudies.org.
The Republican Party, in assessing its loss in the 2012 election, pointed to the problem of diversity within the party as a possible culprit. Republican National Committee chairman Reince Priebus argued that Americans viewed the party as a “‘narrow-minded, out-of-touch’ party of ‘stuffy old men’” and that the GOP needed to do something about this party image. Young Republicans, in the College Republican National Committee, were especially blunt in arguing that the party needed to take steps to broaden its appeal, including reaching out to women, gay voters, younger people, and other underrepresented groups. Of particular concern to Republicans was the trend toward the Democratic Party of Latinos and Latinas. Three-quarters of Latin@s voted for Democrat Barack Obama, compared to only 22 percent who voted for Republican Mitt Romney. Political scientist Sergio Wals’s research points to the potential positives of the Republican Party courting Hispanic voters. Wals found that Mexican immigrants aren’t guaranteed Democrats. They span the ideological spectrum, and as a bonus to the Republican Party, those on the right are more likely to be politically engaged than those on the left.5
Some Republicans, including Senator Marco Rubio of Florida, tried to push the Republican Party to support immigration reform that was more sensitive to Latin@s in the United States.6 Not all Republicans were on board with the idea. The 2016 Republican primaries pitted pro-immigration Rubio against anti-immigration Trump, and Trump won handily. Even so, Hispanic support for the Republican nominee increased from 22 percent in 2012 (Romney) to 32 percent in 2016 (Trump), but dropped again to 21 percent in 2020 (Trump). Hispanic support for the Democratic nominee dropped from 76 percent (Obama in 2012) to 69 percent (Clinton in 2016) but rose to 74 percent in the most recent election (Biden in 2020). The desire among some Republicans to diversify their base has not been a priority during Trump’s leadership of the Republican Party.
Partisanship and Ideology
As seen in earlier chapters, party loyalty is a basic characteristic that influences many aspects of an individual’s political behavior and is itself influenced by an individual’s social characteristics. In Table 8-1, we see the relationship between partisanship and vote choice in 2020. As strength of partisanship increases, so does the likelihood of voting for one’s party so that strong Democrats and strong Republicans are overwhelmingly supportive of their respective party’s nominee. As shown in Chapter 5’s discussion of defection rates, what makes 2020 different from previous years is the much larger percentage of Republican-leaning independents and weak Republicans who chose Joe Biden over Donald Trump. In 2016, less than 10 percent of both groups voted for Democrat Hillary Clinton. Democrats, in contrast, were much more successful at keeping weak and leaning Democrats in their fold. Over 90 percent voted for Biden in 2020, compared to only about 80 percent who voted for Clinton in 2016. Trump was a highly polarizing figure, and more Republicans than is normal jumped ship.
Ideology works in much the same way as partisanship as a long-term predisposition that shapes attitudes and behavior (see Chapter 6). When voters have a clear ideological viewpoint, it is highly related to vote choice, as can be seen in Table 8-2. Among those who call themselves “moderate” or who disclaim any ideology, voters can try to discern which candidate is more moderate or, as is often the case, rely on other factors to help them decide how to vote.
Also included in Tables 8-1 and 8-2 is the “other” category. In many elections, third-party or minor candidate votes are so minimal they hardly deserve mention. In some years, however, third-party candidates do fairly well among some segments of the population. For 2016, when many voters did not like either of the major party candidates, ANES data show that 5 percent of respondents said they voted for Libertarian candidate Gary Johnson, 1 percent said they voted for Green Party candidate Jill Stein, and another 2 percent said they voted for a different alternative. Third-party candidate support was much more muted in 2020, although 13 percent of pure independents said they voted for someone other than Biden or Trump.7 Not surprisingly, people who claim to be independents are more likely to vote for a third-party candidate.
Table 8-1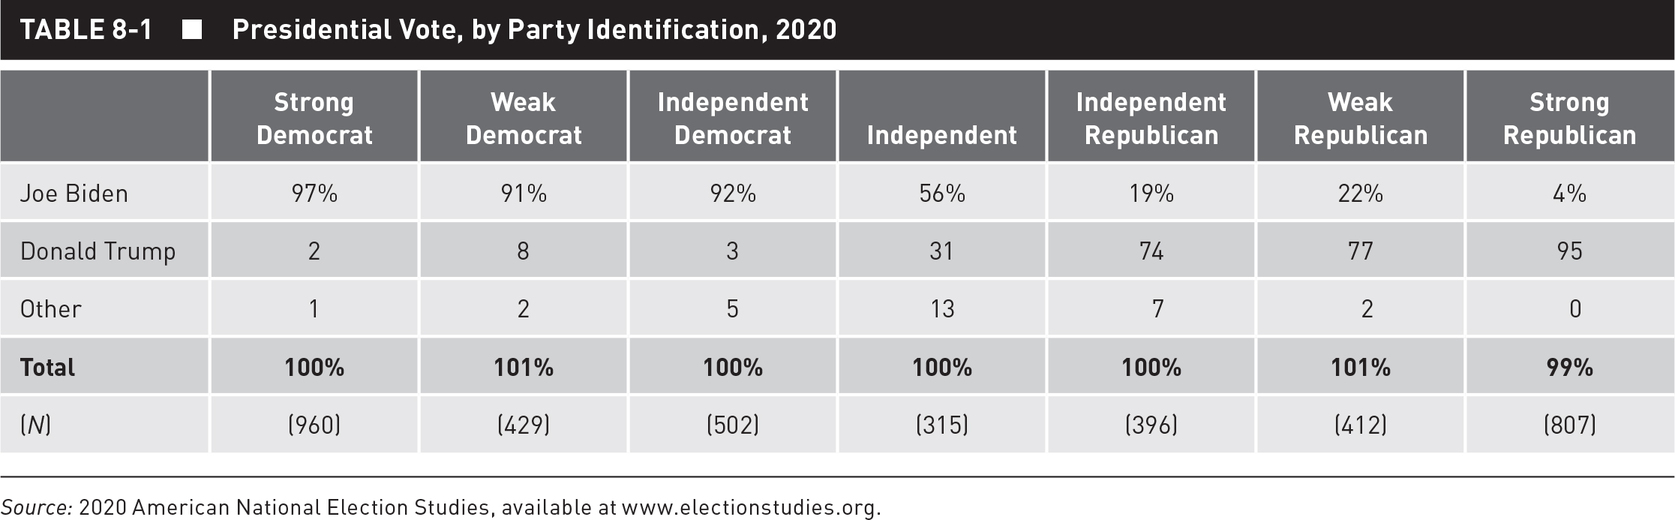
Source: 2020 American National Election Studies, available at www.electionstudies.org.
Table 8-2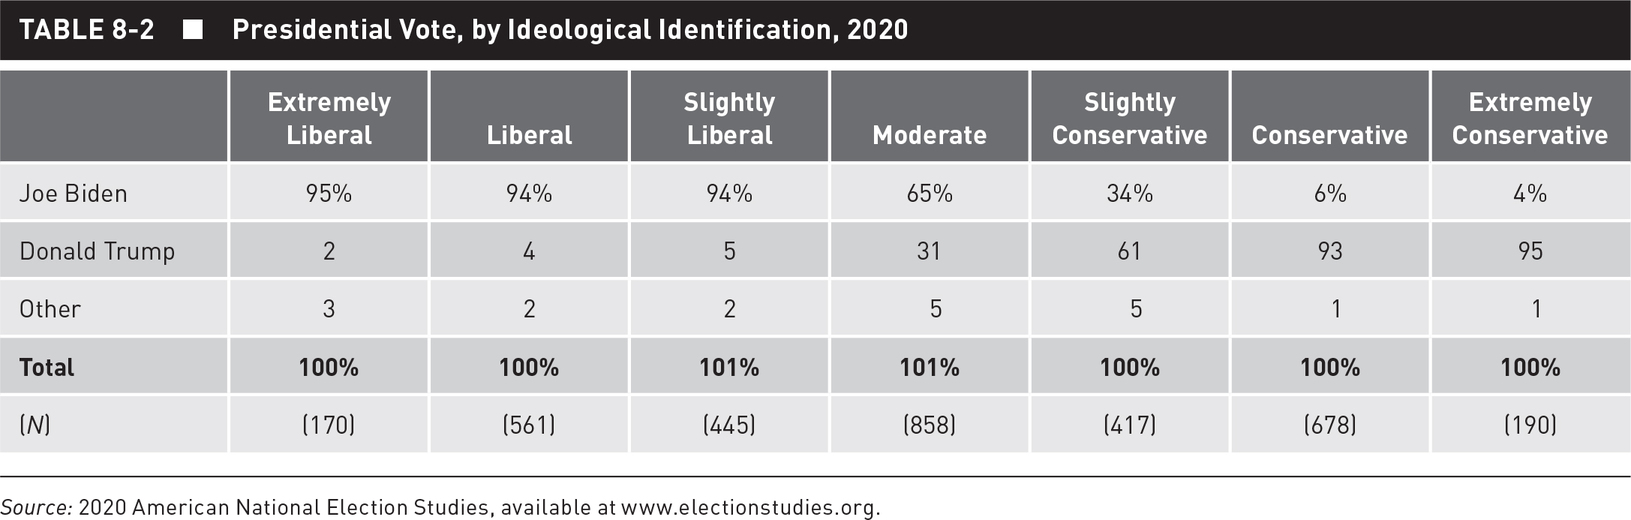
Source: 2020 American National Election Studies, available at www.electionstudies.org.
As we have seen in Chapter 6, partisanship and ideology are related to each other—increasingly so, given the partisan sort—and it would be very difficult to untangle the causal connections between the two. No doubt some individuals adopt a party because it fits their ideological worldview or because their admired party leaders are so labeled. For most people, though, partisanship takes a more central role in explaining voting behavior in part because more Americans think of themselves as partisans or independents than as ideologues. Candidates are also more explicitly connected to their party than to their ideology because they have chosen a party label under which to run (while possibly avoiding or obfuscating an ideological label for another one like “reformer,” “maverick,” or “outsider”). Trump is a good example of a politician who does not fit the label “conservative” well, but he ran for office as a Republican. Nonetheless, as we think about the factors that influence a person’s vote, we can think of ideology as holding a similar place in the chain of factors—or funnel of causality—that leads to the final voting decision, especially now that the parties have more clearly become ideologically sorted.
SHORT-TERM DETERMINANTS OF PRESIDENTIAL VOTE CHOICE
Candidate Image
In seeking to understand vote choice, an individual’s partisanship can be construed as a long-term predisposition to vote for one party or another, other things being equal. In other words, in the absence of any information about candidates and issues or other short-term forces in an election, individuals can be expected to vote according to their partisanship. However, to the extent that such short-term forces have an impact on them, voters may be deflected away from their usual party loyalty toward an out-party candidate. The more short-term forces there are in an election—or the more a voter is aware of them—the less impact partisanship might have on a person’s vote choice. This idea is crucial for understanding the relative impact of partisanship in different types of elections. In highly visible presidential elections, when information about candidates and issues is widely available, partisanship will typically be less overriding in the voter’s decision than in less visible races down the ticket. Furthermore, more potent short-term forces would be required to cause a very strong partisan to vote for another party than would be necessary to prompt a weak partisan to defect. An individual’s vote in an election can be viewed as the product of the strength of partisanship and the impact of short-term forces on the individual.
In most elections, both candidates and political commentators give their attention to short-term forces, such as the candidates’ personalities and the issues, because they want to pull in the votes of weaker partisans and independents. This section considers the impact of the short-term forces of candidate image and issues within a setting of stable party loyalties.
During the past seventy years, national samples have been extensively questioned about their views of the presidential candidates. During this period, several very popular candidates such as Republican Dwight Eisenhower and Democrat Lyndon Johnson had extremely favorable images, and several others such as Republican Barry Goldwater and Democrat George McGovern were rejected by the electorate in part on the basis of their personal attributes.
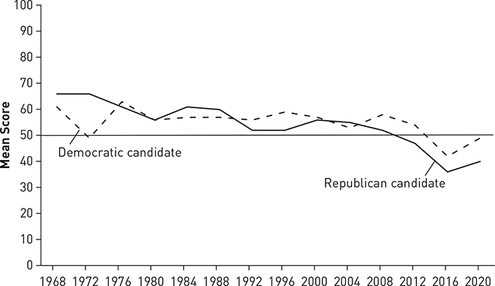
Figure 8-3 displays the mean ratings of presidential candidates since 1968 on the ANES feeling thermometer, which asks respondents to rate how “warmly,” or favorably, they feel toward a candidate on a scale of 0 to 100, with 100 being very warm and 0 being very cold. Perhaps the most prominent feature of this series is the unfavorable view Americans had of both candidates in the 2016 election. Neither Trump nor Clinton broke the 50-degree mark, thereby coming in on the cold side of the thermometer. This is the first time in recent history that at least one of the two major-party candidates did not generate at least some overall warm feelings among the public. Trump stayed well below the 50-degree mark, and Biden almost topped the midpoint but didn’t make it above 49 degrees in 2020. A second feature of the feeling thermometer data is the downward trend for the Republican candidates. Democratic candidates experienced something of a downward trend as well until Obama became their candidate in 2008 and again in 2012. Other indicators of candidate image show that the downward trend would be even steeper if elections in the 1950s and early 1960s were included. The disenchantment with government and politics, catalogued in Chapter 1, clearly extends to the personal images of the presidential candidates.
 Description
Figure 8-3 Democratic and Republican Presidential Candidate Feeling Thermometers, 1968–2020
Source: American National Election Studies, available at www.electionstudies.org.
Note: The values in the figure represent “thermometer scores,” in which respondents are asked to rate the candidates on a scale of 0 to 100, where 0 is very cold, or negative, and 100 is very warm, or positive.
Incumbent presidents face a different situation than challengers do in that voters have the previous four years to judge whether the president has been doing a good job or not. If the president is doing a bad job, it does not make a lot of sense to put the same person back in office for another four years. Part of voters’ calculus when deciding for whom to vote when an incumbent is running includes an assessment of the president’s performance in office (see Chapter 2 on presidential approval). Even if an incumbent is not running, as was the case in 2016, people judge the incumbent party, and therefore the incumbent party’s candidate, based on the success of the outgoing president. One question asked by many polling organizations and included in the ANES survey is the presidential approval question, which asks if people approve or disapprove of the way the president is handling the job. While presidential approval is not a direct measure of candidate image, it acts as a gauge of the perceived leadership ability of the incumbent president and party. Table 8-3 shows the presidential approval level in the preelection survey and whether the incumbent or the incumbent’s party won reelection. Since 1972, there have been nine elections in which an incumbent ran for reelection (or election, in Gerald Ford’s case). Of those nine, the incumbent has won reelection five times and lost four times. The average approval rating of those who won their bid for reelection is 59 percent. For those who lost, the average is 44 percent.
Table 8-3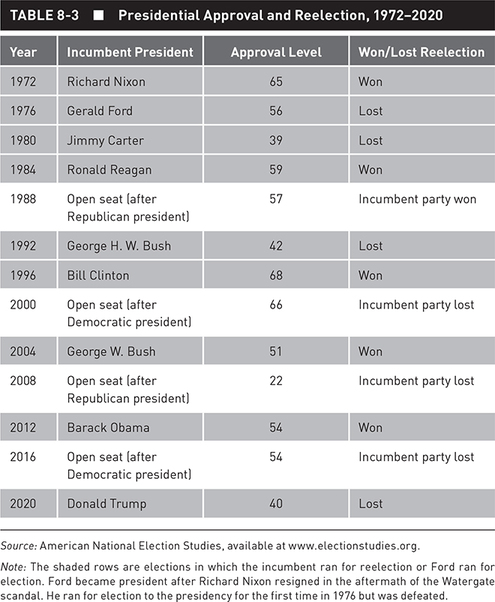
Source: American National Election Studies, available at www.electionstudies.org.
Note: The shaded rows are elections in which the incumbent ran for reelection or Ford ran for election. Ford became president after Richard Nixon resigned in the aftermath of the Watergate scandal. He ran for election to the presidency for the first time in 1976 but was defeated.
When the incumbent president’s approval level dips below 50 percent, the likelihood of winning reelection is slim. Jimmy Carter was originally elected in 1976. When he came up for reelection in 1980, his presidency was associated with both a bad economy and the Iran hostage crisis. With only 39 percent approval, he lost his reelection bid to Ronald Reagan. George H. W. Bush, who had been Reagan’s vice president and won his bid for the presidency in 1988, similarly had to try to get past a struggling economy to be reelected. His approval rating was only 42 percent as the 1992 election approached, and he was defeated by Bill Clinton. Chapter 2’s discussion of structural factors and presidential voting reminds us that Donald Trump faced the COVID-19 crisis and a struggling economy when he ran against Joe Biden in 2020, and he lost his reelection bid with an approval rating of only 40 percent.
Open-seat races are difficult for the incumbent party to win. Negative images of a president can wrap themselves around the neck of the party’s next presidential candidate. Though John McCain had run against George W. Bush in the 2000 Republican primaries and had been an occasional antagonist of President Bush, Democratic candidate Barack Obama tied McCain to Bush every chance he got, helping to link voters’ unusually negative perceptions of Bush to the McCain candidacy. Even positive evaluations of the exiting president do not lead to a sure win for the incumbent party. Republicans won the open seat in 1988 when Ronald Reagan was highly popular. Bill Clinton’s 66 percent approval rating led to a popular vote win for Al Gore but not an Electoral College victory. The Democrats experienced a similar loss in 2016 when a popular president’s party won the popular vote but not the Electoral College vote.
Analysts have tried to get at how the electorate evaluates candidates on a more personal level. In most presidential election years, political reporters gauge which candidate people think is more likable. In 2016, a Rasmussen poll asked voters with which candidate they would rather have a beer and which candidate they would like to have home for dinner with them or their family. Respondents were more likely to choose Trump to have a beer with (45 percent Trump, 37 percent Clinton) and leaned toward Trump as a dinner guest (42 percent Trump, 41 percent Clinton).8 These questions were not asked in 2020, which might strike some people as a good thing. Asking people with whom they would rather have a beer or dinner might seem frivolous—the best dinner date is not necessarily a good president—but candidate image can help people assess what kind of a job the candidates would do in office and if they would understand the needs and concerns of everyday Americans.
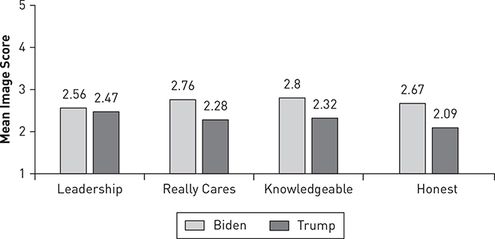
On average, presidential candidates score higher on traits associated with their political party. That is, people assume a party’s candidate is characterized by the traits they associate with the party. People generally assume Republican candidates are stronger leaders and more moral, whereas Democratic candidates are assumed to be more compassionate and empathetic.9 In 2020, voters knew both candidates well (one having served as president for four years and the other as vice president for eight years) and saw the two as highly different people. The ANES survey asked respondents the extent to which a variety of traits—leadership, caring, knowledgeability, and honesty—described the two candidates. The response options ranged from not well at all to extremely well. Figure 8-4 shows the means for Trump and Biden for each of the traits. Biden received higher ratings than Trump on all four traits, although the difference was small on leadership. It is interesting to note that Biden’s knowledge score was higher than Trump’s even though the latter had spent four years in office as president. Overall, respondents had a negative view of both candidates in the sense that none of their ratings was above the midpoint. For all of the traits and both of the candidates, people rated them more negatively than positively.
 Description
Figure 8-4 Democratic and Republican Candidate Image, 2020
Source: 2020 American National Election Studies, available at www.electionstudies.org.
Political scientists have increasingly taken seriously the important role emotions play in politics.10 Contrary to the view that people are rational and policy oriented, constantly weighing the costs and benefits of candidates’ policy proposals, research shows that people’s reactions to much of what goes on in politics is emotional. Candidates can make people feel angry or afraid, proud or hopeful. Obama framed his run for the presidency in 2008 on the idea that many people wanted to see change but had given up hope. He told Americans that if he were elected, he would bring the change they wanted. Trump framed his message in 2016 very differently. His campaign message was “Make America Great Again,” but his vision of America was dystopian. Even in his inaugural address, Trump painted a picture of the United States as one of “American carnage” in which crime was rampant in American cities, jobs were gone overseas, and America’s wealth and standing in the world had “dissipated.”11 The president couldn’t run on a dystopian message in 2020 since doing so would raise questions about what he had accomplished over the previous four years. Trump instead raised fears about what would happen if the Democrats won, played up the gains made in the stock market, and claimed that the only way he could lose the election was if there was rampant voter fraud. Biden’s primary message was that he wanted to bring the country back together after the tumultuous Trump presidency. He emphasized that he was not Trump, that he would handle the pandemic very differently from Trump, and that he would restore America’s international image. The messages candidates focus on and their actions during the campaign, in addition to the media stories about the candidates, can affect how people emotionally react to them.
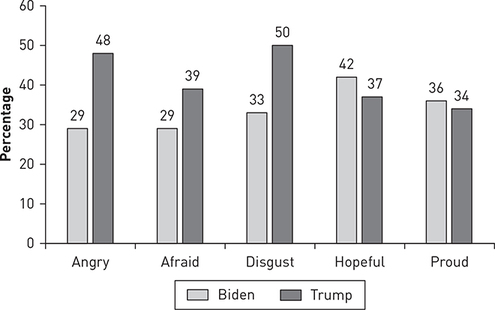
A George Washington University Politics Poll fielded in October 2020 asked respondents, “How often would you say you’ve felt the following emotions because of the kind of person Joe Biden is or because of something he has done?” They were asked the same question about Donald Trump. The emotions were angry, afraid, disgusted, hopeful, and proud.12 Figure 8-5 shows the percentage of people who answered most of the time or always to experiencing each of the emotions. Trump made people feel much more angry, afraid, and disgusted than did Biden. Biden was able to generate slightly more hope and pride than Trump, but the main story is that many people had a strong and negative emotional reaction to Trump.
A major question, given these differences, is whether candidates can manipulate their image to their advantage. That is, do campaign managers come up with an ideal image for their candidate and then create that image in the mind of the American public? It is highly unlikely that campaign managers have this kind of power, especially for well-established candidates about whom voters are reasonably well informed. Overall, the public’s impressions of candidates for major office seem to be realistic, gained primarily through ordinary news coverage. This is not to say that these images are accurate, fair, or sophisticated, but they are not fictitious pictures created by public relations personnel. In 2020, both Trump and Biden were well-known political figures who had already established who they were in the minds of the public. Trump was seen as a highly divisive figure whose followers praised him for telling it like it is and being strong and action oriented while his opponents viewed him as corrupt and antidemocratic. Biden was less divisive, with his supporters appreciating his calm, reasoned solutions to problems and his opponents seeing him as weak and against freedom. There was little either candidate could do during the campaign to change these images.
 Description
Figure 8-5 Emotional Reactions to Biden and Trump, 2020
Source: George Washington University Politics Poll, October 16–26, 2020.
Note: Percentage of people responding most of the time or always to each of the emotions questions.
Few candidates for other offices are as well known or as well publicized as candidates for the presidency. Typically, voters will be aware of candidates’ party affiliation and whether they are incumbents, but not much more. In fact, these pieces of information may come to the voter’s attention only if they are indicated on the ballot. Because of low information, unimportant things like the order of candidate names on the ballot can affect the vote. Candidates whose names come first on the ballot tend to get more votes than candidates whose names appear further down on the list.13
Lynn Vavreck has shown that the messages candidates promote and the images they try to cultivate are the most effective when they coincide with broader, structural forces that shape electoral outcomes (as discussed in Chapter 2).14 For example, having empathy and focusing on economic issues served Bill Clinton well in the 1992 campaign season, which occurred during an economic recession. Donald Trump’s image of being willing to speak his mind and not fit the politics-as-usual model helped him in 2016 when Americans were fed up with politics. Joe Biden’s image of knowing how government works and using it to solve major problems helped him in 2020 when people were still reeling from the COVID-19 pandemic.
Issue Impact
Unlike candidate image, which is contextually part of a particular election, issues can be specific to the current candidates or a carryover from previous elections. The perception of the stands of candidates and parties on issues is a basis for making vote choices, a basis usually distinct from either personality characteristics or long-standing symbolism. In the short run, candidates cannot change their job experience, religion, or party, but they can take new stands on issues or attempt to change the salience of issues, making issue appeals a basis for people’s vote choice.
The extent to which voters are concerned with issues in making vote choices is a subject of considerable debate.15 One consideration is whether the candidates themselves offer distinct issue choices. There was a rise in issue voting associated with the election of 1964, when the correlation between attitudes on issues and vote choice peaked in the ideological Johnson/Goldwater campaign, but issue voting remained through 1972 at a considerably higher level than in the “issueless” 1950s.16 What makes these elections stand out is the clear contrast the candidates offered in their issue positions. If candidates take highly divergent stands on important issues of the day, people will be able to vote on the basis of issues. If, however, candidates’ issue stands are quite similar, people will have a difficult time being issue voters. This was the case in the elections of 1988 and 1992.17 Even if people don’t vote on the basis of candidates’ issue stands, they could vote using the heuristic, or shortcut, of party issue image. Candidates and their issue stands come and go and are more or less transparent, but the reputations parties develop within certain issue areas can easily be used by voters when determining which party’s candidate is likely to pursue which policy areas. When people have low information about the candidates’ issue stands, they can be issue voters indirectly by voting for the candidate whose party’s issue positions come closest to their own.18 Benjamin Highton has found that candidate issue contrast has a much bigger impact on vote choice from election to election than party issue contrast, but both play a role in elections.19
A second consideration focuses on the voters themselves. In most elections, many voters are unaware of the stands candidates take on issues. Voters commonly believe that the candidates they support agree with them. This suggests that voters may project their issue positions onto their favorite candidates more often than they decide to vote for candidates on the basis of their position on issues. Furthermore, when voters agree with a candidate’s issue stand, they may have adopted this position merely to agree with their favored candidate. Candidates and other political leaders frequently provide issue leadership for their followers. Within the enormous range of possible issues at any given time, complete indifference to many is common. Most issues important to political leaders remain in this indifferent category for the general public.
Over the years, considerable commentary has focused on the rise of single-issue voting. Collections of voters, caring intensely about a particular issue, vote for whichever candidate is closest to their views on that issue, regardless of the candidate’s party, personal characteristics, or positions on other issues. There is nothing new about this phenomenon. The classic example of single-issue voting in American politics was abolition, an issue so intense that it destroyed the Whig Party, launched several new parties including the Republican Party, and was a major contributing factor to the Civil War. Abortion is a current issue that determines the way some people will vote. Intense concentration on a single issue, however, is potentially divisive and damaging to parties that must appeal to a broad range of voters or to those in office who must cast votes on a wide range of issues.
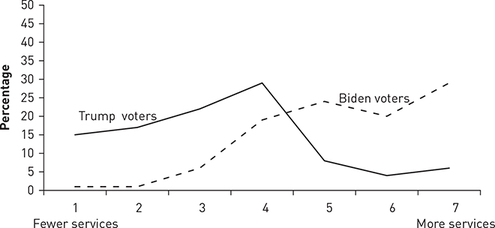
In some ways, 2020 was an odd year for issues. Normally, the two major parties put together a platform at their national conventions that reflect the issue stands of the party and of the party’s nominee for the presidency. The Democratic Party did this, highlighting issues related to the economy, racial justice, health care, climate change, and so on.20 The Republican Party, in contrast, chose not to release a platform, stating instead, “Resolved, That the Republican Party has and will continue to enthusiastically support the President’s America-first agenda” and “Resolved, That the Republican National Convention will adjourn without adopting a new platform until the 2024 Republican National Convention.”21 Rather than spell out the issue differences between the parties, the Republican Party simply backed its presidential candidate, Donald Trump. We nonetheless quickly examine a handful of issues that were relevant to the presidential election. (See Chapter 6 for a fuller discussion of party differences on major issues.) We begin with a major issue that has divided the two major parties for many decades, the extent to which government spending and services should be increased or decreased. As Figure 8-6 shows, those who favored increasing government services and spending were much more likely to vote overwhelmingly for Biden over Trump, although a plurality of Trump voters were at the midpoint of the scale rather than calling for fewer services.
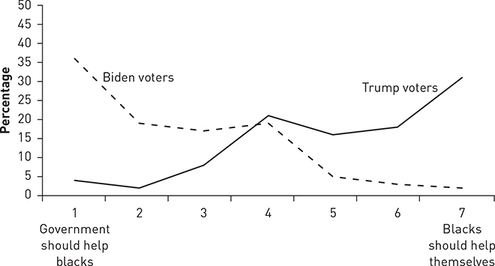
On another domestic issue—whether the government should provide assistance to Black people versus letting them help themselves, shown in Figure 8-7—Biden voters were much more likely to endorse the “government should help” side of the scale, with a third placing themselves at a 1 on the scale. Trump voters, on the other hand, were much more likely to place themselves on the “help themselves” side of the scale, with almost a third of Trump voters placing themselves at 7 on the scale.
 Description
Figure 8-6 Presidential Vote and Attitude Toward Government Services, 2020
Source: 2020 American National Election Studies, available at www.electionstudies.org.
 Description
Figure 8-7 Presidential Vote and Attitude Toward Government Help for Black People, 2020
Source: 2020 American National Election Studies, available at www.electionstudies.org.
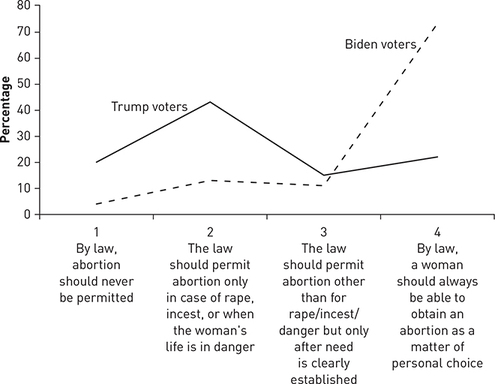
Because both these issues deal with themes that have long divided the parties, it is not surprising that substantial relationships exist between holding a certain view and supporting a particular candidate. The issue of abortion is a more recent divisive issue. The strong relationship found in 2020 and shown in Figure 8-8, also true from 2000 through 2016, suggests increasing polarization especially among Democrats. Trump’s supporters were more likely to be on the pro-life side of the issue, with 20 percent choosing the option that abortion should never be allowed and 43 percent allowing abortion only in cases of rape or incest or when the woman’s life is in danger. Over one-third of his supporters, however, were more open to laws allowing abortion (responses 3 and 4). Biden voters were overwhelmingly on the pro-choice side, with 73 percent choosing the option that women should be able to choose whether to have an abortion. Nonetheless, over a quarter of Biden voters supported some restrictions on abortion. (See Chapter 6 for a more extensive discussion of how abortion preferences are arrayed in the American public.)
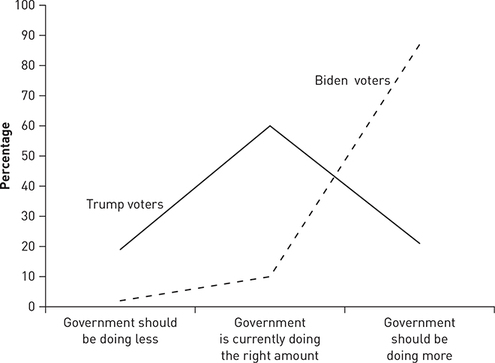
A major issue in recent years, especially among liberals, has been climate change. The scientific evidence supporting the idea that human actions have caused the unprecedented increase in global temperatures over the past fifty years is “unequivocal.”22 Unfortunately, climate change has become a partisan issue. Respondents were asked how much climate change is affecting severe weather and temperatures in the United States. Response options ranged from 1 (not at all) to 5 (a great deal). Trump voters had an average score of 2.5 on this scale whereas Biden voters had an average score of 4.4. Respondents were also asked if they thought the government should be doing more or less about rising temperatures. Figure 8-9 shows the partisan split between Trump and Biden voters on this issue. Almost all of the Biden voters (87 percent) said the government should be doing more about this issue. Most Trump voters (60 percent) were happy with the government’s current actions. Keep in mind that the survey was administered while Trump was still president. Almost 20 percent of Trump voters thought the government should be doing less.
Three issues were at the forefront of the 2020 election: the state of the economy, COVID-19, and immigration. As explained in Chapter 2, economic conditions are highly correlated with presidential election results. People naturally want the economy to be strong and for whoever is elected president to make sound decisions that will lead to or shore up a healthy economy. Both of the major-party candidates must work to convince voters that they will increase the number of jobs, keep inflation in check, and increase economic growth if they are elected. Presidents tend to be held responsible, or at least partially responsible, for the state of the economy, so when the economy is strong, people are more likely to reward the incumbent president with reelection. When the economy is weak, on the other hand, punishing the president at the polls is an obvious option people can take.23 If the seat is open, as it was in 2016, people base their predictions on the parties’ images and on what the candidates project concerning economic policy.
 Description
Figure 8-8 Presidential Vote and Attitude Toward Abortion, 2020
Source: 2020 American National Election Studies, available at www.electionstudies.org.
 Description
Figure 8-9 Presidential Vote and Attitude Toward Government Efforts on Global Warming, 2020
Source: 2020 American National Election Studies, available at www.electionstudies.org.
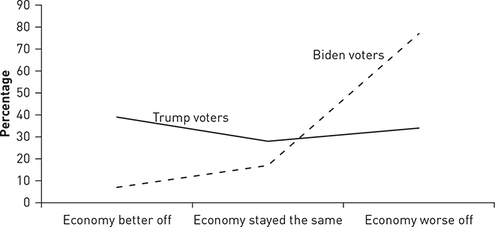
The sitting president in 2020 faced a particularly difficult economic hurdle, the havoc wreaked by the COVID-19 crisis. In an effort to stop the spread of the virus, many states and localities issued mask and stay-at-home orders. People stopped traveling, eating at restaurants, shopping at local stores, and participating in many other activities that keep the economy strong. Because of the lack of business, many people were furloughed or laid off. The economy tanked. Figure 8-10 shows how perceptions of the state of the economy were related to people’s vote choice. Trump voters were fairly evenly divided, with 39 percent thinking the economy was better off than one year earlier, 28 percent thinking it had stayed about the same, and 34 percent thinking it was worse off. Biden voters were not nearly so positive. Over three-quarters thought the economy was worse off than a year earlier, and only 7 percent thought it was better off. People who supported Trump clearly wanted to put a more positive spin on the economy, just as Biden supporters wanted to put a more negative spin on the same situation. The bottom line, though, is that Trump faced a difficult economic situation when he ran for reelection, and even his voters could not put a highly positive spin on it.
 Description
Figure 8-10 Presidential Vote and Perceptions of the National Economy, 2020
Source: 2020 American National Election Studies, available at www.electionstudies.org.
The second and related issue of the 2020 campaign, of course, was the pandemic. Donald Trump used the bully pulpit of the presidency to downplay the COVID-19 virus and to play up the idea that people needed to get back to life as normal. Trump’s main concern was getting the economy back on track, and if people would only keep doing what they normally did, businesses and the economy would bounce back quickly. The president therefore claimed that the virus would simply disappear, refused to wear a mask, and frequently ridiculed his experts in the Centers for Disease Control and Prevention for their calls for restrictions to limit the spread of the virus. He promised more of the same if he were reelected. Joe Biden, in contrast, supported a stricter COVID-19 response, including mask wearing, limiting crowd sizes, and closing businesses to in-person traffic. He severely limited his campaigning to online meetings or extremely small, socially distanced gatherings, and emphasized that everyone should take these steps in the hope that getting the virus under control would be better for the economy in the long run. Biden said that if elected, he would follow the advice of scientists, who strongly supported the need for greater restrictions to get the virus under control.
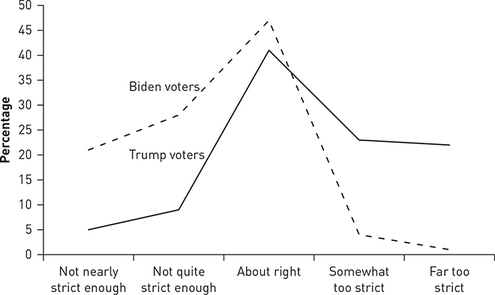
Not surprisingly, Trump and Biden voters differed in their views on the role of science in decisions about COVID-19 and in what they thought of the restrictions put in place to combat the spread of the virus. When asked how important it was to base COVID-19 decisions on science, most Americans readily agreed that doing so was very or extremely important, but there were large differences between Biden and Trump voters. Almost all Biden voters (94 percent) thought it important to have scientifically based COVID-19 decisions, compared to 58 percent of Trump voters. Biden and Trump voters differed as well in their reactions to the restrictions put in place to try to prevent the spread of the virus. Figure 8-11 shows the extent to which Americans thought the COVID-19 restrictions were too lenient or too strict. Similar percentages of Trump and Biden voters thought the restrictions put in place were about right. However, almost half of Biden voters thought the restrictions were not strict enough whereas almost half of Trump voters thought they were too strict. Not surprisingly, Biden voters disapproved (97 percent) whereas Trump voters approved (85 percent) of the president’s handling of COVID-19.
 Description
Figure 8-11 Presidential Vote and Attitude Toward COVID-19 Restrictions, 2020
Source: 2020 American National Election Studies, available at www.electionstudies.org.
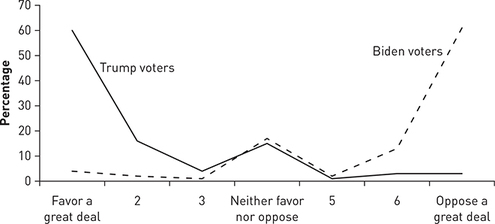
The third major issue was immigration, a continuation from 2016. Donald Trump promised throughout his first campaign to crack down on illegal immigration, deport people who were in the United States illegally, build a wall along the southern border of the United States, and not support amnesty for people already in the United States. Hillary Clinton promised comprehensive immigration reform and highlighted a path to citizenship for undocumented immigrants in the United States.24 During the four years of the Trump presidency, immigration remained a hot issue. President Trump decreased the number of refugees and immigrants given permanent residency visas and increased the number of people given temporary work visas; continued the rate of deportations established in the last two years of the Obama administration, although there was a significant increase in the number of detentions at the border in 2019; and dedicated resources to build 450 miles of wall on the southern border of the United States.25 Joe Biden, like Clinton four years earlier, promised immigration reform. He also promised to overturn Trump’s immigration policies if elected, including ending Trump’s policy of separating parents and children at the border and reinstating the Deferred Action for Childhood Arrivals (DACA) program.26 The building of the wall on the border with Mexico starkly divided voters in 2016 and continued to do so in 2020, as seen in Figure 8-12. About 60 percent of Biden voters opposed building the wall a great deal, and the same percentage of Trump voters favored building the wall a great deal.
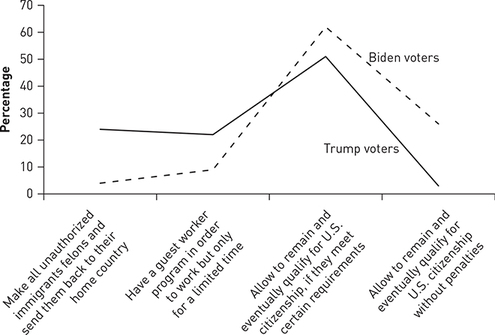
Attitudes toward immigration are more nuanced than the wall findings suggest. When people were asked to choose their preferred policy among four options, Biden and Trump voters differed, but a majority in both camps preferred the option of allowing undocumented immigrants to remain in the United States and eventually qualify for citizenship if they met certain requirements such as paying back taxes, learning English, and passing background checks. Figure 8-13 shows that 62 percent of Biden voters and 51 percent of Trump voters chose this option. The agreement on the preferred policy concerning how to treat immigrants currently in the United States suggests a pathway for immigration reform.
 Description
Figure 8-12 Presidential Vote and Attitude Toward Building a Wall on the Mexico Border, 2020
Source: 2020 American National Election Studies, available at www.electionstudies.org.
 Description
Figure 8-13 Presidential Vote and Attitude Toward Unauthorized Immigrant Policy, 2020
Source: 2020 American National Election Studies, available at www.electionstudies.org.
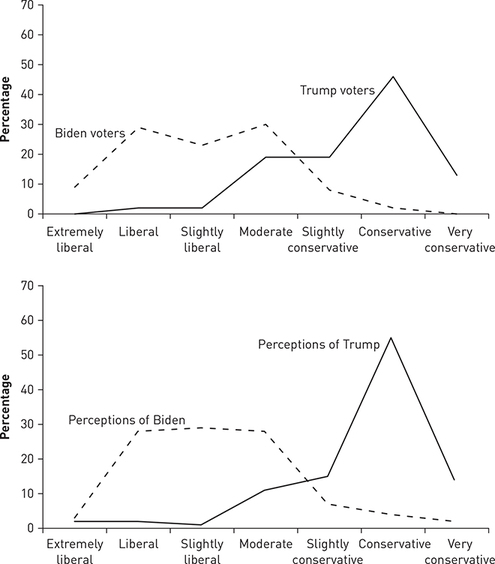
Figure 8-14 looks at vote choice in a somewhat different manner by illustrating the differences in the ideological positions of Biden and Trump voters (similar to what we did with issue stands) as well as the electorate’s perceptions of the ideological positions of Biden and Trump. In the 2020 ANES survey, voters were asked about their own ideological position using a 7-point scale ranging from extremely liberal to extremely conservative. The distributions in the top half of Figure 8-14 indicate the ideological self-placements of Biden and Trump voters. They show that a large plurality (46 percent) of Trump voters classified themselves as conservatives, with others seeing themselves as anywhere from moderate to extremely conservative. Biden voters were more evenly spread out across liberal, slightly liberal, and moderate.
The ANES also asked respondents to indicate how liberal or conservative they thought the two candidates were using the same 7-point ideology scale. The bottom half of Figure 8-14 shows that people generally thought Biden was liberal, but not extremely so, and that Trump was conservative. The two frequency distributions in the top and bottom of the figure look very similar. This makes sense. Americans tend not to be extremely ideological, and partisans have sorted themselves over recent years such that liberals tend to identify with and vote for Democrats and conservatives tend to identify with and vote for Republicans. The pattern in the bottom half of the figure, however, hides large differences in perceptions among partisans (data not shown). Trump voters overwhelmingly thought Biden was extremely liberal (42 percent) or liberal (38 percent), and Biden voters overwhelmingly thought Trump was extremely conservative (45 percent) or conservative (26 percent). People were much more likely to view their own candidate as more ideologically tame.
 Description
Figure 8-14 Vote for President According to Voters’ Ideological Identification and Perceptions of the Candidates’ Ideology, 2020
Source: 2020 American National Election Studies, available at www.electionstudies.org.
A number of factors must be present for issues to have an impact on vote choice. First, voters must be informed and concerned about an issue; second, candidates must take distinguishable stands on an issue; and third, voters must perceive the candidates’ stands in relation to their own. These conditions often are not achieved, especially the first. In 2020, 16 percent of Americans had no opinion on the issue of cutting government services and spending versus increasing government spending and services, a key aspect of Biden’s platform. Voters may also misperceive the candidates’ positions. For example, quite a few voters misperceived Biden as an extreme conservative or Trump as an extreme liberal on the government services question.
A weak relationship between an individual’s issue positions and vote choice may result from the fact that the analyst chooses the issues for analysis, and these might be issues that are not important to the individual. People who vote on the basis of agricultural policy but are never asked about this issue in a survey will appear not to be issue voters when they actually are. If voters are allowed to define what they see as the most important issue, a somewhat stronger relationship between their position on issues and voting decisions is found.27 Another problem with the generic approach to issue voting is that candidates are strategic actors who play up (or try to ignore) certain issues if doing so will win votes. Lynn Vavreck found that incumbent party candidates talk a lot about the economy when it is strong, whereas challengers talk a lot about the economy when it is weak. It is strategically advantageous for both sides to do so.28 Candidates even pivot toward or away from these kinds of positions during presidential debates.29 The bottom line is that although many voters lack opinions on issues or on the candidates’ positions, those who do have opinions show considerable consistency between issue positions and vote choice.
Putting It All Together: Predicting Vote Choice
The preceding sections considered candidate image and issues as short-term forces that either reinforce or deflect voters from their long-term party loyalty. An interesting, but far more difficult, question is the relative impact of these factors on vote choice. Because all these factors are strongly interrelated and almost certainly influence each other, disentangling their effects using the kinds of data available in nationwide surveys is difficult, but we give it a try using binary logistic regression. We include the long-term factors of gender, race, age, and education along with party identification, as well as short-term factors, including both policy stands and candidate image. The numbers in Table 8-4 are the odds ratios, which basically indicate the impact of the variable on the probability of voting for Biden rather than Trump while holding everything else equal. Odds ratios of 1 indicate a 1-to-1 probability of voting for Biden or Trump, which means the variable doesn’t help us predict for whom people would vote. Odds ratios over 1 show a net gain for Biden, and odds ratios under 1 show a net gain for Trump. The further away from 1 the odds ratio is, either higher or lower, the stronger an impact the variable has in predicting a vote for Biden or Trump. The numbers in bold are significant, meaning we can be fairly certain they have an impact on predicting vote choice. We include three different models: the first column of numbers includes just the long-term factors; the second column of numbers includes both the long-term factors and people’s policy stands; the third column of numbers has all of the variables, including candidate image.
Starting with Model 1, Table 8-4 shows that all of the long-term factors except the respondent’s gender are significant predictors of vote choice when they alone are in the model. White people were significantly less likely to vote for Biden (the odds ratio is below 1) and Black people were significantly more likely to vote for Biden (the odds ratio is above 1) compared to other people of color (the excluded category). Older people were significantly less likely to vote for Biden, all else equal. The odds ratio is 0.99 but is significant. It’s important to keep in mind that the odds ratio is the impact of a one-unit change in the independent variable (age in this case) on a vote for Biden, so each year older a person is increases the likelihood of voting for Trump. More education increased votes for Biden. The best predictor of these long-term factors, though, was party identification. As we saw earlier in Table 8-1, partisans tended to vote for their party’s candidate. When holding all of the other variables in Model 1 equal, moving each unit toward strong Republican (say from independent-leaning Republican to not-so-strong Republican) decreased the odds of voting for Biden by 0.30 to 1. Essentially, there was very little risk that a strong Republican would vote for Biden.
In Model 2 of Table 8-4, we introduce issues that are either issues that play a role in just about every election (the state of the economy and government spending to help Black Americans) or issues more specific to the Trump presidency and the 2020 election (the border wall, climate change, and COVID-19 restrictions). All of these issues were significant predictors of vote choice. The more people thought the economy was doing well, and the more they wanted the United States to build a wall at the Mexican border, the more likely they were to vote for Trump. People who wanted more assistance for Blacks, more government action on climate change, and stricter COVID-19 restrictions were more likely to vote for Biden. Note that the long-term factors become less predictive of vote choice when policy stands are taken into account. For example, if the differences between white and Black people are largely based on their different stands on policies, then the stands on policies explain their vote choice, not the color of their skin.
In the last model, Model 3, we add candidate image as an explanatory variable. We created a candidate image scale for Biden and for Trump by adding up responses for each candidate on the four traits of leadership, caring, knowledgeability, and honesty. The scales range from 4 (extremely negative) to 20 (extremely positive). Trump’s and Biden’s image had a very large impact on the probability of voting for the candidate. A one-unit move in the candidate image score (say from 11 to 12) increased the odds of voting for the candidate by 30 percent. This was true for both Biden and Trump. Party identification, age, and some of the policy stands remain significant predictors of vote choice, even with Biden and Trump image included.
Table 8-4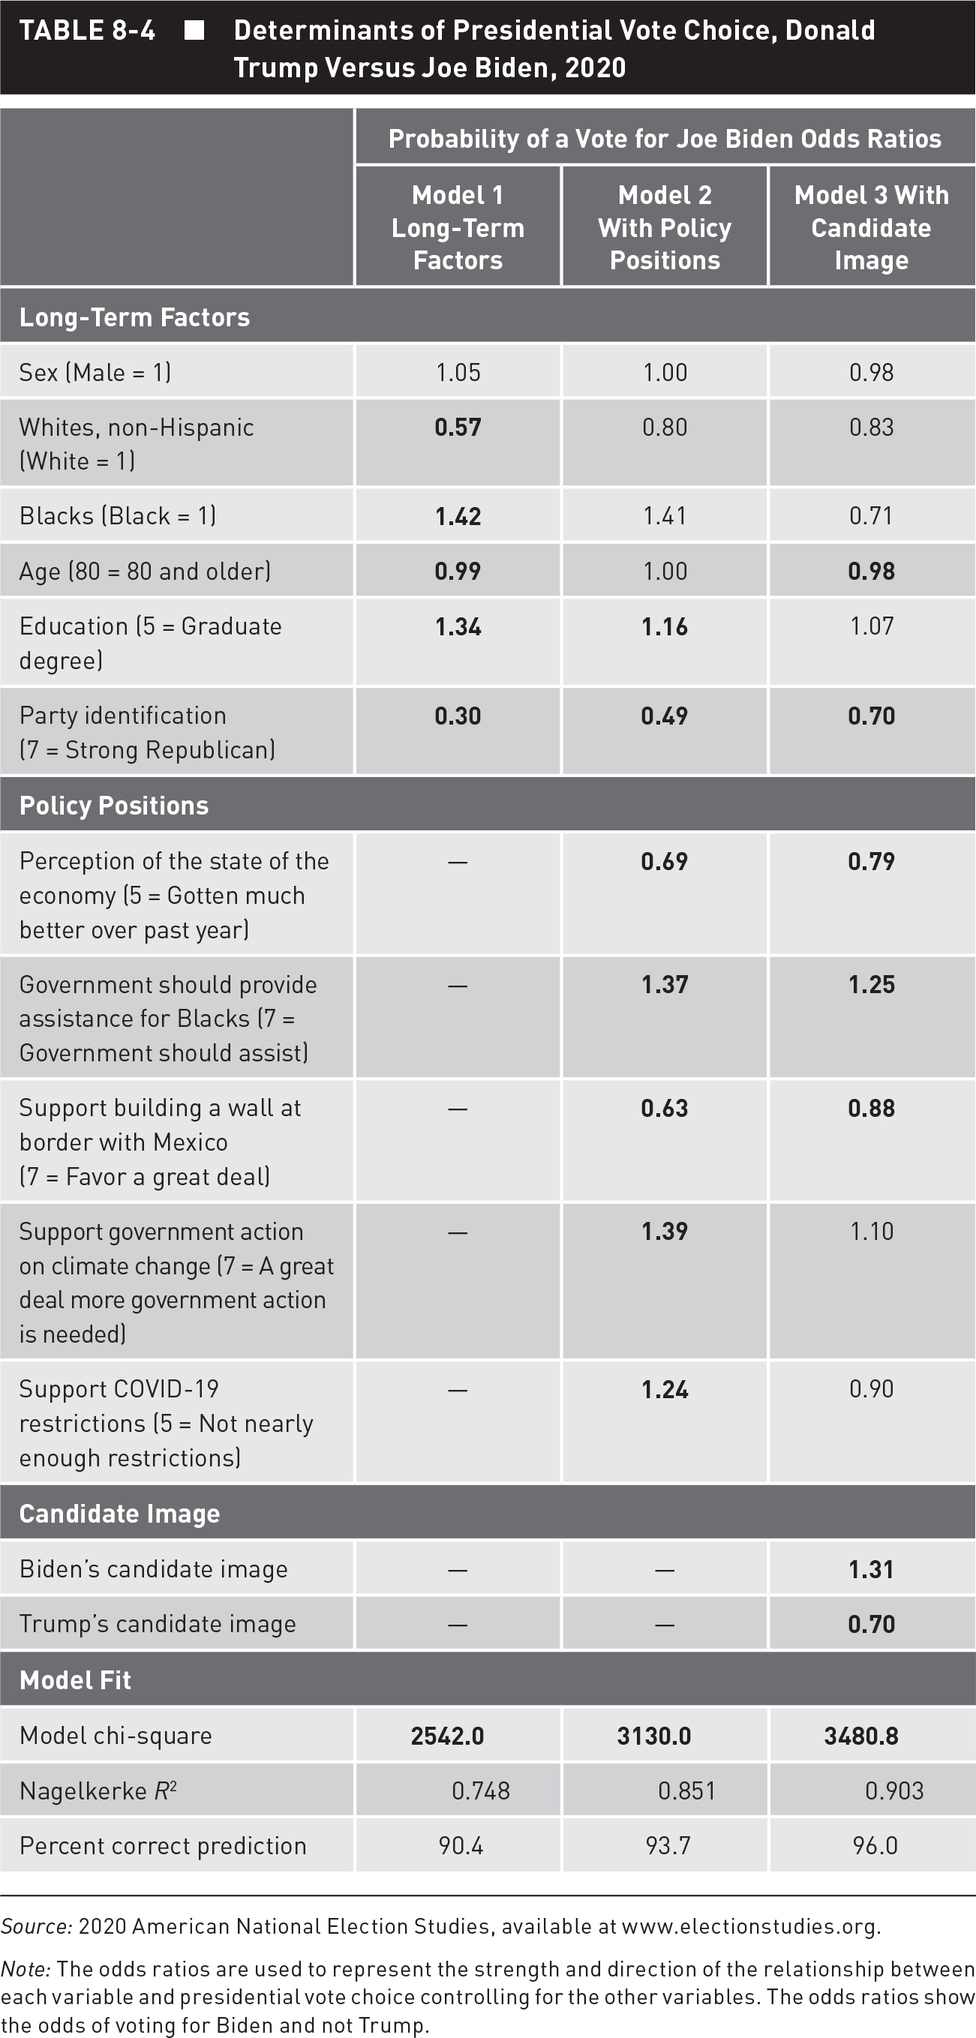
Source: 2020 American National Election Studies, available at www.electionstudies.org.
Note: The odds ratios are used to represent the strength and direction of the relationship between each variable and presidential vote choice controlling for the other variables. The odds ratios show the odds of voting for Biden and not Trump.
THE POPULAR VOTE AND THE ELECTORAL COLLEGE
One aspect of the American electoral system that often raises questions is the Electoral College. If one requirement of a democracy is a reasonably faithful translation of popular votes into governmental control, then the Electoral College is a potential impediment to democracy. (See Chapter 2 for further discussion of the Electoral College as an electoral structure.) When voters cast a ballot for president in the November election, they are actually casting a ballot for that party’s slate of electors, which was certified months before by the party’s formal submission of the slate to a state official.
The framers wrote the Electoral College into the Constitution as a compromise between those who wanted the president to be popularly elected and those who wanted Congress to choose the president. Under the constitutional system adopted in 1787 and amended in 1804, the president is selected by the Electoral College, with each state having electoral votes equal to the combined seats that it has in the U.S. House of Representatives and Senate. The Electoral College is currently made up of 538 electors who, on the first Monday after the second Wednesday in December, meet in their respective states and cast their votes for president and vice president. Political parties in each state are the organizations in charge of selecting a slate of electors for their candidate. These electors are most often dedicated, loyal party activists who are motivated to do what the party wants.
In forty-eight states and the District of Columbia, the electors for the winner of the popular vote in the state are appointed as the state’s electors. That is, the winner-take-all feature means that the state’s electors are all from the winning party, even if the popular vote margin was small. Only two states, Nebraska and Maine, have a proportional system. The party of the statewide winner gets to appoint two electors. The rest of the state’s delegation is determined by which presidential candidate wins each of the congressional districts. In 2020, Maine’s overall vote was for Joe Biden, but one of its congressional districts voted for Biden and the other for Donald Trump. Maine’s Electoral College delegation therefore consisted of three electors chosen by the state’s Democratic Party and one elector chosen by the state’s Republican Party. Nebraska similarly split its Electoral College vote in 2020: the state overall voted for Trump, as did two of its three congressional districts. One congressional district, covering the city of Omaha and the surrounding area, voted for Biden. Of Nebraska’s five Electoral College electors, four were chosen by the state’s Republican Party, and one was chosen by the state’s Democratic Party.
While no federal law requires electors to vote for the state’s popular vote winner, some states have laws on the books that require electors to cast their votes for the winner, or they allow the political parties to require a pledge from electors to vote for the winner. So-called faithless electors, those who vote for someone other than the winner, can be fined according to some of these laws, but no state has made an elector pay a fine. Since electors are chosen by the party and are considered loyal to the party, the number of faithless electors is small. In 2020, all of the electors voted for the candidate who won their state (or congressional district in Maine and Nebraska). Most presidential elections have no faithless electors, although elections occasionally have one elector vote for someone other than the winner.30
After the electors have met in each state and cast their votes, the “Certificate of Vote” from each state is sent to Congress, which, in a joint session on January 6, tallies the votes. The president of the Senate, who is the sitting vice president, declares who has been elected president and vice president.31 A majority of the electoral votes is required to elect a president—270 electoral votes at this time. Normally this process is a quiet affair that simply continues the process of formalizing the public votes cast in November and the electoral votes cast in December. This process was anything but quiet on January 6, 2021, and the United States has never before experienced in its history an insurrection such as occurred on that day.
The Electoral College is certainly an oddity in American politics, but it most often does not lead to results that differ from the popular vote. There have, however, been five elections in which the popular vote winner did not win the Electoral College vote and therefore did not become president: 1824—Andrew Jackson beat John Quincy Adams in both the Electoral College and the popular vote, but because no candidate received a majority of the Electoral College vote, the House of Representatives made the decision to make Adams president; 1876—Republican Rutherford B. Hayes won the Electoral College by 1 vote, and Democrat Samuel Tilden won the popular vote by more than 250,000 votes; 1888—Republican Benjamin Harrison won the Electoral College by 65 votes, while Democrat Grover Cleveland won the popular vote by more than 90,000 votes; 2000—Republican George W. Bush won the Electoral College by 5 votes, and Democrat Al Gore won the popular vote by more than 540,000 votes; 2016—Republican Donald Trump won the Electoral College by 77 votes, while Democrat Hillary Clinton won the popular vote by over 2.8 million votes.
To understand how the Electoral College could produce a winner who is not the popular vote winner, it is important to remember that all states (except Maine and Nebraska) use a winner-take-all procedure for deciding who wins the states’ electoral votes. In other words, it does not matter whether a candidate wins the state narrowly or by a wide margin—all of the electoral votes go to the winner. If one candidate wins many states narrowly and the other candidate wins states by a wide margin, the first candidate can win in the Electoral College vote while the second candidate can have more popular votes. This occurred in 2016, when Hillary Clinton won by large margins big states such as California (Clinton 61.5 percent, Trump 31.5 percent) and New York (Clinton 59 percent, Trump 36.5 percent), accumulating a huge number of popular votes, while Trump won some big states, such as Florida, narrowly (Trump 48.6 percent, Clinton 47.4 percent), along with many small states. Since every state is assigned two electoral votes to represent its seats in the U.S. Senate, each electoral vote in a small state represents fewer voters than in a large state. In 2016, each electoral vote in Wyoming represented 149,305 potential voters, and in California, each electoral vote represented 559,696 potential voters.32 Overall, Clinton won 65,853,625 votes (48.0 percent) to Trump’s 62,985,106 votes (45.9 percent), but Trump won 306 electoral votes to Clinton’s 232.
The presidential election of 2020 led to the popular vote and the Electoral College vote choosing the same winner. Joe Biden won 51.3 percent (81,283,361 votes) and Donald Trump won 46.8 percent (74,222,960 votes) of the popular vote, with the remaining votes going to third-party candidates. The Electoral College similarly went to Biden, 306 votes to 232 votes.33
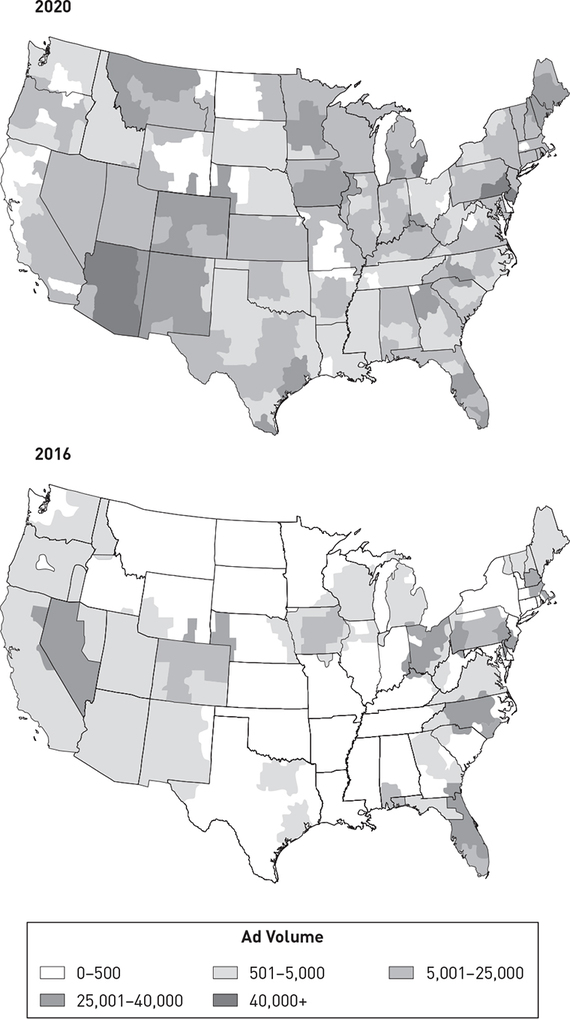
Although only rarely does the Electoral College produce a winner who has not won the popular vote, the consequences of a winner-take-all system are well known to campaign strategists in presidential elections. The Electoral College arrangement strongly influences presidential campaign strategy. The closer the expected margin in a state and the larger the number of electoral votes available, the more resources the campaigns will put in the state, and the more aggressively the candidates will attempt to respond to the political interests in the state. These are the battleground states, where both candidates have a chance to win and much is at stake. In contrast, safe states are relatively unimportant to both candidates in a general election campaign—taken for granted by one and written off by the other—although they may be visited by one or both candidates to raise funds to spend in competitive states. This strategy clearly played out in both 2016 and 2020, as can be seen in Figure 8-15, which shows the quantity of ads aired in each state.34 In 2016, television ads supporting Trump or Clinton were almost exclusively aired in the swing states. States that were safe for one candidate or the other were virtually, if not completely, ignored. In 2020, the main thing that stands out is the higher rate of advertising across the country (see also Chapter 2). According to the Wesleyan Media Project, 2020 was a “record shattering” year for ad volume.35 Even given the overall higher ad volume, though, a pattern still emerges: the areas getting the most election ads were in competitive states: Arizona, Georgia, Michigan, and so on.
The fact that the Electoral College is not very democratic was not a concern for the founders; most of them were wary of too much democracy and approved the idea of state legislatures selecting the electors. Whenever there is a clash between the popular and Electoral College vote, calls for change become louder. Over the years, proposals have been put forth to change or abandon the Electoral College.36 Some proposals are modest, such as getting rid of the slate of electors (who occasionally do not vote the way they are pledged) and having each secretary of state simply certify the state’s electoral votes.
 Description
Figure 8-15 The Strategic Placing of Ads in Swing States, 2016 and 2020
Source: Wesleyan Media Project, https://mediaproject.wesleyan.edu/releases-102920/#fig1.
The most sweeping proposal, and the one most commonly discussed by political commentators, is electing the president in a nationwide popular election and getting rid of the Electoral College. This is an obvious alternative method of selecting the president, answering the main criticism of the Electoral College—the potential that the popular vote winner is not the Electoral College winner. A nationwide popular election, however, has problems of its own. It is generally believed that a national popular election would attract more and more candidates—third-party candidates, independent candidates, and major-party candidates who failed to get their party’s nomination. Candidates with a small but crucial constituency could threaten to take votes away from the major-party nominees as a way to win concessions. But presumably more candidates would stay in the race to demonstrate their strength, so gradually the percentage of the vote needed to win would shrink. The popular vote winner could have 35 percent or 25 percent of the total vote, and arguably this would undermine the legitimacy of the winner. As a consequence, most proposals for a national popular election have included provisions for a run-off election if the winner’s percentage was below, say, 40 percent. The prospect of two presidential elections and the political maneuvering associated with run-off elections has reduced enthusiasm for making such a change.
The current interest in adopting an instant run-off, also known as ranked-choice voting, in some local and state elections offers a possible solution. Under instant run-off arrangements, if there are more than two candidates in a race, voters rank their preferences among them. When the votes are counted, the candidate with the fewest number of votes is eliminated, and the second choices of the voters who voted for the eliminated candidate are then counted and added to those candidates’ totals. This process is continued until one candidate has a majority (50 percent plus one) of all votes cast. Such a system would produce a majority winner without a run-off. There are a number of objections that have been raised against instant run-off, but several large cities, including San Francisco and Minneapolis, and the state of Maine have adopted ranked-choice voting for some elected positions.37 If these experiments prove the approach is workable, it might answer some of the perennial concerns about a direct popular vote for president.
Two other proposals have been advanced that would not require a constitutional amendment, although a constitutional amendment would be required to adopt them uniformly across the country. The district method, now used in Maine and Nebraska, could be adoped more broadly. The proposal does not eliminate the winner-take-all characteristic, but it does allow for a distribution of electoral votes that is more reflective of the popular vote. Maine started using the district method in 1972 and has divided its Electoral College vote twice (in 2016 and 2020). Nebraska started using the district method in 1991 and has also divided its vote twice (in 2008 and 2020). Some Republicans in the Nebraska state legislature, unhappy with this outcome, have introduced legislation several times to go back to the winner-take-all system but have been unsuccessful thus far in getting this legislation passed.
An alternative, the proportional method, would allocate all of the electoral votes on a statewide basis but proportionally instead of to the plurality winner. Given the typical margin of victory in the popular vote in a state, a winning candidate would be unlikely to gain more than a one-vote electoral margin from a state using the proportional method. No individual state is likely to adopt this method because the state would become much less strategically attractive to presidential candidates.
For years, political scientists and some political commentators predicted that the Electoral College would be immediately abandoned if, in the modern age, it produced a non–popular vote winner. Why, then, has so little happened to jettison the Electoral College since the 2000 election? A major part of the answer is that any major changes to the Electoral College system would require a constitutional amendment, and small states have no interest in getting rid of a system from which they benefit. Another reason is that politicians and campaign managers at least understand how the current system affects their candidates, even if they think it is flawed. Many alternatives have been aired, but some question the sense of trying to game the Electoral College system for electoral advantage. Former Republican Speaker of the Florida House Will Weatherford said, “To me, that’s like saying in a football game, ‘We should have only three quarters, because we were winning after three quarters and they beat us in the fourth.’ I don’t think we need to change the rules of the game, I think we need to get better.”38 State legislatures are reluctant to change Electoral College rules because a rule change that benefits the majority party one year could end up hurting the party in a following year. Most people agree that the Electoral College system has major problems, including electing the less popular candidate, but there is no agreement on a clean fix, and the two major parties do not want to alter the system in a way that will hurt their party in the future.
VOTE CHOICE IN OTHER TYPES OF ELECTIONS
In voting for members of Congress, most of the electorate has relatively little information about the candidates, especially candidates challenging incumbents. A major determinant of votes, then, is party identification. People are likely to know the party of the candidates or to see the party designation on the ballot, making party-line voting much stronger in less visible races, including Congress. Another significant factor in congressional elections is incumbency. Studies have shown that voters are about twice as likely to be able to identify the incumbent as the challenger in congressional races, and almost all the defections from partisanship are in favor of the more familiar incumbent.39 Both Republicans and Democrats have historically been susceptible to voting for incumbents, especially in the early 1980s when party-line voting dropped to 70 percent in House races and voting for the incumbent of the out-party increased, but the pull of partisanship has grown stronger with the increase in polarization over the recent past.40 Party-line voting for House races in 2020, according to ANES data, was about 80 percent for weak partisans and 90 percent for strong partisans.
The advantage that incumbents have does not mean that congressional districts are invariably safe for one party, though most are. Instead, it suggests that even if districts were virtual toss-ups in open-seat races, the representatives who manage to survive a term or two find reelection almost ensured. This tendency becomes accentuated as the opposition party finds it increasingly difficult to field an attractive candidate to challenge a secure incumbent. Thus, many incumbent representatives are elected again and again by safe margins. This tendency is exacerbated by the partisan drawing of district lines after the census is completed every ten years.
A Senate election has relatively high visibility and is more likely to gain heavy media attention, unlike most House races. The more information about the election that gets through to the voters, the less they rely on either partisanship or the familiarity of the incumbent’s name. The visibility of a Senate race makes an incumbent senator more vulnerable to a well-financed campaign by an attractive opponent.
Despite the advantages of incumbency, national electoral tides can make enough of a difference in enough districts to change the balance of power in one or both houses of Congress. Which party controls the houses of Congress matters. The majority party not only has more people in the chamber who are predisposed to vote for its legislation, but it also controls leadership positions, rules, and procedures that have a major impact on the day-to-day operations of Congress and, ultimately, the passage of legislation. Elections that shift the party control of the House or Senate are therefore key to understanding politics in the United States.
After years of stability in the party control of the two houses of Congress, especially the House, recent elections have introduced a great deal of volatility. In 2014, Republicans maintained their control of the House and also won the Senate. In 2016, the status quo held with the Republicans retaining control of both chambers. The 2018 midterms shifted control of the House back to the Democrats, but the Republicans held the Senate. The 2020 elections did nothing to dispel the notion that we are living through volatile times. The Democrats retained control of the House but lost seats, making their majority the tightest House majority since 2001. In the same election, Democrats won three seats in the Senate, making it a 50 (Democrats and independents) to 50 (Republicans) split. Because the sitting vice president has the power to cast tie-breaking votes in the Senate, the fact that Democrat Kamala Harris was elected vice president in 2020 meant that the Democrats officially controlled the Senate.
Even with all of this volatility in control of the House and Senate, the bottom line is that incumbents get reelected at extremely high rates. In 2020, 95 percent of House incumbents and 84 percent of Senate incumbents were reelected.41 These high reelection rates are not unusual, but they might be surprising given people’s feelings about Congress. When people were asked by Gallup if they approved or disapproved of the job Congress was doing prior to the election, only 19 percent said they approved. Over three-quarters of Americans said they disapproved. Americans clearly do not like what Congress is doing, and it would make perfect sense to “throw the rascals out.” Why, then, are so many members of Congress reelected when people are so dissatisfied with Congress? Richard Fenno Jr. has pointed out the interesting paradox that people hate Congress but love their own member of Congress. Members of Congress take great pains to make sure their constituents are happy, including cultivating trust and being seen as “one of us.”42 John Hibbing and Elizabeth Theiss-Morse questioned what it is about Congress that people hate. They found that most Americans approve of Congress as an institution (88 percent) but are highly disapproving of the members of Congress, the 435 House members and the 100 Senators. Only 24 percent approved of the members of Congress.43 People might like their own representative and senators, although even this has declined in recent years, but they heartily dislike the other members of Congress. They are limited, though, in being able to vote only for or against their own representatives. This helps explain why reelection rates remain so high even though people are so thoroughly disgusted with Congress.
THE MEANING OF AN ELECTION
Politicians and news commentators spend much time and energy interpreting and explaining the outcome of an election. The most important element is usually clear—the winner—although in 2020 the claims made by some top Republicans, including Trump, that the election was stolen raised doubts in many Republicans’ minds. Accepting election results when there is no evidence of fraud is an essential aspect of living in a democracy. Nevertheless, analysts and the public in general often try to discover the policy implications of patterns of voting and to read meaning into the outcome of elections. This effort raises two problems for analysis: first, the issue content of the voters’ decisions and, second, the policy implications of the winning and losing candidates’ issue stands.
It is very difficult to establish that the voters’ preferences have certain policy meanings or that the votes for a particular candidate provide a policy mandate. After all, people do not mark on their ballot “Trump, anti-immigration, and opposed to government spending on services.” The only information they provide is the vote they cast for a particular candidate and not why they voted that way. Several obstacles lie in the way of stating simply what policies are implied by the behavior of the voters. In many elections, the voters are unaware of the candidates’ stands on issues, and sometimes the voters are mistaken in their perceptions. Furthermore, many voters are not concerned with issues as such in a campaign but vote according to their party loyalty or a candidate’s image. As John Sides points out, voters “choose a candidate based on party or whatever, and then line up their views on issues to match the candidates.”44 Voters who supported Reagan in 1980 had an unfavorable view of Carter’s performance as president, especially his handling of the Iran hostage crisis. The dissatisfaction with Carter was clear enough. However, the expectations about Reagan were vague and perhaps limited to the hope that he would strengthen national defense and balance the budget. Reagan’s supporters came around to support his issues, but not liking Carter and liking Reagan were the bigger drivers behind people’s votes in 1980. In 2020, people who voted for Trump were very pro-Trump, but people who voted for Biden were primarily anti-Trump. That is, people either loved Trump or hated him, and their votes reflected these reactions.45 What this doesn’t tell us is what issue mandate was given to Biden when he won the election. He could easily not be Trump, because he is not, but what did voters want him to do over the next four years?
The extent to which mandates occur depends more heavily on politicians than on voters.46 Newly elected presidents, especially those who win decisively, play up the idea that the voters gave them a mandate to pursue their policy interests. They quickly push their policy agenda in Congress, usually trying to get as much done as possible in the first one hundred days, because it is during this period that members of Congress are still trying to figure out what message the voters were sending. When members of Congress perceive election returns to be significant, they are more willing to change their voting behavior to go along with the new president’s agenda. This does not happen often—clear cases are Johnson’s election in 1964 and his Great Society policy agenda, Reagan’s election in 1980 and the subsequent Reagan Revolution, and the 1994 congressional elections putting in place the Contract with America—but when it does, policy changes are dramatic. The window of opportunity is narrow, and most elections are not perceived to be significant, but at times mandates do happen. Did a mandate happen in 2020? Americans gave Biden a decisive win in the election, both in popular and Electoral College votes, but they were and continue to be deeply divided in their issue stands and in their visions of what kind of country they want the United States to be. Many people voted for Trump because he was not the usual politician, but seven million more voted for Biden, a long-serving politician and Washington insider. In his first hundred days in office, Biden moved ahead as if he had a mandate, whether he actually did or not. This is what new presidents have to do if they want to get their policies in place.
One factor that can help new presidents is their popularity with the general public. Presidents can use their popularity to let members of Congress know what a mistake it would be to vote against their policy agendas. Presidents tend to have higher approval ratings right after an election, although Trump’s election in 2016 did not spark the usual “give him a chance” attitude among many people. As Figure 8-16 shows, Obama left office with almost 60 percent approval, after climbing from a low point in mid-2014. Trump started his term with an approval rating of 45 percent, the lowest approval rating of any newly inaugurated president since the time Gallup started asking its approval question. Because of his low approval, Trump had less leverage to use when trying to get his policy initiatives passed in Congress even though he had a Republican Congress with which to work. Biden began his presidency with an approval rating of 57 percent—much higher than Trump’s but lower than most new presidents’.47 In these highly polarized times, Biden will need to be a skilled politician to get his agenda passed. He would need to be a miracle worker to unite Americans.
American elections are hardly a classic model of democracy with rational, well-informed voters making dispassionate decisions. Yet American elections provide an acceptable opportunity for parties and candidates to attempt to win or hold public office. Despite the polarization in the United States today, a sizable portion of the electorate is moderate or unconcerned about ideology and lacking in firm partisan attachments. For the present at least, this segment of the electorate holds the key to electoral victory. The political parties, their officeholders, and their candidates ignore this situation at their peril.
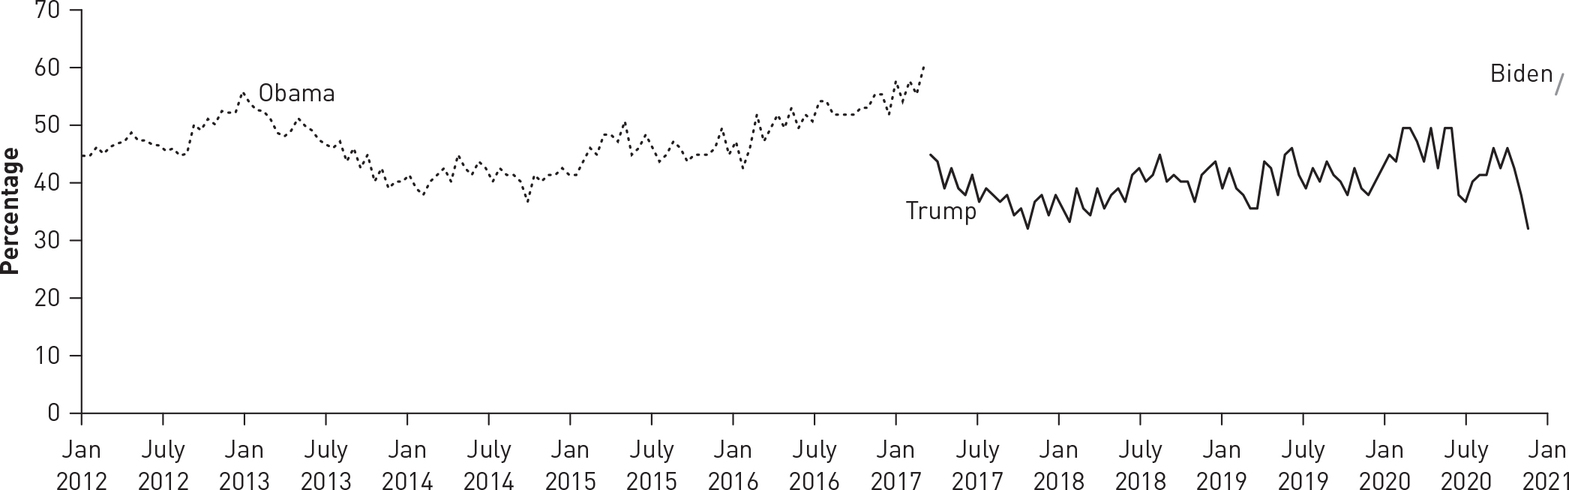 Description
Figure 8-16 Approval Ratings of Presidents Obama, Trump, and Biden, January 2012–May 2021
Sources: “President Obama: Gallup Daily Tracking,” PollingReport.com, http://pollingreport.com/obama_job1.htm; “President Trump: Gallup Daily Tracking,” PollingReport.com, http://pollingreport.com/djt_job1.htm; “Presidential Job Approval Center,” Gallup, https://news.gallup.com/interactives/185273/presidential-job-approval-center.aspx.
Study Questions
1. What explains why people vote the way they do? What has a bigger impact on vote choice: long-term or short-term factors?
2. Should Americans keep the Electoral College? What impact would the alternatives have on presidential election outcomes?
3. What explains votes in lower-level elections?
4. How should we interpret the meaning of the 2020 election? Did Americans give Joe Biden a clear mandate to lead?
Suggested Readings
Albertson, Bethany, and Shana Kushner Gadarian. Anxious Politics: Democratic Citizenship in a Threatening World. New York: Cambridge University Press, 2015. Excellent analysis of the impact of emotions on people’s consumption of news, reactions to issues, and overall support of the government.
Bartels, Larry M. Presidential Primaries and the Dynamics of Public Choice. Princeton, NJ: Princeton University Press, 1988. The best available analysis of public opinion and vote choice during presidential primaries.
Cramer, Katherine J. The Politics of Resentment: Rural Consciousness in Wisconsin and the Rise of Scott Walker. Chicago: University of Chicago Press, 2016. A deep and perceptive examination of rural identity and resentment of political elites.
Fiorina, Morris P. Retrospective Voting in American National Elections. New Haven, CT: Yale University Press, 1981. An important conceptual argument for viewing vote choice as judgments about the past.
Jacobson, Gary C. The Politics of Congressional Elections, 6th ed. New York: Longman, 2006. An authoritative survey of a broad topic and the literature surrounding it.
Lau, Richard R., and David P. Redlawsk. How Voters Decide: Information Processing in Election Campaigns. New York: Cambridge University Press, 2006. An innovative use of experiments shows how successful voters are at selecting the candidate closest to their own preferences.
Lewis-Beck, Michael S., William G. Jacoby, Helmut Norpoth, and Herbert F. Weisberg. The American Voter Revisited. Ann Arbor: University of Michigan Press, 2008. A rich reanalysis of the themes from the classic work, using mainly 2000 and 2004 data.
Mayer, William G., ed. The Swing Voter in American Politics. Washington, DC: Brookings Institution Press, 2008. A collection using several definitions of “swing voters” to analyze them currently and over time.
Niemi, Richard G., and Herbert F. Weisberg, eds. Classics in Voting Behavior. Washington, DC: CQ Press, 1993; Niemi, Richard G., and Herbert F. Weisberg, eds. Controversies in Voting Behavior, 4th ed. Washington, DC: CQ Press, 2001. These two collections offer the best readings from decades of research on public opinion and voting behavior.
Shanks, J. Merrill, and Warren E. Miller. The New American Voter. Cambridge, MA: Harvard University Press, 1996. A sophisticated analysis using an elaborate model of vote choice.
Internet Resources
The website of the American National Election Studies, www.electionstudies.org, has extensive data on topics covered in this chapter. Under the Resources menu, click “Guide to Public Opinion and Electoral Behavior.” Scroll down to “Evaluation of the Presidential Candidates,” “Evaluation of Congressional Candidates,” and “Vote Choice” for a variety of political items from 1952 to the present. In addition, all of these items can be broken down by social characteristics.
PollingReport.com and Gallup (https://news.gallup.com/topic/politics.aspx) have current political information on elections as well as public opinion data. Major news organizations like CNN and the New York Times post results of exit polls on their websites. Candidates for office, like the political parties, have websites that can be located with search engines.
NOTES
1. Presidential Job Approval Center, Gallup, accessed July 13, 2021, https://news.gallup.com/interactives/185273/presidential-job-approval-center.aspx.
2. Angus Campbell, Philip E. Converse, Warren E. Miller, and Donald E. Stokes, The American Voter (New York: Wiley, 1960), Chapter 2.
3. “ACS Demographic and Housing Estimates: 2019 American Community Survey 1-Year Estimates,” U.S. Census Bureau, accessed July 13, 2021, https://data.census.gov/cedsci/table?q=race&tid=ACSDP1Y2019.DP05&hidePreview=true.
4. Taeku Lee and Karthick Ramakrishnan, “Asian Americans Turn Democratic,” Los Angeles Times, November 23, 2012, http://articles.latimes.com/2012/nov/23/opinion/la-oe-lee-asian-american-voters-20121123. The vote percentages for Clinton in 2016 and Biden in 2020 were taken from the 2016 and 2020 American National Election Studies.
5. Sergio C. Wals, “Made in the USA? Immigrants’ Imported Ideology and Political Engagement,” Electoral Studies 32 (December 2013): 756–767.
6. Susan Heavey, “Republicans Aim to Rebrand Party, Attract Voters,” Reuters, March 18, 2013, http://www.reuters.com/article/2013/03/18/us-usa-republicans-idUSBRE92H0HL20130318; Katie Glueck, “Reince Priebus Hails College GOP Report,” Politico, June 3, 2013, http://www.politico.com/story/2013/06/reince-priebus-college-gop-report-92146.html; Ron Elving, “RNC Post-election Report a Line in the Sand for Divided GOP,” It’s All Politics, NPR, March 19, 2013, http://www.npr.org/blogs/itsallpolitics/2013/03/18/174689113/rnc-chairs-postmortem-report-a-line-in-the-sand-for-divided-gop.
7. To the astute reader, the numbers in Table 8-1 might look a bit different from the 2020 numbers in Table 5-3. The reason for this is that all independents, leaners and “pure,” are combined in Table 5-3, whereas they are separated out in Table 8-1.
8. “Would You Rather Have a Beer With Clinton or Trump?,” Rasmussen Reports, June 15, 2016, http://www.rasmussenreports.com/public_content/politics/elections/election_2016/would_you_rather_have_a_beer_with_clinton_or_trump.
9. Danny Hayes, “Candidate Qualities Through a Partisan Lens: A Theory of Trait Ownership,” American Journal of Political Science 49 (October 2005): 908–923.
10. Bethany Albertson and Shana Kushner Gadarian, Anxious Politics: Democratic Citizenship in a Threatening World (New York: Cambridge University Press, 2015); Ted Brader, Campaigning for Hearts and Minds (Chicago: University of Chicago Press, 2006); W. Russell Neuman, George E. Marcus, Ann N. Crigler, and Michael MacKuen, eds., The Affect Effect (Chicago: University of Chicago Press, 2007).
11. David A. Fahrenthold, Robert Costa, and John Wagner, “Donald Trump Is Sworn In as President, Vows to End ‘American Carnage,’” Washington Post, January 20, 2017, https://www.washingtonpost.com/politics/trump-to-be-sworn-in-marking-a-transformative-shift-in-the-countrys-leadership/2017/01/20/954b9cac-de7d-11e6-ad42-f3375f271c9c_story.html?utm_term=.adc527c1bb54.
12. Danny Hayes and Kimberly Gross, “Trump Makes More Voters Feel Bad Than Biden Does. That’s a Problem for the President,” Monkey Cage (newsletter), Washington Post (November 2, 2020), https://www.washingtonpost.com/politics/2020/11/02/trump-makes-more-voters-feel-bad-than-biden-does-thats-problem-president/. A heartfelt thanks to Danny Hayes for sharing the data on all of the emotions asked in the poll.
13. Joanne M. Miller and Jon A. Krosnick, “The Impact of Candidate Name Order on Election Outcomes,” Public Opinion Quarterly 62 (Autumn 1998): 291–330; Jonathan G. S. Koppell and Jennifer A. Steen, “The Effects of Ballot Position on Election Outcomes,” Journal of Politics 66 (February 2004): 267–281.
14. Lynn Vavreck, The Message Matters: The Economy and Presidential Campaigns (Princeton, NJ: Princeton University Press, 2009).
15. A good discussion of this topic in a single source is the collection of articles and commentary by Gerald Pomper, Richard Boyd, Richard Brody, Benjamin Page, and John Kessel in American Political Science Review 66 (June 1972): 415–470. See also Benjamin I. Page, Choices and Echoes in Presidential Elections (Chicago: University of Chicago Press, 1978).
16. Norman H. Nie, Sidney Verba, and John R. Petrocik, The Changing American Voter (Cambridge, MA: Harvard University Press, 1976), Chapter 10; see also Benjamin I. Page and Richard A. Brody, “Policy Voting and the Electoral Process: The Vietnam War Issue,” American Political Science Review 66 (September 1972): 979–995.
17. J. Merrill Shanks and Warren E. Miller, The New American Voter (Cambridge, MA: Harvard University Press, 1996).
18. James M. Snyder Jr. and Michael M. Ting, “An Informational Rationale for Political Parties,” American Journal of Political Science 46 (January 2002): 90–110; Jonathan Woon and Jeremy C. Pope, “Made in Congress? Testing the Electoral Implications of Party Ideological Brand Names,” Journal of Politics 70 (July 2008): 823–836.
19. Benjamin Highton, “The Contextual Causes of Issue and Party Voting in American Presidential Elections,” Political Behavior 32 (December 2010): 453–471.
20. “Party Platform: The 2020 Democratic Platform,” Democratic National Committee, accessed July 13, 2021, https://democrats.org/where-we-stand/party-platform/.
21. “Resolution Regarding the Republican Party Platform,” Republican National Committee, accessed July 13, 2021, https://prod-cdn-static.gop.com/docs/Resolution_Platform_2020.pdf; Tom Wheeler, “The 2020 Republican Party Platform: ‘L’etat, c’est moi,’” Brookings, August 25, 2020, https://www.brookings.edu/blog/up-front/2020/08/25/the-2020-republican-party-platform-letat-cest-moi/.
22. Global Climate Change, NASA, accessed May 12, 2021, https://climate.nasa.gov/evidence/.
23. Gerald H. Kramer, “Short-Term Fluctuations in U.S. Voting Behavior, 1896–1964,” American Political Science Review 65 (March 1971): 131–143; Thomas J. Rudolph, “Who’s Responsible for the Economy? The Formation and Consequences of Responsibility Attributions,” American Journal of Political Science 47 (October 2003): 698–713.
24. Benjy Sarlin and Alex Seitz-Wald, “Donald Trump and Hillary Clinton Are Universes Apart on Immigration,” NBC News, September 2, 2016, http://www.nbcnews.com/politics/2016-election/donald-trump-hillary-clinton-are-universes-apart-immigration-n641686.
25. Ed Lowther, “US Election 2020: Trump’s Impact on Immigration—in Seven Charts,” BBC News, October 22, 2020, https://www.bbc.com/news/election-us-2020-54638643.
26. Marianna Sotomayor and Mike Memoli, “Joe Biden Releases Two Immigration-Focused Plans,” NBC News, updated May 11, 2021, https://www.nbcnews.com/politics/meet-the-press/blog/meet-press-blog-latest-news-analysis-data-driving-political-discussion-n988541/ncrd1099821#blogHeader.
27. David RePass, “Issue Salience and Party Choice,” American Political Science Review 65 (June 1971): 368–400.
28. Vavreck, Message Matters.
29. Amber E. Boydstun, Rebecca A. Glazier, and Claire Phillips, “Agenda Control in the 2008 Presidential Debate,” American Politics Research 41 (September 2013): 863–899.
30. “Faithless Electors,” FairVote, last updated July 6, 2020, http://www.fairvote.org/faithless_electors.
31. “What Is the Electoral College?,” Electoral College, U.S. National Archives and Records Administration, last reviewed December 23, 2019, https://www.archives.gov/federal-register/electoral-college/about.html; “About the Electors,” Electoral College, U.S. National Archives and Records Administration, last reviewed May 11, 2021, https://www.archives.gov/federal-register/electoral-college/electors.html#selection.
32. Alex Daugherty, “Your Vote in Texas Isn’t Worth as Much as Some Other States,” McClatchy DC Bureau, November 14, 2016, http://www.mcclatchydc.com/news/politics-government/election/article114635878.html.
33. “Presidential Election Results: Biden Wins,” New York Times, accessed May 14, 2021, https://www.nytimes.com/interactive/2020/11/03/us/elections/results-president.html.
34. “Presidential General Election Ad Spending Tops $1.5 Billion,” Wesleyan Media Project, October 29, 2020, https://mediaproject.wesleyan.edu/releases-102920/#fig1.
35. “Record Shattering 2020 Ad Volumes,” Wesleyan Media Project, October 21, 2020, https://mediaproject.wesleyan.edu/releases-102120/.
36. See Lawrence D. Longley and Alan G. Braun, The Politics of Electoral College Reform (New Haven, CT: Yale University Press, 1972), for a survey of the proposals for Electoral College reform; see A. C. Thomas, Andrew Gelman, Gary King, and Jonathan N. Katz, “Estimating Partisan Bias of the Electoral College Under Proposed Changes in Elector Apportionment,” Statistics, Politics, and Policy 4, no. 1 (2013): 1–13, for an empirical test of the effects of various reform proposals.
37. Katharine Q. Seelye, “Maine Adopts Ranked-Choice Voting. What Is It, and How Will It Work?,” New York Times, December 3, 2016, https://www.nytimes.com/2016/12/03/us/maine-ranked-choice-voting.html?_r=0.
38. Alan Greenblatt, “Some in GOP Want New Electoral College Rules,” It’s All Politics, NPR, January 28, 2013, http://www.npr.org/blogs/itsallpolitics/2013/01/25/170276794/some-in-gop-want-new-electoral-college-rules; see “Gaming the Electoral College,” http://www.270towin.com/alternative-electoral-college-allocation-methods/, to see how changing the Electoral College rules would affect who wins the presidential elections.
39. Donald E. Stokes and Warren E. Miller, “Party Government and the Saliency of Congress,” Public Opinion Quarterly 26 (Winter 1962): 531–546.
40. “Vital Statistics on Congress,” Brookings, February 8, 2021, https://www.brookings.edu/multi-chapter-report/vital-statistics-on-congress/.
41. Tom Murse, “Do Members of Congress Ever Lose Re-election?,” ThoughtCo, December 10, 2020, https://www.thoughtco.com/do-congressmen-ever-lose-re-election-3367511.
42. Richard F. Fenno Jr., “If, as Ralph Nader Says, Congress Is ‘The Broken Branch,’ How Come We Love Our Congressmen So Much?,” in Congress in Change: Evolution and Reform, ed. Norman J. Ornstein (New York: Praeger, 1975), 277–287; Richard F. Fenno Jr., Home Style: House Members in Their Districts (New York: Pearson, 2002).
43. John R. Hibbing and Elizabeth Theiss-Morse, Congress as Public Enemy (New York: Cambridge University Press, 1995), 45.
44. John Sides, “The 2012 Election Was Not a Mandate,” Monkey Cage (blog), November 7, 2012, http://themonkeycage.org/2012/11/07/the-2012-election-was-not-a-mandate/.
45. “The Trump-Biden Presidential Contest,” Pew Research Center, October 9, 2020, https://www.pewresearch.org/politics/2020/10/09/the-trump-biden-presidential-contest/.
46. David A. M. Peterson, Lawrence J. Grossback, James A. Stimson, and Amy Gangl, “Congressional Response to Mandate Elections,” American Journal of Political Science 47 (July 2003): 411–426; Lawrence J. Grossback, David A. M. Peterson, and James A. Stimson, Mandate Politics (New York: Cambridge University Press, 2007).
47. “Presidential Job Approval Center,” Gallup, accessed July 13, 2021, https://news.gallup.com/interactives/185273/presidential-job-approval-center.aspx.
Descriptions of Images and Figures
Back to Figure
The horizontal axis shows race and ethnicity. The vertical axis shows percentage and ranges from 0 to 100 in increments of 10. The data form the graph are tabulated below.
Back to Figure
The data from the pie chart for Biden voters are tabulated below.
The data from the pie chart for Trump voters are as follows.
Back to Figure
The horizontal axis ranges from 1968 to 2020 in increments of 4. The vertical axis is labeled mean score and ranges from 0 to 100 in increments of 10. The approximate data from the graph are tabulated below.
Back to Figure
The horizontal axis shows characteristics. The vertical axis shows mean image score and ranges from 1 to 5. The data from the graph are tabulated below.
Back to Figure
The horizontal axis shows different reactions. The vertical axis shows percentage and ranges from 0 to 60 in increments of 10. The data from the graph are tabulated below.
Back to Figure
The horizontal axis ranges from 1 to 7, where 1 corresponds to fewer services and 7 corresponds to more services. The vertical axis is labeled percentage and ranges from 0 to 50 in increments of 5. The approximate data from the graph are tabulated below.
Back to Figure
The horizontal axis ranges from 1 to 7, where 1 corresponds to government should help blacks and 7 corresponds to Blacks should help themselves. The vertical axis is labeled percentage and ranges from 0 to 50 in increments of 5. The approximate data from the graph are tabulated below.
Back to Figure
The horizontal axis shows different attitudes. The vertical axis shows percentage and ranges from 0 to 80 in increments of 10. The approximate data from the graph are tabulated below.
Back to Figure
The horizontal axis shows different attitudes. The vertical axis shows percentage and ranges from 0 to 100 in increments of 10. The approximate data from the graph are tabulated below.
Back to Figure
The horizontal axis shows different perceptions. The vertical axis shows percentage and ranges from 0 to 90 in increments of 10. The approximate data from the graph are tabulated below.
Back to Figure
The horizontal axis shows different attitudes. The vertical axis shows percentage and ranges from 0 to 50 in increments of 5. The approximate data from the graph are tabulated below.
Back to Figure
The horizontal axis shows different attitudes. The vertical axis shows percentage and ranges from 0 to 70 in increments of 10. The approximate data from the graph are tabulated below.
Back to Figure
The horizontal axis shows different attitudes. The vertical axis shows percentage and ranges from 0 to 70 in increments of 10. The approximate data from the graph are tabulated below.
Back to Figure
In both graphs, the horizontal axis shows different ideological identifications, and the vertical axis shows percentage, ranging from 0 to 70 in increments of 10. The approximate data from the graphs are tabulated below.
Back to Figure
The ad volume in 2020 was as follows:
· 0 to 500: Few parts of the western, northern, and central United States.
· 501 to 5000: Most parts of the northwestern, southern, central, and southeastern United States, and few parts of the northeastern United States.
· 5001 to 25000: Most parts of the western and northeastern United States and few parts of the southern and southeastern United States.
· 25001 to 40000: Some parts of the northern, west central, northeast central, and northeastern United States.
· 40000 plus: Few parts of the southeastern and northeastern United States.
The ad volume in 2016 was as follows:
· 0 to 500: Most parts of the northern, central, and east central United States, and some parts of the eastern United States.
· 501 to 5000: Most parts of the western United States and few parts of the norther and eastern United States.
· 5001 to 25000: Few parts of the west central, northeastern, and southeastern United States.
· 25001 to 40000: Some parts of the southwest central and eastern United States.
Back to Figure
The horizontal axis ranges from January 2012 to January 2021. The vertical axis is labeled percentage and ranges from 0 to 70 in increments of 10. The lines show sharp fluctuation. The line for Obama is between January 2012 and January 2017, the line for Trump is between July 2017 and July 2020, and the line for Biden is at January 2021. The approximate data from the graph are tabulated below.