
Center voices from the margins.
DASHBOARD BLUES
I am sitting around the superintendent’s conference table in a diverse, urban school district alongside local parent leaders, teachers, and administrators. The district is a microcosm of California’s shifting state demographics: 64 percent of students are Latinx, 70 percent are current or former English language learners (ELs), and twenty-five distinct language groups coexist here. For the past couple of months, I have been helping the superintendent (now in his fourth year and atypical for his staying power) lead a community engagement process to develop a strategic plan.
Tonight, we are serving up Dashboard Data—the state’s latest metric system to assess student and school performance—to this group of forty stakeholders. The handouts before us light up in red, orange, yellow, and green.
 Description
Figure 3.1 Sample Dashboard Data
Arrows jut out to form various angles as community members try to make heads or tails of the graphics. (Later, a parent tells me, “The data is not easy to understand … you don’t relate to what it means right away. You can compare your own group with other groups, sure, but then you start asking the question: Why are we at the bottom?”) Blue represents the Dashboard’s high-performing hue; notably, the only blue on this page is associated with the marker “No Students.” The mood is somber.
A Spanish-speaking mother suddenly speaks up: “Why are our children doing so poorly? Why are the Asian students doing better? What can we do about this?” An African American mother chimes in: “And what are doing for our homeless students? They are performing among the lowest, and we have nothing in place to support them!” Both women—powerful and engaged parent leaders—are near tears as they pose these questions, and I sense an overwhelming paralysis in the room. Not only is the Dashboard making these parents ask hard questions, it’s leaving all of us without solutions or a real direction—only a gloomy sense of Groundhog Day. Here we go again … more confirming data on our most vulnerable students.
When our small group rejoins the other stakeholders, the teachers in the room are quick to speak up. “I don’t trust this data,” says a respected veteran and union leader. “It’s not accurate, thorough, or helpful.” Parents around the room nod their heads in agreement. In a post-mortem conversation, the assistant superintendent of Educational Services acknowledges the weightiness of the Dashboard conversation: “What’s happened in public education is that we’re told over and over again that there is something wrong, but it never helps us understand what is wrong, why it’s wrong, and what to do to fix it.”
I leave this meeting feeling like we have failed the community tonight. By offering Dashboard graphics without context, human story, or an explicitly antiracist lens, we have done a disservice to the students and parents in the room. We have contributed to a relentless deficit narrative about the “achievement gap” facing historically marginalized students, and I feel us heading straight for the equity traps and tropes. Isn’t there a fuller story to be told? Isn’t there another way to understand what is happening for the students of this district?
THE CORE STANCE OF ANTIRACISM: WHY WE MUST FLIP THE DASHBOARD
The heartbeat historically of racism has been denial … has been to deny that one’s ideas are racist, one’s policies are racist, and certainly that one’s self and one’s nation is racist … By contrast, the heartbeat of antiracism is confession, is admission, is acknowledgement, is the willingness to be vulnerable.
—Ibrahim X. Kendi, Unlocking Us podcast, June 3, 2020
In this chapter, we explore the question, What is street data; how is it antiracist; and how can we collect it? We consider whose voices are habitually included, tokenized, or silenced as we pursue “improvement” inside a broken model. We also choose the margins, flipping the dashboard upside down to center the experiences of those who matter most: not policymakers and certainly not test makers but the families, students, and educators who breathe life into learning. Māori scholar Linda Tuhiwai Smith writes that the metaphor of the margin has served as a powerful symbol for understanding social inequality, oppression, disadvantage, and power as well as hidden sources of wisdom. Xicana writer Gloria Anzaldua invoked the idea of the frontera, or borderland, for this same purpose, while African American author and activist bell hooks wrote of the “radical possibility of ‘choosing the margin’ as a site of belonging as much as a site of struggle and resistance” (Smith, 2012). Far from places of weakness or impoverishment, the margins are sites of deep cultural wealth and community wisdom.
Flipping the dashboard is an act of antiracism; it requires courage, vulnerability (which we’ll revisit in Chapter 8), and an explicitly antiracist stance, defined by scholar Ibrahim X. Kendi as the belief that “racial groups are equals and none needs developing, and … supporting policy that reduces racial inequity” (Kendi, 2019). The satellite data testing complex has long promoted the myth that students of color “need developing”—translated: Black, Indigenous, and brown students are broken and schooling will fix them. To walk the next-generation path of street data, we have to be vulnerable enough to reject this racist lie and stare down the parts of our own practice that need to be fixed. We need to confess, admit, acknowledge, and own our racial bias and the racism baked into our institutions. This means listening deeply to students and families, even (or especially!) when their voices are hard to hear.
Student voices are incontrovertible. We can’t dismiss, deny, quantify, or rationalize away the voices and experiences of children at the margins. Allow them to be truthtellers and moral compasses for what you say you believe about equity, but learn to listen deeply without boomeranging into past practice. By choosing the margins as the starting point for our data conversations—those quiet places where the hopes, dreams, and stories of our most disenfranchised students and families live—we invert the pyramid, shift the dynamics of power, and bring children to the center of educational discourse. Street data offers us an operational framework for choosing the margins, as we redefine what it means to work toward equity.
Reimagining the System

It’s time to repurpose data from a tool for accountability and oppression to a tool for learning and transformation. Let’s imagine a new kind of dashboard that lights up with green opportunity zones—classrooms and schools where students of color, LGBTQIA students, and students with diverse abilities experience identity, belonging, and deep learning. This dashboard would be coupled with a professional-learning infrastructure that supports educators to visit, study, and learn from these spaces of equity and opportunity.
Street data will help us pivot from blind compliance with external mandates to cultivating local, human-centered, critical judgment. What if we were to shift our systems change framework from dashboards and ratings toward reflective review processes that are rooted in student and family voices? What if we invested in the observation and analysis skills of trained educators rather than depending on test developers and policymakers to tell us who’s successful? What if reflective review teams comprised of educators, parents, and students developed lines of inquiry around a school-based asset or opportunity versus a perceived “gap”?
With this shift in orientation, states and provinces could design and regionalize reflective review models that invert the paradigm and center the expertise of parents, students, and others. Instead of being punitive, school reviews would aim to build local educator capacity by offering recommendations grounded in street data. For example, the review team would interview students and teachers and observe classrooms to capture data on student-teacher interactions, teacher commentary, equitable patterns of student participation, ratios of positive to negative student feedback, and other low-inference data. Teams would gather lots of street data and then sit down to analyze it for growth opportunities.
In such an inverted system, we would
· Create opportunity maps for each state and region, highlighting schools that are centering student voice to imagine new approaches and identify culturally sustaining practices.
· Fund learning visits for educators to get a street-level view of an antiracist school or district that uses student experience, student work, and other ground-up data to design instruction and adult learning.1
· Develop high-quality surveys and focus groups around student belonging and connection, using an explicitly antiracist lens to gain insight into what enables young people to thrive.
· Investigate and measure student agency: What helps a child develop a sense of purpose and efficacy in the world, and what can schools do to cultivate that?
· Start any staff or student-learning process with an inquiry question, such as how do my students learn best, or at the district level, how do families say our students learn best? Identify ways to gather this data, including those highlighted in this chapter.
· Use learning walks to gather street data on our line of inquiry, focusing our notes on close observations of students’ responses to various pedagogies (projects, discussions, etc).
· As we gather meaningful information about our students, continuously ask and observe their experiences through ongoing equity transformation cycles (see Chapters 4 and 8).
· When students leave us, do exit interviews with fidelity and an anti-racist lens asking how they experienced agency, connection, and belonging. Use these data to push ourselves to adjust our approaches the following year.
1 A word of caution here: Visitors would be asked not to replicate what they see in a visit but to take a learning stance in adapting powerful practices to their local context.
None of this can be uncovered through test scores or other big data.
THE LEVELS OF DATA
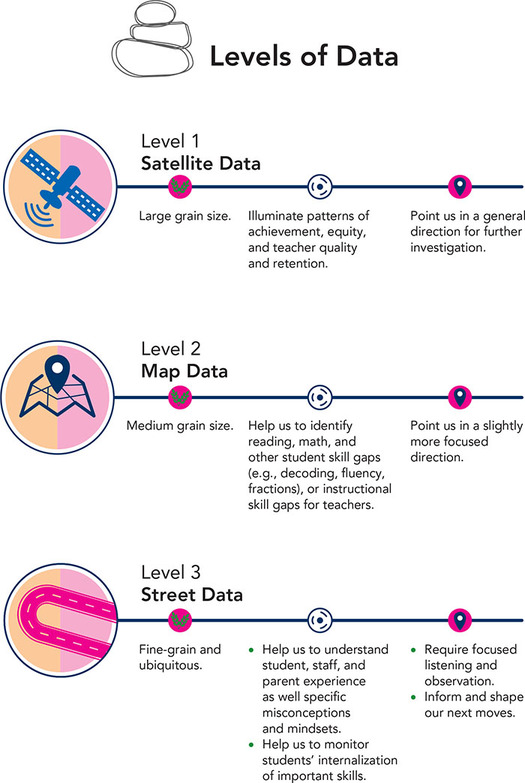
To transform the system, we need a new framework for thinking about data. In my first book, The Listening Leader: Creating the Conditions for Equitable School Transformation (Safir, 2017b), I introduced a framework called the Levels of Data that takes center stage in this book. Drawing on the work of assessment expert W. James Popham, I argued that we are using the wrong data to make our most important educational decisions and, as a result, further marginalizing the students we claim to serve. Let’s take a moment to revisit the levels of data.
 Description
Figure 3.2 Levels of Data
Level 1 “satellite data” hover far above the classroom and tell an important but incomplete story of equity. Satellite data encompass broad-brush quantitative measures like test scores, attendance patterns, and graduation rates, as well as adult indicators like teacher retention, principal attrition, and parent participation rates. While satellite data can illuminate trends and point our attention toward underserved groups of students, they have a few fatal flaws. First, they are often lagging, falling into educators’ hands long after they have lost their utility to inform instructional and resource decisions. Second, they give policymakers and system leaders the platform and credibility (unwarranted, I would argue) to make sweeping decisions without being close to the locus of learning—the classroom.
Finally and perhaps most problematically, satellite data serve to reinforce implicit biases and deficit thinking about African American, Latinx, Indigenous students, students with diverse abilities, and other historically marginalized learners. They project a single story about “under-performance” rather than illuminating the complexity of learning and the tremendous assets that every child brings. By attempting to distill the kaleidoscopic process of learning into a metric and promoting a narrow discourse of achievement, satellite data contribute to a long, racist history of insinuating that students of color have lower intellectual capacity rather than differential access to opportunity.
Satellite data lack context and nuance, failing to account for phenomena like stereotype threat or ground us in the layered, human experiences that young people bring to learning. As Jamila argued in Chapter 2, the pursuit of educational equity is inherently complex, requiring context, texture, and story. Even as we have shifted the national narrative away from accountability, we have clung to a reliance on satellite data. We must turn to map and street level data to uncover student assets, understand root causes, and seek transformative solutions.
Level 2 “map data” hover closer to the ground, providing a GPS of social-emotional, cultural, and learning trends within a school community. Map data include literacy levels gathered through “running records,” where teachers listen to and code students reading aloud, rubric scores on common assessments, and surveys that reveal student, parent, or staff perception and satisfaction levels. While Level 2 data paint a slightly richer picture, they still lack the specificity required to transform instructional and leadership decisions and the humanity needed to shape an equity-driven change process.
By contrast, Level 3 “street data” take us down to the ground to observe, listen to, and gather artifacts from the lived experiences of stakeholders. Street data are the qualitative and experiential data that emerges at eye level and on lower frequencies when we train our brains to discern it. These data are asset based, building on the tenets of culturally responsive education by helping educators look for what’s right in our students, schools, and communities instead of seeking out what’s wrong. Street data help us reveal what’s getting in the way of student or adult learning, illuminate where the learner is in relationship to a holistic set of goals, and determine what might come next. The street data model embodies an ethos and a change methodology that will transform how we engage everything from student learning to district transformation to policy by offering a new way to think about, gather, and deploy data.
It’s important to note that street data are not “just stories.” They represent systematic information about student learning—how students are performing vis-à-vis developmental expectations, feeling about their learning environment and themselves, what might be impeding a child’s ability to thrive, and what instructional or leadership moves should come next. They yield systematic information about equity, pulling back the curtain on implicit biases and microaggressions—subtle, everyday slights or insults that convey a hostile or derogatory message to targeted people based on their identity as part of a marginalized group. Only street data can illuminate how these forces influence learner experiences of inclusion and belonging.
What are the benefits of flipping the dashboard to focus on street data? This rich landscape of information will help us uncover stories of hope and harm while revealing students’ assets, cultural wealth, and learning needs. Unlike the lagging pace of satellite data, street data provide real-time, leading indicators on the messy work of school transformation. They enable rapid feedback loops that inform our everyday decisions while promoting a bias toward action over stagnation. We don’t have to wait for street data; it’s right in front of us all the time. We can develop a living toolkit of strategies for gathering street data.
Let’s get concrete. Imagine a child is sent out of his teacher’s classroom to the principal’s office five days in a row. We now have a satellite data point: daily referrals. Now, imagine that this child is a ten-year-old boy who immigrated from Honduras a year ago, was detained traumatically at the border, and has an undiagnosed learning difference. From an intersectionality lens, he faces multiple barriers. As educators, we can ask what factors are contributing to his daily experience of being pushed out of the classroom. Does the teacher have an unconscious bias against the child? Is the instruction too teacher centered, causing the boy’s attention to flag and the teacher to become frustrated? Is the boy suffering from PTSD and unable to concentrate without getting therapeutic support? Is there an IEP in place with appropriate accommodations? What does the child tell his caregivers about his schooling experience?
The principal could easily send the child back to class each day without a clear understanding of what’s at play. Alternatively, she could interview the teacher, interview the child, call home to ask the family what they are seeing, and observe the child in his teacher’s classroom. From that rich constellation of street data, the principal is likely to find an entry point to a solution. Rather than maintain the status quo, he or she has the potential to disrupt a reproductive cycle and design a responsive plan that only the street data can reveal. As an added benefit, by treating this situation as a learning opportunity, the principal may perceive underlying patterns that help her rethink professional learning, referral processes, instructional coaching, and other systems.
Many improvement efforts that claim the equity mantle succumb to Paolo Freire’s notion of false generosity (Freire, 1970). We assume we know what’s best for struggling families and students and default to savior behaviors like the Great White Hope trope Jamila described in Chapter 2. Dr. Gloria Ladson-Billings, mother of the field of culturally responsive education, describes a pobrecito (poor little one) syndrome in which teachers pity their students and therefore fail to appropriately challenge them.
Street data disrupt these dynamics by bringing student voice to the forefront of our discussions and providing more trusted, heartfelt, and personalized information. Equally important, they help us uncover hidden narratives and equity issues. Contributing author Carrie Wilson (Chapter 7) writes in the playbook Leading by Learning (Lead by Learning, 2020), “Using data to make students’ experience visible is ultimately about equity. When data reveals the student-learning experience rather than just an achievement level, teachers have the opportunity to check their assumptions about student learning against what is actually happening in the data.”
The Emerging Field of “Thick Data”
It’s worth noting that the concept of street data has recent echoes in other fields. For example, in the corporate world, innovators are beginning to challenge the dogma of “big data” and push for an emphasis on “thick data.” Global tech ethnographer Tricia Wang defines thick data as “data brought to light using qualitative, ethnographic research methods that uncover people’s emotions, stories, and models of their world. It’s the sticky stuff that’s difficult to quantify. It comes to us in the form of a small sample size and in return we get an incredible depth of meanings and stories.” (Wang, 2016).
She contrasts thick data with big data—“quantitative data at a large scale that involves new technologies around capturing, storing, and analyzing.” Sound familiar? Wang sees value in big data, but her critique is sharp: The normalizing and standardizing processes it employs tends to gut the data set of meaning and context—a problem that only thick data, or in our case street data, can rectify.
In a fascinating story about her own research at the cell phone company Nokia in 2009, Wang describes how years of conducting ethnographic work in China helped her uncover an insight that challenged Nokia’s entire business model: Low-income consumers were ready to pay for more expensive smartphones. Instead of embracing her findings, the company derided them, arguing that her sample size was too small and thus irrelevant. She responded that their notion of demand was “a fixed quantitative model that didn’t map to how demand worked as a cultural model in China” (Wang, 2016). In short, Wang was right, and Nokia met its downfall because it over relied on the numbers and ignored the import of cultural stories and context.
This is the power of street data. It offers us insight into localized cultural models that, if we dig deep, illuminate the root causes of inequities as well as places of opportunity and cultural wealth.
ROOTS OF STREET DATA
Street data is an equity-centered approach that draws on several fields of study and practice. To be clear, we are not the first writers to say that educators should talk and listen to kids. Many folks speak to the importance of qualitative and action research as methods of school improvement, but it’s as if everyone is touching a different part of the elephant and failing to see the whole. What is unique about street data is that it provides a comprehensive model of school transformation, stitching together four often-siloed elements: equity as the fundamental purpose, pedagogy as the fundamental pathway, adult culture as the vehicle, and street data as the GPS system that keeps us on the path of equity-centered transformation.
To understand the power of this framework, let’s situate it in relationship to quantitative and qualitative methods. Quantitative research attempt to explain patterns through the collection and statistical analysis of numerical data—what I referred to in the introduction as empiricism and its close kin, positivism. This has been the prevailing methodology in education starting in the mid-1800’s when formal written tests began to replace oral examinations administered by teachers and schools at the same moment that schools changed their mission from serving the society’s elite to educating the masses. It is striking that the birth of modern satellite data coincided with the democratization of public education. Rather than seek to develop a cadre of professional educators with the skills to assess student learning, the field began to batch-process students in tandem with a factory-style approach to assessment.
Qualitative research, on the other hand, seeks to answer questions about why and how people behave in the ways that they do, mining for insight into the messy interplay of human relationships. Qualitative researchers collect and analyze non-numerical data in an effort to gain insight into social conditions and behaviors. Mixed methods is a form of research that integrates quantitative and qualitative methods to enact a more holistic approach. Street data, the topic of this book, is a practitioner-driven, layperson’s framework for conducting qualitative research in service of school transformation that drives toward equity and deep learning.
There are many branches on the tree of qualitative research, all of which emerge from a common process: Identify a research problem, craft a question or set of questions, gather relevant data, analyze and interpret the data, and synthesize findings. While PhD candidates engage in this type of rigorous inquiry, educators—as life-changing as our work is—are robbed of the opportunity. Instead of building our instructional and leadership capacity in this way, we are asked to “improve our practice” by being held hostage to satellite data, sit-and-get professional development, sporadic evaluation, or working on complex problems in painful isolation. Street data offers a way to become ethnographers and researchers in our own classrooms, schools, and districts, in collaboration with colleagues, at no cost.
ON THE GROUND: WAYS TO GATHER STREET DATA
By now, you have a sense of the purpose and roots of street data. Think of it like a roadmap to an old city filled with hidden alleys and untold routes to explore. In 2011, I took my daughter on a learning visit to the West Bank and Jerusalem for her fifth birthday (my husband and I were teaching high school in Amman, Jordan, at the time—just 155 miles, but cultural and political lightyears, away). I remember wandering the medina, or old city, of Jerusalem filled with endless streams of people, foods, sounds, and treasures. We had particular sites we wanted to see, but at some point, we dropped the map and meandered, simply taking in the eruption of rich, multisensory surprises.
When educators embrace the model of street data, we commit to take in the rich cultural microcosms of our classrooms, staffrooms, hallways, and central offices with a new set of eyes and ears. We commit to listen and observe, ask questions rather than offer answers, and seek root causes rather than quick fixes. We also bridge the power of the oral and written word with a focus on storientation, a concept introduced in The Listening Leader that signifies close attention to the role of stories in school transformation. As we honor the power of story-centered and oral traditions, a new constellation of data becomes available, from student identity maps and mini-biographies to educator-developed case studies, oral histories, and listening campaigns.
Street data can be gathered by design, or it can emerge organically. Either way, it has tremendous value in the journey toward equity. Table 3.1 lays out three types of street data for your toolkit.
Table 3.1 Types of Street Data

|
Artifacts Anything created by human beings that yields information or insight into the culture and/or society of its creator and users |
Stories/Narratives The oral and sometimes written transmission of stories, histories, lessons, and other knowledge to maintain a historical record and sustain cultures and identities Observations |
The study of human behavior, including micro-interactions, micro-pedagogies, and micro-facilitation moves with a keen focus on nonverbal as well as verbal communication |
|
|
|
Here are ten examples of ways to collect street data.
1. Audio feedback interviews: Conduct an audio-recorded focus group with students or parents whose voices are typically absent from the decision-making table. Begin by identifying an equity challenge that you want to gain insight around. Invite a small group of stakeholders to engage in thirty to forty-five minutes of discussion. Prepare and ideally share your questions in advance. Afterward, transcribe and edit the data to highlight key themes and comments (more on this in Chapter 8). With participant permission and/or full anonymity, these data can be used at a staff meeting to ground discussions of the equity challenge.
2. Listening campaigns: Listening campaigns involve a set of interviews or focus groups from which the listener assembles and organizes anonymous quotes by theme. The data are usually shared back to the community as an opportunity for growth and reflection. Conduct a series of listening sessions to gain insight and empathy toward a group of people at the margins, for example, LGBTQ students, parents of English language learners, or students with learning differences. Be sure to tap a group of at least five stakeholders so that you are able to get a sense of cross-cutting patterns.
3. Equity participation tracker: When visiting a classroom, track who is called on to participate by the teacher, who volunteers to speak, and who is receiving positive versus negative feedback (verbal and nonverbal). Break this data down by race, gender, English-language learner status, gender, learning differences, and other factors. This street data tool will help you study the micro-pedagogies of equity.
4. Ethnographies: If you are part of a team that meets on an ongoing basis, consider doing an in-depth ethnography of a group of students. This deep exploration of a campus subculture—for example a group of high-achieving Indigenous students—will entail interviews, observations, and soliciting written reflections from the learners. Begin by articulating an authentic inquiry question that you will investigate through the process. Obviously, get parent and student permission first.
5. Fishbowls: Facilitate a fishbowl dialogue to draw out the experiences and perspectives of a group at the margins. The structure is simple: A small group engages in discussion in the middle of the room, while other participants encircle this group and listen intently, jotting down key words and phrases. For example, district staff might facilitate a fishbowl of principals, asking, “What is your daily experience like as school leader? What conditions do you need to be successful? What could we do differently to support you?” Principals can facilitate a fishbowl of teachers, parents, or paraprofessionals. Teachers can facilitate a fishbowl of students. Be sure you have identified a central equity challenge; develop and share the questions beforehand with participants. Panel discussions can serve a similar role. Be willing to listen, even when it’s hard to hear.
6. Home visits: Home visits are a powerful and underutilized street data tool. Over the years, I have found that many educators are fearful of doing home visits. They’re either afraid of high-poverty neighborhoods and communities of color due to unconscious or conscious racism; they’re afraid of imposing on families in their private sphere; or both. In the years that led to the founding of June Jordan School for Equity, the school where I was a principal, I had the privilege to do hundreds of home visits as part of a community organizing drive. I always asked the family if they felt comfortable having me in their home or preferred to meet in a community space, like a church hall or café. More often than not, they wanted to host the visit and took pride in welcoming me to their home. I felt deeply honored and, more importantly, gained street-level data on the family and student: their cultural wealth, assets, hopes, dreams, and fears.
7. Shadow a student: There is perhaps no better way to empathically understand a student’s experience than to put on your tennis shoes and shadow him or her. Put on your comfy shoes and, with permission of course, follow a student through his or her school day. This is particularly impactful if done by a network of leaders and focused on students who are currently outside the sphere of success. My colleague Jennifer Goldstein, a professor of educational leadership at California State University Fullerton, has principal candidates shadow an English learner for a day, with tremendous impact. A principal can also shadow a teacher throughout his or her day, and a district leader would do well to shadow a principal or assistant principal.
8. Equity-focused classroom scan: Do a demographic scan of different types of classes on campus—gifted, remedial, honors, academies, career tech, advanced placement, and so forth. Note the distribution of students by race/ethnicity, gender, ELL status, students with special needs, and so forth. With this data in hand, facilitate a leadership team discussion about the current landscape of equity and access at your site, where to go next for street data, and what your equity imperative is to address this.
9. Structured meeting observations: Be a fly on the wall in an upcoming team meeting. Take notes on who speaks and who does not, much like the equity participation tracker. Take notes on how the facilitator responds to different participants and whether the emotional valence of the response (positive, negative, neutral) tracks to race, gender, tenure, or other factors. Capture observation notes on the group dynamic—the energy of the room, including the ways in which people build off each other’s ideas, respectfully challenge each other, and ask questions to probe one another’s thinking.2
10. Student-led community walks: I have written about community walks for Edutopia (Safir, 2017a) and in The Listening Leader (Safir, 2017b). They are an invaluable tool for flipping the dashboard and uplifting the expertise of students and parents. To experiment with this strategy, identify social or cultural groups in your community about whom it would benefit educators to gain deeper knowledge. Invite students from those groups to meet with you to design a professional-learning experience for educators, typically comprised of two afternoons: one to read about the community and listen to student presenters and one to follow students through a guided community walk of their neighborhood. Support and empower students to design this experience with any tools at your disposal—PowerPoint slides, panels of community leaders, a lunch hosted by families in the community, an itinerary that includes important sites (markets, churches, community centers, etc.), and people.
2 Chapter 10 of The Listening Leader includes group dynamic thermometers, which are visual metaphors with tips for how to analyze a positive or negative group dynamic.
FROM SATELLITE TO STREET: UPLIFTING THE VOICES OF STUDENTS, PARENTS, AND TEACHERS
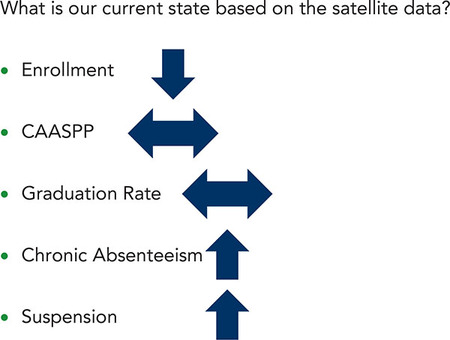
To open this chapter, I shared a story called “Dashboard Blues” where parents and educators in a low-performing district became paralyzed in the face of satellite data as they developed a strategic plan. As we reflected on this meeting, the superintendent and I realized that the satellite story of his district was longstanding and actually quite simple: Enrollment was dropping; test scores and graduation rates were flat; chronic absenteeism and suspensions were up. (He distilled it into a single slide that he shared at the next meeting.) We were spending a lot of time revisiting a narrative that everyone knew and yet felt unable to change.
 Description
Figure 3.3 Profiled District Satellite Data Summary
But there was so much more to the story of this district—a place rich in cultural and linguistic diversity with a strong union history and parent leadership, dedicated staff, low attrition, and for the first time, a superintendent who was around for the long haul. As we began to plan the next community meeting, the superintendent asked me, “What is not told through our satellite data?” before responding to his own question: “Our bright spots and successes, the community and personal stories of our district, and the ‘why’ behind the data.”
We decided to use the next meeting to flip the dashboard and center the voices of the students, parents, and teachers in the room. I proposed a Kiva Panel—a facilitated discussion of an important community issue that aims to bring new perspectives into the public domain.3 This process works best when the panel represents distinct but equally strong positions on a topic, so we recruited a diverse cross-section of participants: two high school students (an African American and Japanese American biracial young woman and an Asian American gay young man), two parents (a monolingual Spanish-speaking mother and an African American father), and two veteran teachers and union leaders (both white—reflecting a demographic disconnect common in many urban districts).
3 Kiva Panels are described in detail in Chapter 10 of The Listening Leader: Safir, S. (2017). The listening leader: Creating the conditions for school transformation (p. 292). Hoboken, NJ: John Wiley and Sons.
During the panel, I posed three questions to each participant in structured “rounds,” after which listeners formed small groups to discuss what they had heard:
1. Share a bright spot in your experience of our district. What can we learn from that bright spot?
2. Reflect on an experience of inequity or exclusion that you’ve had in our district. How did that experience impact you as a person and a learner?
3. Imagine you could wave a magic wand to strengthen equity, relationships, and deep learning in our district. What would you change, and why?
The room was riveted. You could hear a pin drop as the students and parents shared stories of hope and alienation. The Latina mother cried as she talked about visiting her son’s school to ask for academic support and being ignored for close to an hour as the staff told her, “No one speaks Spanish here, so you’ll just have to wait.” The young gay man talked about being bullied and never having a teacher check in with him to see how he was doing. Panelists also shared wonderful stories of project-based and deep-learning experiences—moments where educators had effectively dumped the dashboard to teach content in dynamic and innovative ways.
The Kiva Panel transformed the energy in the room, electrifying a once-paralyzed group charged with charting the district’s direction for the next three years. Not a single person stood up and said, “These stories can’t be trusted; this data is incomplete,” because the stories represented raw, unadulterated data for transformation. Their value could not be quantified. In fact, the same union leader who publicly lambasted the dashboard data at the previous meeting stood up and said, “Wow, this was amazing. It’s time for us to put the issues we have behind us and move forward because this is really about the kids. We need to come together.”
Reflecting on the cultural shift that happened from the dashboard meeting to the street data panel, the superintendent said:
When people started sharing their stories, everyone listened … not with an ear of “who’s to blame?” or a need to defend and justify, but really trying to understand the experience of each participant. With the dashboard data, you always feel like you need to justify, defend, or blame. It’s not about understanding experience; it’s just about “here are the outcomes.” And on these metrics, we look like a failure.
Street data offers a new grammar for educational equity. It humanizes the process of gathering data. Rather than positioning students and teachers as objects whose value can be quantified, street data teaches us to engage with people as subjects and agents in an ever-shifting landscape—human beings whose experiences are worthy of careful study and deep listening. It teaches us to be ethnographers rather than statisticians. And the process itself builds trust and relational capital.
The benefits of this approach are beyond measurement. By flipping the dashboard and listening to stakeholder experiences, we interrupt persistent deficit narratives about students, families, and teachers; center the voices of those at the margins; and embrace a bias toward action and experimentation. Next, we take a look at how street data can complement satellite and map data as we move our schools and systems along an equity journey.
GETTING UP CLOSE AND PERSONAL: REFLECTION QUESTIONS

1. Identify an idea or passage from Chapter 3 that stood out to you. Share and reflect on it with a partner or small group: Why did it resonate? What felt challenging or provocative?
2. Where do you have opportunities to develop your practice around the core stance of antiracism? Who will be or is your village that helps you stay focused on this work?
3. Identify an equity challenge in your community. What do available satellite and map data tell you (or not tell you) about this challenge? What street data do you need?
4. Which of the street data strategies could you try out in the next two weeks? Make a short plan of who, when, why, and how you’ll do this.
5. What might get in the way of you collecting street data, and how will you stay the course?
Descriptions of Images and Figures
Back to Figure
The three scales are described as follows:
· The scale on the top has an arrow pointing to blue and a text below reads: no students.
· The scale on the middle has an arrow pointing to yellow and a text below reads: American Indian; Hispanic; Socioeconomically Disadvantaged; White.
· The scale on the bottom has an arrow pointing to orange and a text below reads: African American; English Learners; Homeless; Two or More Races; Pacific Islander; Students with Disabilities.
Back to Figure
The infographic is described as follows:
Each level shows three pieces of information along with the respective icons and information in each level are as follows:
· Level 1: Satellite data:
o Large grain size.
o Illuminate patterns of achievement, equity, and teacher quality and retention.
o Point us in a general direction for further investigation.
· Level 2: Map data:
o Medium grain size.
o Help us to identify reading, math, and other student skill gaps (e.g. decoding, fluency, fractions, etc.), or instructional skill gaps for teachers.
o Point us in a slightly more focused direction.
· Level 3 Street data:
o Fine-grain and ubiquitous.
o Help us to understand student, staff, and parent experience as well specific misconceptions and mindsets; Help us to monitor students’ internalization of important skills.
o Require focused listening and observation; Inform and shape our next moves.
Back to Figure
The question and the options along with arrows are as follows:
What is our current state based on the satellite data?
· Enrollment; A downward arrow.
· CAASSP; A bidirectional arrow.
· Graduation rate; A bidirectional arrow.
· Chronic absenteeism; An upward arrow.
· Suspension; An upward arrow.