Chapter Three
N. Boston, Environmental Management Development in Indonesia (EMDI), School of Resource and Environmental Studies, Dalhousie University, Canada
INTRODUCTION
Deep trenches, high mountain chains, rows of volcanoes, deep-sea basins and innumerable coral islands form a complexity of phenomena which are not found over such an extended area in any other part of the world.—WYRTKI 1961
Significance of Indonesian Seas
Global Weather. The vast Indonesian Archipelago of over 17,000 islands spans the equator from latitudes of approximately 6° N to 11° S, and covers a longitudinal expanse from 95° E to 141° E. It is thus strategically situated between the Pacific Ocean on the east and the Indian Ocean on the west, and acts as both a frictional barrier and the only link between the two oceans. The flow from the Pacific to the Indian Ocean, the Indonesian Throughflow, has significance to global ocean circulation and to global weather.
The tropical regions of the world's oceans are recognized as having major influences on the global atmosphere 1 and the tropical west Pacific and east Indian Oceans are recognized as the spawning grounds for many important climatic events such as aperiodic El Niño/Southern Oscillation (ENSO) events. A number of authors (e.g., Piola and Gordon 1984) have pointed out that the water properties of the west Pacific and east Indian Oceans are strongly influenced by the Indonesian Throughflow, and that the throughflow is a carrier of heat from the warm water region of the west Pacific to the Indian Ocean. This heat transfer influences the extent of the warm water region of the west Pacific, which in turn relates to the occurrence and severity of ENSO events. Since small anomalies in sea surface temperature can have large climatological effects, the significant interannual variations of the throughflow probably contribute to the aperiodicity of ENSO events and other climate features.
Ocean Circulation
In addition to atmospheric processes, the Indonesian Throughflow (Arus Lintas Indonesia) plays an important role in the mid-latitude general circulation of the Pacific and Indian Oceans through heat, mass and freshwater/salt transfers. A correct estimate of the annual throughflow is considered to be a priority for global ocean studies (Gordon 1986). The throughflow is essential for the warm water closure of the global thermohaline circulation because of the meridional fluxes of heat and fresh water through the Pacific and Indian Oceans. The throughflow also plays critical roles in the dynamics of the Indian and Pacific Oceans. Hautala et al. (in press) list the thermal forcing of the Leeuwin Current in the east Indian Ocean and the East Australian Current as examples.
The tides in the seas of Indonesia are caused by tidal wave propagation into the archipelago from the Pacific and Indian Oceans. The incoming tidal waves are distorted by the complex bathymetry and coastal geometry of the archipelago. This disruption of the oceanic tides has two significant global effects. First, it means that a significant portion of planetary energy is dissipated by the tidal mixing that occurs in the Indonesian Archipelago. The Indonesian seas are thus an important contributor to the slowing of the earth's rotation and hence to the lengthening of the day. Second, it means that tidal currents play important roles in the transfer and mixing of properties in Indonesian seas. The initial western Pacific water that enters Indonesian seas from the east becomes disguised by vertical mixing from deep basins below and from excess precipitation over evaporation from above. The complex tidal currents are augmented by surface winds and sea level pressure gradients that further modify the properties and variability of the water that enters the eastern Indian Ocean.
The Indonesian seas thus act as a filter and transformer of the water properties of the throughflow from the western Pacific to the eastern Indian Ocean. This has consequences on the global thermohaline circulation, the distribution of sea surface temperature and the air/sea transfers of heat and momentum which so effectively drive the global atmospheric circulation and the wind-driven circulation.
PHYSICAL OCEANOGRAPHY
Geography and Bathymetry
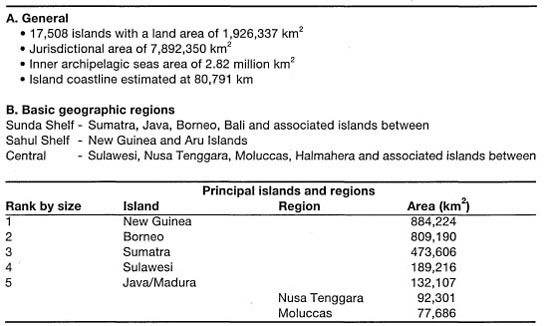
The Archipelago. Indonesia, the largest archipelago in the world, consists of five major islands and about 30 smaller groups of islands. It is thus not a single archipelago, but a collection of archipelagos. As of 1993, the Indonesian Naval Hydro-Oceanographic Office (Dinas Hidro-Oseanografi) had tallied 17,508 islands, rocks, reefs and sandbanks. The five main islands are Sumatra (473,606 km2), Borneo2 (809,190 km2), Sulawesi (189,216 km2), Java3 (132,107 km2) and New Guinea4 (884,224 km2). The combined area of these five islands is well over 90% of the total land area of the archipelago, but less than 25% of the total area of the archipelago. For purposes of illustration, the land area of the Republic of Indonesia (1.9 million km2) is less than 20% of the total area of the Republic, the rest of which is sea (7.9 million km ). The archipelago may be roughly divided into three regions: the western region over the Sunda Shelf, the eastern region over the Sahul Shelf and the central deep ocean region between the two shelves. A summary of the main features is contained in table 3.1.
Shelves, Sills and Ridges.
SHELVES. The wide and shallow Sunda Shelf covers the western portion of the Indonesian seas, extending from the coasts of Malaysia and Indochina (the South China Sea) to the Java Sea. The islands of Sumatra, Java, Borneo, Bali (and several small islands) are located on the Sunda Shelf, which also features the important straits of Malacca, between Malaysia and Sumatra, and Sunda, between Sumatra and Java. Depths over the Sunda Shelf only occasionally exceed 50 m and extensive areas are less than 20 m deep. This results in strong bottom friction and strong tidal mixing.
Table 3.1. General geographical information on the Indonesian Archipelago.
The Sahul Shelf extends northward from Australia to the Indonesian province of Irian Jaya, the western portion of the island of New Guinea. The shelf supports the Am Islands group and the Aru and Arafura Seas. Although depths over the Sahul Shelf are deeper than over the Sunda Shelf, the Sahul Shelf, with depths that seldom exceed 100 m, is considered a region of high tidal energy dissipation.
SILLS. Sills connect the deep basins of the Indonesian seas and play important roles in controlling circulation and throughflow. Whereas the sills are shallow with respect to the deep basins, they are still considerably deeper than the shelf and slope regions. Of the many sills in Indonesian seas, five have particular significance with respect to the physical oceanography and throughflow. For each of the five sills, the depth and location will be followed by a brief description of its oceanographic significance.
Sarangani Sill (1629 m) - Talaud Islands, Sangihe Islands, Sarangani Island.
The deep water of the Pacific Ocean has to pass over Sarangani Sill before it can enter the Sulawesi Sea and then into Makassar Strait.
Dewaking Sill5 (680 m) - Selayar Island, Tanahjampea Island, Bonerate Island, Kalaota Island.
Deep water exiting Makassar Strait is locked from entering the Flores Sea by this sill. The deep water in the Flores Sea will have to come from the Ban da Sea.
Lifamatola Sill (1950 m) - Banggai Islands, Sula Islands, Obi Islands.
The Molucca Sea is open to the Pacific Ocean, but deep water from the Molucca Sea cannot enter the Seram Sea or the Banda Sea because of the Lifamatola Sill.
Manipa Sill (c. 1540 m) - Buru Island, Manipa Island, Kelang Island, Seram Island.
The mixing of the high salinity water from the Halmahera Sea occurs in the Seram Sea and causes the salinity of the water of the Seram Sea to increase before it enters the Banda Sea.
Sukun Sill (2452 m) - Flores Island, Sukun Island, Kalaota Island (see Dewakang Sill).
Water that enters the Flores Sea from the Banda Sea must pass over the Sukun Sill.
RIDGES. The only submarine ridge is located between the island of Java and the Java Trench. It runs parallel to the south coast of Java from about 106° E and maintains that orientation to 121° E south of the island of Sumbawa.
Basins, Deeps, Troughs and Trenches.
BASINS. The Indonesian seas have a collection of deep basins that are unrivaled anywhere in the world in complexity and number. The basins play an important role in the distribution of water properties and act as reservoirs to fluctuations in the Indonesian Throughflow. In many cases, deep oceanic water in the basins is isolated from neighbouring areas, including neighbouring basins, by shallower bathymetric features (table 3.2). Flushing may occur only over the deepest sill connection. Most of the deep basins are flushed from the Pacific Ocean, although a few are flushed by Indian Ocean water. The flushing may occur with tidal, seasonal or inter-annual time scales.
The bathymetry is so convoluted that it is difficult to isolate specific basins. For example, the Banda Sea contains a complex of primary and secondary basins. Among the primary north Banda Basin, south Banda Basin, Weber Deep and Flores Basin are several smaller basins. From the Weber Deep a narrow channel leads to the Wetar Trough which in turn is separated by a deep sill from the Sawu Basin. This interconnectivity is illustrated in figure 3.1, on which the main basins are identified. Gordon et al. (1994) and van Aken et al. (1991) provide discussions of the role of the deep basins in throughflow and oceanographic properties, respectively.
DEEPS. The Weber Deep may be considered as an extension or depression of the eastern end of the south Banda Basin. It has a maximum depth of 7440 m, a sill depth of 4300 m, and is bounded on the east by the arc of islands formed by' Seram Island, the Kai and Tanimbar groups of islands and the associated continental slope of these islands (fig. 3.2).
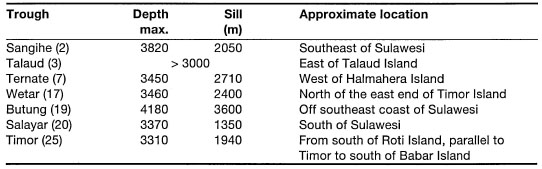
TROUGHS. The distinction between basins, troughs and trenches becomes blurred because of the continuum of shapes and depths that exist, particularly in the Indonesian seas. From a physical oceanographic perspective, troughs may be considered as not of sufficient size to act as reservoirs of deep waters, but do play important roles as conduits for the movement of deep water between basins, between islands and across island arcs. Deep flow through the Timor Trough (and the Aru Basin) originates from the Indian Ocean, and contributes to the formation of a recirculation pattern into the Seram Sea, north Banda Sea and back into the south Banda Sea before exiting again to the Indian Ocean. Some of this flow may rise over sills to reach the Molucca Sea and then sink to form part of the deep flow to the south. The significant troughs in the Indonesian seas as identified in figure 3.1 are listed in table 3.3.
Table 3.2. Main Indonesian sea basins. The bracketed numbers refer to the numbers used to identify features in figure 3.1.
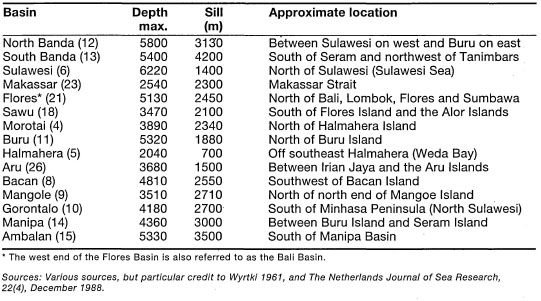
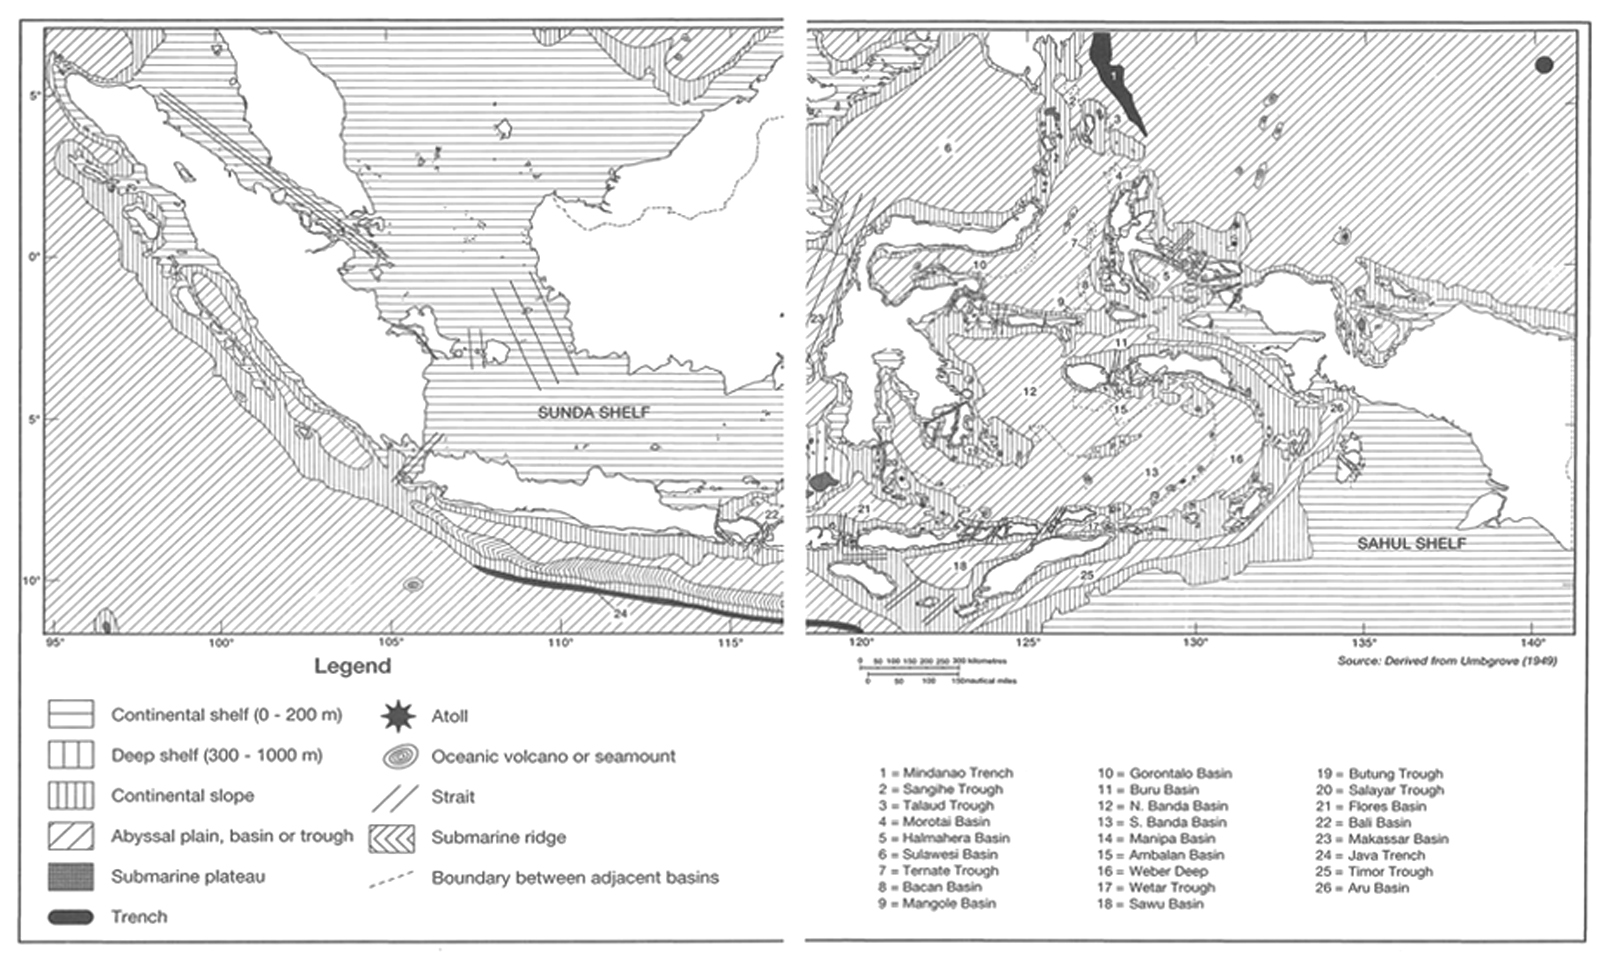
Figure 3.1. Bathymetric features of Indonesian seas.
From Salm and Halim 1984.
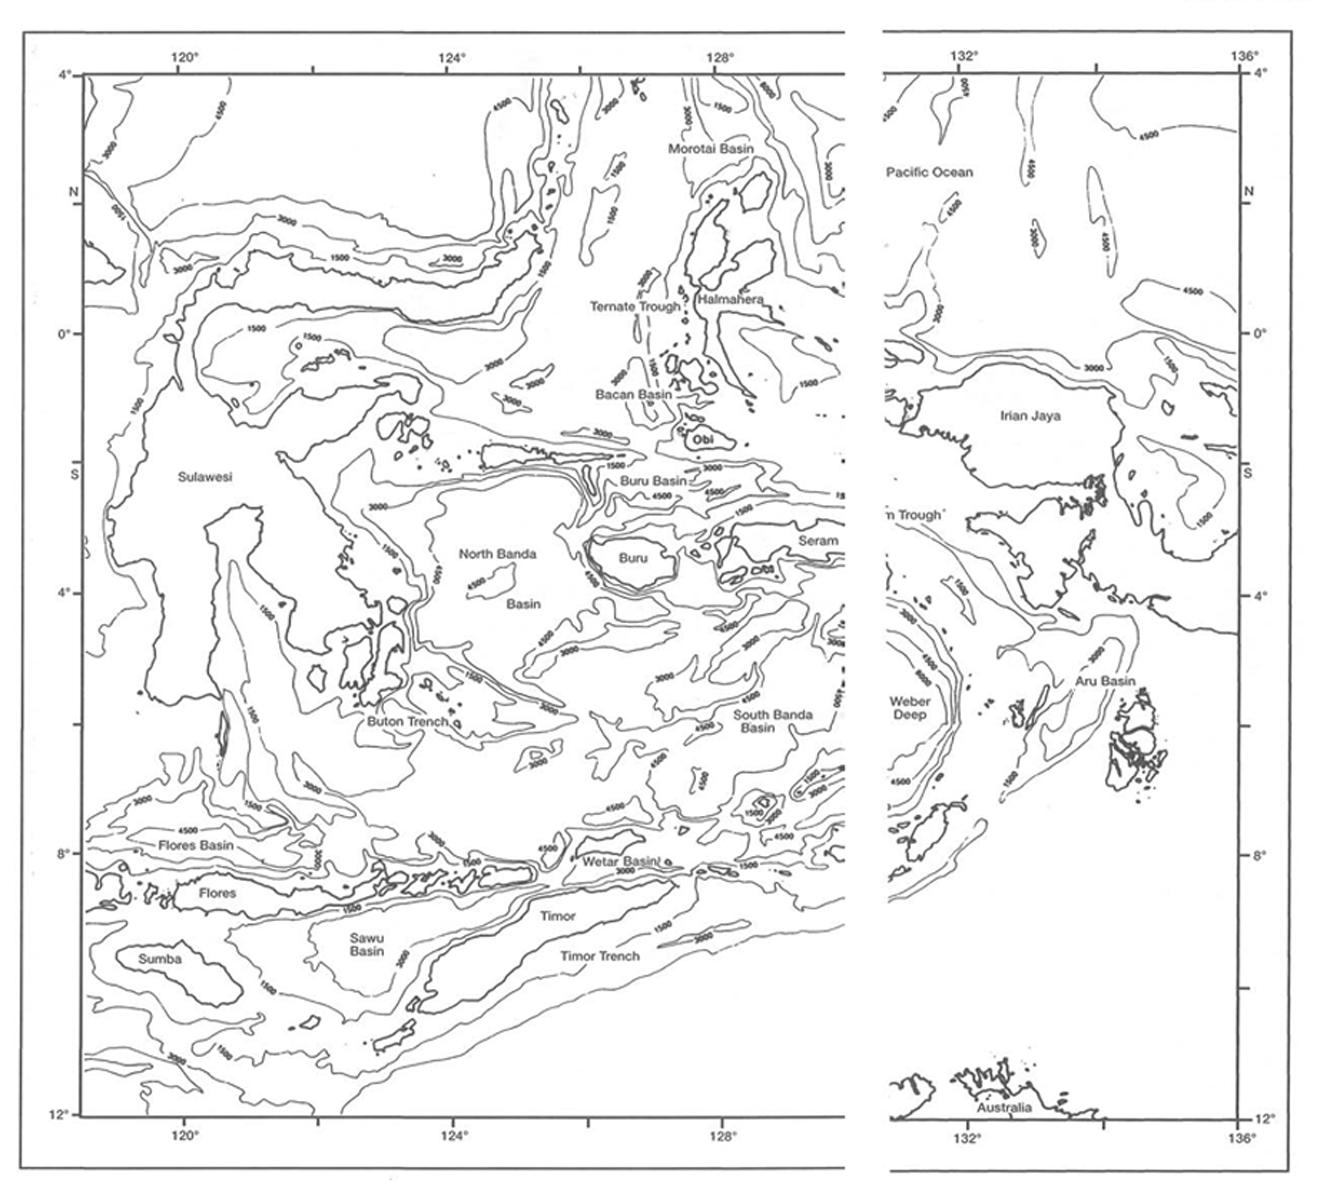
Figure 3.2. Bathymetry of eastern Indonesian sea basins.
From van Aken and et al. 1988 p. 316; fig. 1; NJSR 22(4), 1988.
TRENCHES. Trenches are inherently of interest because they mark the deepest parts of the ocean. One of the deepest parts of the ocean is found just off the northwest territorial boundary of Indonesia, but extends to within Indonesia's EEZ (Exclusive Economic Zone) jurisdictional boundary. The southward extension of the 10,800-m-deep Mindanao Trench begins just off the islands of Talaud, Karakelang and the small islands of Merampit and Nanusa, and runs northward along the east coast of the Philippine Islands.
The Java Trench is just south of and runs parallel to the submarine ridge referred to previously. It has a maximum depth of 7140 m.
General Circulation.
THROUGHFLOW. The Indonesian Throughflow (Arus Lintas Indonesia) plays a significant role in the mid-latitude circulations of the Pacific and Indian Oceans. Its study represents a significant portion of the physical oceanographic research that has been carried out in Indonesian seas during the past decade. The early 1990s provided descriptive detail and by the mid-1990s quantitative information was becoming available. An understanding of the mechanics is not complete but details are likely to follow as the results of TOGA and other studies become available.
Table 3.3. Troughs of Indonesian seas. used to identify features in figure 3.1.
The Indonesian Throughflow is driven primarily by the equatorial (southeast) Trade Winds. These winds cause sea level to be higher in the western Pacific Ocean (c. +15 cm) than in the Eastern Indian Ocean (c. -15 cm). The resulting pressure gradient, which is strongest in the eastern archipelago, sets up a general flow from the Pacific Ocean to the Indian Ocean. The volume transport of this flow is not certain, but Miyami et al. (in press) and Fieux et al. (1994) place the value at 20 ± 3 Sv to 22 ± 4 Sv6 respectively. The bulk of this flow (about 75%) is carried in the upper few hundred metres with transport below 1000 m contributing the remainder. Annual variations in the throughflow occur due to the strong modulation of the monsoons which originate over the Indian subcontinent. The through-flow is highest during the Southeast Monsoons (June to August) and lowest during the Northwest Monsoons of December to February. Interannual variations also occur if global weather patterns are interrupted, such as during the 1991 ENSO (El Niño - Southern Oscillation) event which delayed the Northwest Monsoons. The usual strong winds did not materialize, which resulted in reduced outflow to the Indian Ocean.
Even though the throughflow can be attributed to a simple fluid dynamical response to a head differential, the complex geography and bathymetry of the Indonesian Archipelago causes complex flow patterns which are even further distorted by strong tidal currents. Definition of the flow is rendered difficult since the geostrophic assumption of a balance between pressure gradients and the Coriolis force is weak at low latitudes and not applicable at the equator. Pressure gradients at and near the equator will be balanced by friction. Descriptive physical oceanographic approaches are complicated by precipitation, runoff, vertical mixing, horizontal advection and internal wave motions. Regardless, sufficient information is available to provide a qualitative description. The general description of the flow which follows is from Hautala et al. (in press).
The source waters of the throughflow are from the North Pacific and the South Pacific Oceans, with the western basins of Makassar Strait and the Flores Sea more heavily influenced by the North Pacific, and the eastern basins of the Seram and Halmahera Seas more influenced by the South Pacific. The shallowest part of the North Pacific flow is over the Sarangani Sill, across the Sulawesi Sea, southward through Makassar Strait and then eastward into the Flores and Banda Seas. Links to the Indian Ocean are provided by flows through Timor Strait, Ombai Strait and Lombok Strait. The last provides a direct exit route of the flow through Makassar and may account for up to 20% of the shallow flow into the Indian Ocean. Shallow flow from the North Pacific also may enter the Molucca Sea from the north and pass over the Lifamatula Sill into the Banda Sea. South Pacific water can enter the Banda Sea via the Halmahera Sea. Contributions of North Pacific water are aided by the Mindanao Current (Bingham and Lukas 1994) off the southeast coasts of the Philippine Islands. Contributions of South Pacific water are aided by the South Equatorial Current and the New Guinea Coastal Current.
Deep water throughflow, because of constraints imposed by sills, must follow more circuitous routings. Inflow from the North Pacific to the Sulawesi Sea is blocked below approximately 1500 m by the Sarangani Sill and below 2340 m by the continental slope between the Talaud and Morotai Islands. Since the 680 m Dewaking Sill at the south end of Makassar Strait prevents deep North Pacific water from entering the Flores Sea by way of Makassar Strait, the main supply of deep water to the Banda Sea comes via Lifamatola Strait. This means that below 300 m, South Pacific waters make a significant contribution to Banda Sea waters. In general, the deep throughflow (below 200 to 300 m) to the Indian Ocean comes via the Banda Sea. Figure 3.3 offers a schematic overview of the throughflow.

Figure 3.3. Schematic illustration of the deep (solid line) and intermediate (broken line) flows through the eastern Indonesian basins.
From van Bennecom et al. 1988. NJSR p. 358; fig. 5 Vol. 22(4), 1988.
Vertical Mixing and Advection. The characteristics of the waters of Indonesian seas result from interactions of the source waters from the North and South Pacific and, in the case of deep waters, from the Indian Ocean. The interactions modify the properties of the original sources and result in new water masses which flow into the Indian Ocean. To produce the waters observed, horizontal and vertical diffusive processes must be at work. These processes are the result of wind mixing from above, boundary mixing from below and intense tidal mixing. The properties of the intermediate waters are thus modified by mixing from above and below, and by horizontal mixing and advection. In the upper -200 m, vertical mixing of precipitation and run-off plays a crucial role. From below, boundary shears provide the mechanism for the upward transport of high salinity water into the intermediate waters. The weakened gradients of temperature and salinity and the movement towards uniform (isopycnal) vertical structure provide evidence of the vertical mixing. The overall tendency is for Indonesian seas to develop a three-layer system consisting of top and bottom mixed layers separated by a thick layer of isopycnal water.
The processes which cause the intense vertical and horizontal mixing include internal and surface waves, horizontal and vertical current shears, rugged bathymetry and coastal features and vigorous tidal currents. Measures of the intensity of the mixing are provided by the horizontal and vertical diffusivity coefficients7. The vertical diffusivity coefficient, Kv, has been estimated by Ffield and Gordon (1992) as ~ 1x10⁻⁴m2s-1 for the Banda Sea, and by van Aken et al. (1988) as ~ 10x10-4m2.s-1 for the deep eastern basins. This high latter value, which is one order of magnitude greater than the former and than the usually accepted deep ocean value (Gargett 1984), can be attributed to rapid flow over the rugged bathymetry and side walls found in the eastern basins. Such strong diffusivity will not only weaken vertical gradients but also expedite the rapid flushing of basins. Support is provided by Berger et al. (1988), who examined excess radon (222Rn) profiles which showed that vertical mixing processes of near-bottom water masses in the Indonesian Archipelago would not allow long basin residence times. Horizontal diffusivity also can be expected to be large. Strong horizontal velocity gradients are created by the many narrow straits and islands of the archipelago and across the Banda Sea by a juxtaposition of flows. Numerical model studies by Hatayama et al. (in press) illustrated horizontal mixing in the eastern seas with a corresponding horizontal diffusivity (KH) greater than 1x10³ m2.s-1.
Upwelling. Upwelling is the process by which water from below the surface replaces surface water that has been moved away by wind or by divergence. From a physical oceanographic perspective, upwelling is an expression of the principle of continuity and provides a link between surface and internal circulation. Within Indonesian seas, upwelling is usually in response to the seasonal development of the Asian monsoons and the Southeast Trades. Locations where upwelling occurs are off the southwest coast of Sumatra, the southwestern part of Makassar Strait, the south coast of Java, the Banda Sea, the Arafura Sea and the south coast of Bali.
West Sumatra: Upwelling develops off the southwest coast of Sumatra during the Northeast Monsoons which blow offshore from December through March. The surface flow is believed to contribute to the North Equatorial Current of the Indian Ocean.
Makassar Strait: The Southeast Monsoons move water from the Flores Sea which meets the water moving through Makassar Strait. The combined masses entrain surface waters from the southwestern section of Makassar Strait as they turn southward into the Java Sea, resulting in upwelling in that part of the strait.
South Java: There is a seasonal development of coastal upwelling south of Java in response to the development of the Southeast Trades during June, July and August. Upwelling also occurs between the northwest coast of Australia and the south coasts of Java and Sumba during the Southeast Monsoons. This is probably due to the divergence between the Java Coastal Current and the South Equatorial Current.
Banda and Arafura Seas: The Banda Sea is a region of basin wide upwelling. In the east Banda and Arafura Seas, the upwelling is seasonal. The upwelling develops under the influence of the Southeast Monsoon of May to August and flows with the Timor Current into the Indian Ocean. A lowering of sea level during August and September marks the end of the upwelling season.
South Coast of Bali: Near the south coast of Bali, upwelling occurs in the near surface layer under the effect of the Southeast Monsoon. Easterly winds generate the strong westward Java Current. This surface current reverses direction with the monsoons. The upwelling is sufficiently strong that an upper mixed layer may not develop. Alternatively, it may have depths ranging from zero to 90 m.
Water Structure.
WATER MASSES. The waters of the Indonesian seas are primarily an extension of the waters of the Pacific Ocean, although this statement is open to discussion (Godfrey et al. 1993; Wajsowicz 1993). The distinguishing characteristics of Pacific waters are low salinities and mid-depth salinity minima. Further distinguishing characteristics of note are low salinity and high tritium values for the North Pacific, high oxygen, low silicate and high chlorofluorocarbon (CFC) values for the South Pacific and low oxygen values for the Equatorial Pacific. These characteristics allow the origins of the source waters to be tagged, provide clues on the flushing times of eastern basins and aid in the tracing of water types and hence general circulation and throughflow movement.
The dynamical processes operating in the Indonesian Archipelago provide a tendency towards the development of a three-layer system. These layers may be described (Hautala et al. in press) in terms of potential density, δθ8. The surface layer, for which δθ < 25.75, is the upper 200 m where vertical mixing is in excess of precipitation and runoff. The intermediate layer is the main thermocline (25.75 < δθ < 27.0) between 200 m and 500 m and marks an isopycnal (constant density) distribution of North and South Pacific water sources. Within the lower, or deep, layer (where δθ > 27.0) a variety of mixing processes are needed to explain water-mass characteristics.
The water masses associated with the Indonesian Throughflow exhibit monsoonal variations (Ilahude and Gordon in press). These may be illustrated by means of T-S plots (actually plots of potential temperature vs. salinity).
Southeast Monsoons (June to August)9. During the Southeast Monsoons, the TS plots (fig. 3.4) exhibit three conspicuous features.
(1) At temperature 20°C there is a wide range of salinities10 (~ 34.5 to ~ 34.8 psu11) which is the result of the interaction of the salinity maximum of the high-salinity North Pacific Subtropical Water with the diluted layers of the Banda Sea.
(2) At 14°C, there is a narrow range of salinity centred about 34.55 psu which can be attributed to the intersection of waters from the Banda Sea and Makassar Strait.
(3) At 10°C there is another wide range of salinities resulting from a combination of waters. The original sources are the low-salinity (~ 34.3 psu) North Pacific Intermediate Water (NPIW) and mid-thermocline water of about 34.6 psu from the subtropical South Pacific (or, SPSW for South Pacific Subtropical Water). The NPIW enters Makassar Strait via the Sulu and Sulawesi Seas, moves southward, and as it exits Makassar Strait turns easterly and flows into the Flores and then Banda Seas. The saltier SPSW is directed into the Halmahera Sea by the South Equatorial Current and spreads into the Banda Sea from the north where it mixes with the now spatially and temporally modified NPIW to form the observed wide salinity range found at the 10°C isotherm.
Variations on the general T-S curve shown occur in the Timor Sea (Indian Ocean influence) and the Molucca Sea (Antarctic deep water influence).
Northwest Monsoons (December to February). Significant changes are evident in the T-S plots (fig. 3.4) during the period of the Northwest Monsoons. The sea surface temperature (SST) is on the average 3°C warmer, and sea surface salinity (SSS) shows a much greater range (31.1 psu in southern Makassar Strait to 35.1 psu in the Timor Sea). The influence of the SPSW salinity maximum is reduced although the mechanism is not clear. Possible reasons are the reduction in through-flow and the vigorous downward mixing of low-salinity water during the rainy Northwest Monsoon season.
VERTICAL STRUCTURE. Indonesian seas exhibit a variety of vertical structures from the homogeneous haline water of the Banda Sea, due to strong tidal mixing, to the step-like structures found in the Flores Sea, due to the interleaving of different water masses. For purposes of illustration, this discussion is limited to vertical profiles of temperature and salinity.
TEMPERATURE PROFILES. Sea surface temperatures typically range from just over 25°C to just below 30°C and decrease only one or two degrees with depth to a level of about 80 db12. The main thermocline is usually found between about 80 to 200 db with a gradient of-0.1°C/db. The thermocline weakens between 200 and 300 db, with the temperature decreasing from 10°C to 8°C. At 1000 db temperatures are between 4°C and 5°C. The largest variations from one geographic area to another are found in the upper 200 to 300 db with monsoonal variations most evident from the surface to 80 db.

Figure 3.4. Potential temperature-salinity relation for the Southeast Monsoon (left) and the Northwest Monsoon (right).
From Ilahude and Gordon in press.
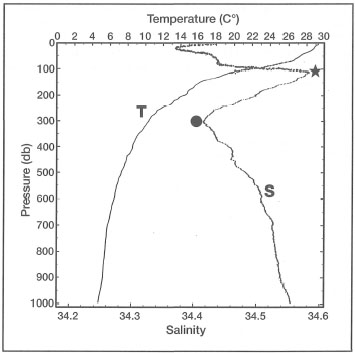
Figure 3.5. Temperature (T) and salinity (S) profiles for west Flores Sea. Note the salinity maximum (![]() ) associated with the North Pacific Subtropical Lower Water, and the salinity minimum (
) associated with the North Pacific Subtropical Lower Water, and the salinity minimum (![]() ) in the deeper layer associated with the North Pacific Intermediate Water.
) in the deeper layer associated with the North Pacific Intermediate Water.
Modified from Gordon et al 1994 (p. 18,237; fig. 2a).
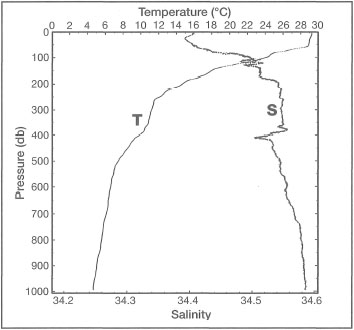
Figure 3.6. Temperature (T) and salinity (S) profiles for central Banda Sea.
From Gordon et al. 1994 (p. 18,237; fig. 2b).
SALINITY PROFILES. Sea surface salinities range from about 31.5 to 34.5 psu depending on season and location. The former, of course, is a reflection of the rainy Northwest Monsoon season. At the 100 db level salinity is quite stable at around 34.5 psu. Salinity maxima in excess of 34.5 are found between 80 to 150 db and salinity minima between 250 to 400 db. From 400 to 1000 db salinity values increase from about 34.5 to 34.6 psu. The salinity maxima are associated with North Pacific Subtropical Water and the salinity minima with North Pacific Intermediate Water.
The vertical structures of temperature and salinity for the Flores Sea, west Banda Sea and the northeast Sawu Sea shown in figures 3.5 to 3.7 illustrate some of the generic features discussed above as well as the smooth versus step-like structures between Banda and Sawu or Flores.

Figure 3.7. Temperature (A) and salinity (B) profiles for Obi Strait in the northeast Savu Sea. April-May, 1993.
From Ilahude et al. in press.

Figure 3.8. Schematic view of tidal wave propagation into the Indonesian seas from Pacific and Indian Oceans. See table 3.4 for details.
From Hatayama et al. in press.
Tides and Waves.
TIDE ORIGINS AND TYPES. The significance of tides to the physical oceanography of Indonesian seas has been noted. Tides influence the vertical water structure, the formation of water masses, the transport of throughflow and, on a global scale, contribute to planetary energy dissipation.
The tides of Indonesian seas are caused by tidal wave propagation across the shelves and into the basins from the Pacific and Indian Oceans. A co-oscillation results which is greatly complicated by the complex bathymetry and coastal geometry. Diurnal (once a day), semidiurnal (twice a day) and mixed tides are found, although in large regions of the archipelago diurnal tides prevail. This is to be expected since the convoluted geological structure acts as a low pass filter. In general, diurnal tides are found in the Java Sea, semidiurnal tides off West Sumatra and mixed tides in the eastern archipelago. Strong tidal currents occur in the narrow straits, such as Lombok and Malacca, and in the Java Sea. Hatayama et al. (in press) list five routes for tidal wave propagation into the Indonesian seas; three from the Pacific Ocean and two from the Indian Ocean. These are shown in figure 3.8 and described in table 3.4.
The principal harmonic constants13 needed to describe the tides of Indonesian seas are M2, S2, K1 and O1. The ratio of the diurnal to the semidiurnal components [(K1+01)/(M2+S2)] provides a convenient classification of the four most commonly occurring types of tide (table 3.5) (fig. 3.9). Their geographic distribution in Indonesian seas is illustrated in figure 3.10.
Table 3.4. Routes of tidal-wave propagation into Indonesian seas. See figure 3.8 for schematic presentation.
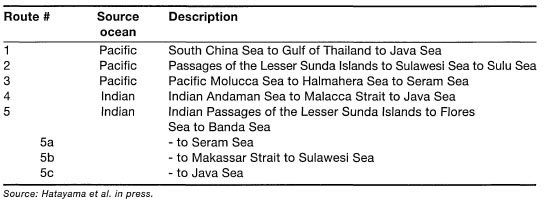
Table 3.5. The principal harmonic constants and their ratios.


Figure 3.9. Examples of different types of tides from four different regions of the Indonesian Archipelago. A) Siapi-Api, Malacca Strait; B) Selat Muli, Arafura Sea; C) Sungai Kotawaringin, north Java Sea; D) Tanjung Pandan, Gelasa Strait. Based on predictions for 1-24 April 1994.
Source: Dinas Hidro-Oseanografi 1994.
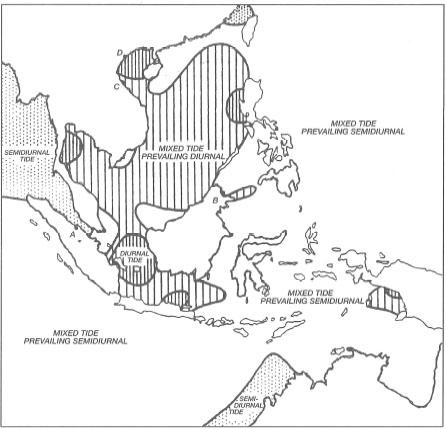
Figure 3.10. Geographic distribution of tide types in Southeast Asian seas.
From Wyrtki 1961.
Table 3.6. Duration, fetch and wave height for a fully developed sea.

INTERNAL WAVES. Internal waves, which occur within the ocean, are a manifestation of gravity waves which occur on all density gradients. Since gradients of temperature and salinity (hence density) are the norm, internal waves are as ubiquitous within the ocean as surface gravity waves are on the sea surface. Wavelengths range from tens of metres to tens of kilometres, periods range from minutes to days, and amplitudes are typically tens of metres. The large displacement of isopycnals (isohalines, isotherms) are a source of sampling error for transports derived from salinity and temperature measurements.
Internal waves have their largest vertical displacements and largest velocity gradients (shears) at the strongest vertical density gradients. When the stabilizing influence of the density gradient (and gravity) can no longer match the destabilizing influence of the shear, internal waves break and mix the waters above and below the gradient maximum.
The thermoclines of Indonesian seas tend to be highly stratified and so provide the mechanism for vigorous internal wave motions which may see isopycnals undergoing vertical displacements of 90 m. When coupled with strong tidal currents and rugged bathymetry, internal wave breaking and mixing become the norm. Measurements by Molcard et al. (in press) and Ffield (in press) support this argument. The former found internal wave motions with periods that ranged from a few minutes to 2.4 days, with strong peaks at diurnal and semidiurnal periods. Pycnocline excursions were up to 50 m. The latter reported vertical motions of 70 m in the Sulawesi Sea, 30 m in Makassar Strait, 40 m in the Flores Sea, 55 m in the Banda Sea, 70 m over Lifamatola Sill and 90 m in the Seram Sea.
In addition to mixing by internal waves of periods of minutes to hours, internal waves of tidal period may play important roles in modulating the flushing of deep basins, such as the South Banda Basin (van Aken et al. 1991) and the Weber Deep (Lek 1938).
SURFACE WAVES. Surface gravity waves are generated by the wind blowing over the sea surface. Wave height increases with the speed of the wind, the time or duration that the wind acts on the waves, and the distance of sea (fetch) over which the wind blows. The wave height does not increase without limit. A point is reached at which the amount of energy added to the wave from the wind is balanced by the energy extracted from the wave by dissipative forces, primarily from wave breaking. When such an equilibrium is achieved, the wave (or sea) is said to be fully developed. The relationship between wind speed, duration, fetch and wave height has been determined empirically with some precision (table 3.6). This table shows that large waves can develop only on the outer boundary islands of the Indonesian Archipelago. The interior Indonesian seas are all fetch limited. Large waves can occur off the southwest coast of Sumatra, the south coasts of Java, the south coasts of the islands of Nusa Tenggara Barat and Nusa Tenggara Timur, the northeast coasts of Irian Jaya and Halmahera and the islands at the entrance to the Sulawesi Sea. These coasts will also experience ocean swell, usually of less than two metres, but occasionally up to two to four metres.
Most of the larger islands of the archipelago will experience land/sea breezes. The sea breezes are strongest in the afternoon and create a chop that may be felt 10 to 20 km seaward. If aiding a monsoon, sea breezes may reach 40 km.hr-1. If opposing a monsoon, they will be light.
A comprehensive body of literature on surface waves in Indonesian seas is yet to be developed.
METEOROLOGY
Influences of Geography and Geology
Regional Setting. The Indonesian seas span the equator from 6°08' N to 110° 15' S, and are situated between the Asian continent to the north and the Australian continent to the south and between the Pacific Ocean on the east and the Indian Ocean on the west. They are thus strongly influenced by the displacement and intensity of the Inter-Tropical Convergence Zone (ITCZ), the Asian and Australian landmasses, and the Indian and Pacific Ocean air masses.
Archipelagic Features. The sea area is approximately four times a land area which is made up of a large number of islands, some of which are large (table 3.1) and mountainous14. These tropical islands will generate thermal influences and cause deviations to the wind field.
The General Climate
Annual Weather. There are two seasons, wet and dry, which are separated by transition periods. The dry season, which runs from June to September, is influenced by the Australian continental air masses and is the time of Southwest Monsoons (fig. 3.11). The wet season, which runs from December to March, is influenced by Pacific Ocean and Asian continent air masses and is the time of Northeast Monsoons. During these seasons, the winds are steady and light to moderate. The transition periods of April – May and October – November feature weak and unsteady winds. The normal wind conditions during the four seasons are illustrated in figures 3.12 to 3.15 (data compiled by Dr. Paulus Agus Winarso, Meteorological and Geophysical Agency, Indonesia). The seasons are neither rigidly wet and dry nor precise in their time of occurrence over all regions of the archipelago. Rains may fall at any time of year and in the Moluccas the wet and dry seasons are reversed. In general, the wet season has a little more rain and a little less sunshine than the dry season.
Weather Parameters.
TEMPERATURE AND HUMIDITY. The day-to-day and season-to-season variations are small. Location, latitude and altitude have much greater influences on weather conditions. Coastal plains average 28°C, inland and low mountains about 26°C and high mountains 23°C. The relative humidity tends to be high everywhere with values of 70% to 90%.
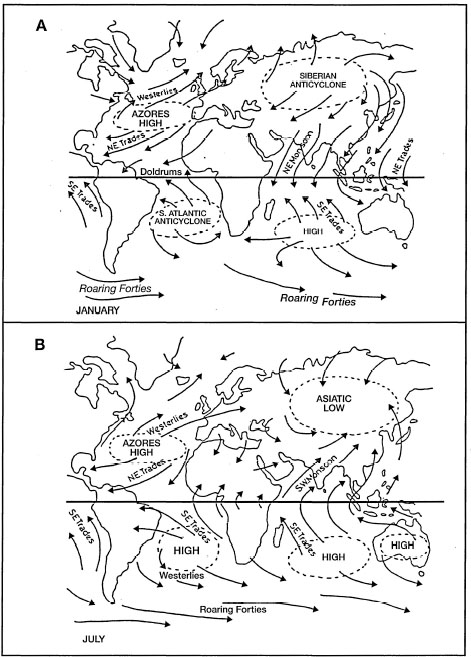
Figure 3.11. Global weather systems that influence the formation of the Northwest (A) and the Southeast (B) Monsoons.
From Robert 1985.
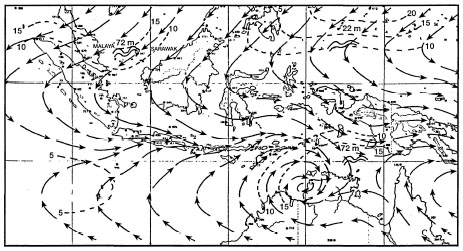
Figure 3.12. General wind patterns under normal conditions for January (Northeast Monsoon), averaged over a 30 year period. Arrows indicate wind flow; dashed lines are isotachs in knots and ≈ is the wave height in metres.
Prepared by Dr. Paulus Agus Winarso, Meteorological and Geophysical Agency, Indonesia.

Figure 3.13. General wind patterns under normal conditions for April (transition period), averaged over a 30 year period. Arrows indicate wind flow; dashed lines are isotachs in knots and ≈ is the wave height in metres.
Prepared by Dr. Paulus Agus Winarso, Meteorological and Geophysical Agency, Indonesia.
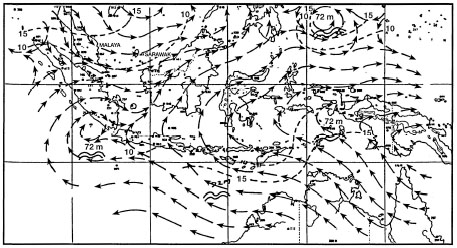
Figure 3.14. General wind patterns under normal conditions for July (Southeast Monsoon), averaged over a 30 year period. Arrows indicate wind flow; dashed lines are isotachs in knots and ~ is the wave height in metres.
Prepared by Dr. Paulus Agus Winarso, Meteorological and Geophysical Agency, Indonesia.
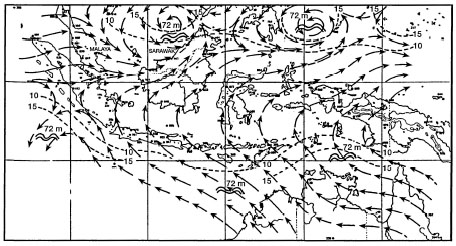
Figure 3.15. General wind patterns under normal conditions for October (transition period), averaged over a 30 year period. Arrows indicate wind flow; dashed lines are isotachs in knots and ≈ is the wave height in metres.
Prepared by Dr. Paulus Agus Winarso, Meteorological and Geophysical Agency, Indonesia.
RAINFALL. Rainfall tends to be frequent and intense, but not of long duration. The amount varies greatly with location and altitude. Along the mountain slopes of north Java rain may occur almost every day but on the island of Sumba rain is seldom. The orientation of mountains to the wind has an appreciable effect. For example, Medan, on the east coast of Sumatra, experiences a minimum rainfall of 90 mm in February, a maximum of 260 mm in October and a total annual rainfall of 2 m. Padang, on the west coast of Sumatra, experiences a minimum rainfall of 220 mm in February, a maximum of 430 mm in October and a total annual rainfall of almost 4 m.
SUNSHINE AND CLOUD. The tropics are in a region of convergence of surface winds. Warm, moist air is lifted upwards, resulting in the formation of clouds and rain. The average cloud cover is five to six oktas (i.e., 5/8 to 6/8 of the sky is cloud-covered). In general, cloud cover tends to be less at night and at a maximum in the afternoon. Sunny periods are most likely to occur before noon. Coasts and mountains facing the prevailing winds have greater cloud cover, with the lee sides experiencing good sunny periods.
ATMOSPHERIC PRESSURE. Equatorial regions are marked by low atmospheric pressure for the reasons cited above. Over much of the region, a shallow equatorial trough of low pressure is found throughout the year. Regionally, from December to March pressure is high over the Asian continent and low over Australia. The pattern is reversed from May to October, the period of Southwest Monsoons. During the periods between (the transition periods), pressure is almost uniform at 1010 mb15 with a diurnal range of about 3 mb.
The Monsoon Seasons
Indonesian seas are almost ideally located to experience monsoonal weather. They span the equator, are located beneath the Inter-Tropical Convergence Zone, and are between landmasses to the north and to the south. The seasonal weather changes in the archipelago are determined by two great opposing monsoons, which converge along the Inter-Tropical Convergence Zone (ITCZ). The ITCZ migrates north and south with the Sun, heralding the change from one monsoon to another.
Northeast Monsoon. The Northeast Monsoon develops during December and January when there is high pressure over Asia and low pressure over Australia (see fig. 3.11). From December through March, when the ITCZ is farthest south, air from the Northern Hemisphere flows steadily into the archipelago most of the time. The winds carry moist air which falls as rain across the archipelago. The winds are steady, especially over the sea, but gentle rather than strong. The winds will deviate in direction as they encounter mountains and thermal influences of land. During this period the ITCZ is just north of Australia but south of the equator. By February, the ITCZ is over Java and the Sunda Islands.
Southeast Monsoon. The Southeast Monsoon occurs during June and July when there is high pressure over Australia and low pressure over Asia. Little moisture is carried by the air. The winds are steady at speeds typically between 3.5 and 5.0 m.s-1 (gentle breeze). Deviations in speed and direction will occur over the seas due to the presence of major islands. The ITCZ, which follows the Sun, is now north of the equator.
Transition Periods. The transition from the Northeast Monsoons begins during March when the ITCZ is on the equator and moving northward. There is a weakening of the Asian high. The transition from the Southeast Monsoons begins in September when there is a weakening of the Australian high. The ITCZ is on the equator and moving southwards. During the transition periods winds are light and variable.
The transition from one monsoonal flow to another, at any one locality, is not usually a quick definite process but involves weak changeable winds interspersed with stretches of both the retreating and advancing monsoons. The seasons are based on average conditions, but in any given year variations in the strength of the monsoonal flows can hasten or retard the occurrence of any season. Convergence Zones are probably the most important source of widespread cloudiness and precipitation in the area.
Trade Winds
The Trade Winds are the lower branch of the Hadley Cell, a meridional vertical circulation, which dominates low- (less than 300 m) latitude atmospheric motion. The Trade Winds move over the ocean surface and carry water vapour towards the equator. The Trade Winds from the Northern and Southern Hemispheres converge near the equator to form the Inter-Tropical Convergence Zone. The converging flows move upwards, water vapour condenses and heat is released. Large cumulus and cumulonimbus clouds result and the latent heat released drives the Hadley circulation. During the transition seasons, monsoonal and Trade Winds may be difficult to distinguish. The Southeast Trades are augmented when the ITCZ is moving north and the Northeast Trades are augmented when the ITCZ is moving south.
Variability
Local Winds. Local winds develop from land/sea breezes or from a turning of the wind direction by a landmass. The steep-sided west coast of Sumatra causes Southwest Monsoons to run parallel to much of the coast. Land/sea breezes, as mentioned earlier, may augment or detract from prevailing winds. The combined effects may result in increased rainfall on the windward side and in increased sea surface roughness (chop).
Annual. Monsoons vary in strength from year to year, sometimes dramatically so. The variability of the monsoons means that some rainy seasons may be more intense and extended and some dry seasons may be prolonged with no water. From a human standpoint, the result may be flooding in the former and crop failure in the latter. From a physical oceanographic point of view, such variations result in changes in sea surface salinity, changes in circulation, changes in the distribution of water masses and changes in the distribution of sea surface temperature. These in turn causes additional changes in wind patterns.
Interannual. El Niño - Southern Oscillation, or ENSO, events (if sufficiently severe) can cause disruption of weather patterns on a global scale (see box 3.1). Indonesian seas not only play a role, perhaps major, in triggering ENSO events, but they are also recipients of the effects. Specifically, the ITCZ maybe shifted thousands of kilometres from its expected position and seriously disrupt the expected weather patterns in Indonesia and Australia. ENSO events are aperiodic and in this sense similar to a physical process that is in unstable equilibrium.
ECOLOGICAL SIGNIFICANCE OF PHYSICAL PROCESSES
Ecological and Physical Processes
The fortunate circumstances of geographic location and form result in Indonesian seas being one of the most productive and richest reservoirs in the world. There are c. 800 species of seaweeds, 12 species of seagrasses, highly productive coastal wetlands, 90 species of mangroves, 80 genera of corals (the world's richest coral diversity), 6 species of turtles, 155 species of sea birds, over 25 species of whales and dolphins and the richest fish species diversity in the world. Further, the distribution of these resources is spread widely across the archipelago.
Physical processes play a significant role by providing the mechanics for the ecological processes to flourish. These will become evident in other chapters. The following is a sketch of the role played by some of the physical processes that were discussed in earlier sections.
Physical Oceanography
Throughflow. The prevailing motion of the throughflow is from the Pacific to the Indian Ocean. There is some movement of Indian Ocean water from the south into the eastern seas, but this is recycled southward through the islands of Nusa Tenggara Timur (NTT) and back into the Indian Ocean. The throughflow provides an avenue for Pacific Ocean biota to penetrate far into Indonesian seas before modification of water masses becomes recognizable. Pacific Ocean flora and fauna, or their close relatives, can be expected to be found in Indonesian seas. Indian Ocean forms will be found in the southeastern seas.
Upwelling. Upwelling provides the means by which nutrients can be brought into the sunlit upper hundred metres or so of the ocean (i.e., the euphotic zone). The addition of soluble nutrients, particularly nitrogen and phosphorous, creates nutrient-rich surface waters in which phytoplankton can flourish. Phytoplankton are the basis for primary productivity16 which is measured in terms of grams of carbon produced over each square metre during a period of one year (g C•m-2•yr-1). Tropical oceans are typically low primary producers because of low nutrient levels. Indonesian seas, however, are among the most productive in the world. This is in part due to upwelling and intense vertical mixing which insures that nutrients are brought to the surface and not trapped below the thermocline. The specific areas of high primary production are the Banda Sea, Makassar Strait, the Halmahera Sea, North Sumatra and the southern coasts of Bali and the islands of Nusa Tenggara Barat (NTB) and Nusa Tenggara Timur (NTT).
Bathymetry. The deep basins and trenches provide unique habitats which can see the development of unusual lifeforms. The sills and ridges are typically areas of intense shear and mixing which contributes to the redistribution of nutrients.
Mixing and Advection. These processes ensure the continual replenishment and redistribution of nutrients and contribute to the widespread distribution of plankton. The result is that commercially viable fishing areas are found throughout Indonesian seas. These processes are also partly responsible for providing the environment that allows for the rapid and diverse growth of corals.
Meteorology
Winds and Waves. Winds generate the waves which contribute to the replenishment of oxygen in the nutrient-rich upper few hundred metres. Wind-driven circulation of the upper layers continually refreshes the waters in which coral reefs are found and takes away the nutrients generated in mangrove and seagrass areas as well as the nutrients and sediment which enter the seas from rivers and runoff.
Precipitation. Precipitation has beneficial and detrimental effects. The runoff from land and rivers due to the heavy rains found over most of the archipelago will contain nutrients, but may also contain toxins associated with agriculture, commercial and domestic activities. Indonesian rivers tend to be heavily silt-laden due to naturally occurring and anthropogenic activities. Heavy rains may extend river plumes containing silt and toxins into coral reef and aquaculture areas that were previously unaffected.
Monsoons. Indonesian weather is dominated by the monsoons. The currents generated by the monsoons, coupled with the pressure-gradient-driven throughflow, assist in the flushing of basins, horizontal and vertical mixing, and the transport of water masses.
ENSO-Events. El Niño-Southern Oscillation events may cause serious and relatively long-term (several months) disruption of normal weather patterns. During normal weather, there are strong easterly winds in the eastern Pacific and cool water moves from east to west. During ENSO events, the winds weaken and warm water of the western Pacific moves eastward. This results in low rainfall and droughts throughout Australasia (see box 3.1). Because wind patterns are disrupted, changes occur in normal current patterns and in the distribution of water masses. During ENSO events, new species can be introduced into Indonesian seas.
Box 3.1. Drought and El Niño (ENSO).
J.R.E. Harger, UNESCO/ROSTSEA, Jl. Thamrin, Jakarta.
The major features in the development of the El Niño - Southern Oscillation (ENSO) involve oscillation of the Pacific Ocean-atmosphere in an essentially unpredictable (chaotic) fashion. The system moves between extremes of so-called "warm events" lasting one or two years and involving movement of warm seawater from the western Pacific along the equator to impact on the west coast of the American continent, and "cold-events" associated with easterly trade-winds-induced flows of cold water from the eastern Pacific towards the west. Historical data indicate that ENSO years as experienced by the island of Java are either much warmer than non-ENSO years or only slightly, if at all, warmer than normal (non-ENSO) years. Hot-dry years within the ENSO warm event cycle are almost always followed by cooler wet years and vice-versa. This pattern also extends to include the year immediately following the terminal year of an ENSO warm event set. The initial year of an ENSO warm event set may be either hot, with a long dry season, or relatively cool (nearer to the temperature of a non-ENSO year) and having a short dry season. Of the nine ENSO warm events since 1950, the initial year tends to have been hot and dry for six (1951, 1957, 1963, 1972, 1982, 1991), and neutral or cool and wet for three (1968, 1976, 1986).
The increasing annual trend in air temperature exhibited by the mean monthly values over the period 1866-1993, for Java (Jakarta and Semarang data pooled), is 1.64°C (0.0132°C per year from 25.771 °C to 27.409°C) (fig. 3.16). The major industrial development in infrastructure for Jakarta has been significant only since about 1980, and was not apparent before 1970 when the city had the aspect of an extended village with few large buildings (greater than 3-4 stories), and no extensive highways. The 1.64°C difference between 1866 and 1991 can presumably be partitioned into: 1) urban heat-island effect, 2) effect of deforestation, 3) effect of secular microclimate shift, and 4) influence of general global warming with particular reference to the tropics.
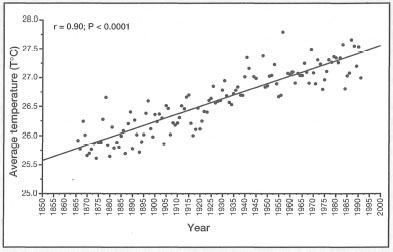
Figure 3.16. Average yearly air temperatures for Jakarta/Semarang during the past 127 years.
When the blocks of non-ENSO years in themselves are considered, the deviations from the secular trend, for warmest-month mean temperatures in successive years, are correlated with that of the next immediate year deviation so that either continual warming or cooling appears to take place from the termination of one ENSO to the initiation of the next. When the deviations around the secular trend shown by the warmest-month average temperatures are summed for the inter-ENSO intervals (the separate non-ENSO years), the resultant "heatloading" index is positively correlated with the following (initial) ENSO warmest-month deviation from the overall ENSO warmest-month secular trend. This provides an immediate predictive mechanism for the likely strength of an ENSO, in terms of the dry season impact on the island of Java, should one occur in the next year to break a non-ENSO sequence. The length of the build-up and the build-up achieved seems not to be related. The relationship does not in itself, however, predict the occurrence of the "next" ENSO.
The data show that a consistent structure underlies ENSO events for the last century and a quarter. However, as a process monitored by mean monthly air-temperature measurements at Jakarta-Semarang, the system is changing in character with time in association with an overall atmospheric temperature increase in a way that involves increased intra-annual temperature fluctuations. In general, ENSO years are associated with higher temperatures than non-ENSO years (fig. 3.17), with a significant negative correlation between subsequent years which are thereafter systematically cooler. This may be because the ENSO event actively mixes excess heat energy into the ocean-sink to an extent that is in direct proportion to the outstanding positive temperature deviation. A weak ENSO, preceded by a relatively modest temperature build-up in the lead-up non-ENSO years, then results in limited mixing which leads to a relatively warm subsequent year while a stronger event leads to extensive mixing and so generally in a following very much cooler year.
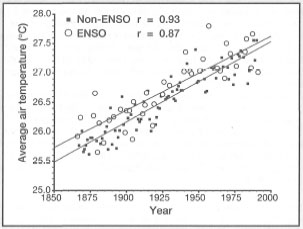
Figure 3.17. Average yearly air temperatures of ENSO and non-ENSO years in Jakarta/Semarang during the past 127 years.
The differentiation between non-ENSO – ENSO blocks showing trends of positive "heat-loading" indices, as opposed to those showing decreasing trends, suggests that the heat build-up alone may not be the only critical variable, but that perhaps two sub-categories of ENSO-initiating mechanisms may be involved. These two mechanisms may be categorized as those dominated by heat forcing and those dominated by water-mass forcing. Both of them, however, generate heat redistribution into the Pacific Ocean. Atmospheric temperature build-up, possibly associated with the greenhouse effect, may be coupled to an increasingly wider temperature swing in west and central Java. This temperature swing is associated with the warm pool influence, but anchored by the ocean-sink.
The warm-month Jakarta/Semarang deviates, themselves, may be directly related to the size and relative movement of the Western Pacific Warm Pool, particularly in the ENSO warm-event years. The most obvious time periods to seek temperature-induced changes in biomass burning in Southeast Asia would undoubtedly correspond with ENSO warm-event years, and particularly those in which marked positive deviations from the overall secular trend are apparent. In recent years these are 1991, 1987, 1983, 1982, 1972, 1963, 1958(7), 1957, 1953 and 1951. The heat build-up in Southeast Asia and the western Pacific presumably commences before the Kelvin wave resurgence from the western to the eastern Pacific, which seems to have started in October to mid-December in recent years, although in 1993 a Kelvin wave was also detected in August and then in late October (Kousky 1993). The warmest month of the first ENSO year usually takes place in either September (three times in the record), October (18), or November (four), and can also show up in May (seven) and June (two) as well. In itself, a significant warm deviation above the secular trend in average monthly temperature for any of these months signals an upcoming warmer-than-average ENSO with a hit ratio of 21:6.
Teleconnections
The influence of ENSO events is apparently far reaching. During such events in the Pacific, rainfall is increased in Kiribati, Tuvalu and the northern Cook Islands, but decreased in southern Cook Islands, Fiji and Tonga. The "great dry event" of 18771878 was of global proportions, being the proximal cause of millions of deaths from famine in India and China. Particularly severe effects were associated with the 1982-1983 ENSO (warm) event, and these are now called ENSO-climate teleconnections, defined as "climate anomalies which tend to occur during most if not all ENSO events" (Nicholls 1987).
Suspected teleconnections associated with warm ENSO events are given by Kerr (1992), and may be summarized as warm and dry in Southeast Asia extending north and south of the equator with a wet area around the equator in the central Pacific with another dry area in the northeast of South America. Wet areas occur in the southeast and southwest of the U.S.A. as well as northeast of South America, southeast of South America and also east Africa. Warm areas occur in south Asia, east Asia, northwest of North America, southeast Africa, southeast Australia and east of South America.
Drought
Indonesia lies on the western margin of the ENSO interaction and for the most part enjoys a humid tropical climate, except in the easternmost regions. Indonesia presently supports extensive tracts of tropical rain forest, apparently amounting to some 117.9 million ha in 1990. This represents about 6.4% of the 1982 total global estimate, which was roughly 1838 million ha. For Indonesia, the ENSO-associated warm event drought (fig. 3.18) of 1991 led to the failure of 190,000 ha in paddy with an overall 843,000 ha affected. This event caused unprecedented losses in rice production to Indonesia, resulting in 600,000 tonnes being imported to the previously self-sufficient archipelago. In 1982-1983, the ENSO-associated drought of that time resulted in 420,000 ha of paddy being affected and failure of 158,000 ha. The 1982-1983 drought was also accompanied by forest fires, which burned 3.7 million ha of generally second-growth timber, mainly in Kalimantan. An area of 88,000 ha burned in 1991 (Jakarta Post 30 November 1991), largely in Kalimantan, in association with the 1991-1992 ENSO event. An extensive pall of smoke developed over Kalimantan, Singapore and Malaysia during September-October 1991. The length of the dry season has progressively increased in Central Java from 1909 to the present.
Some measure of a response to the dry season conditions first developing in the Philippines and then in Indonesia might be seen in the instigation of famine-inducing droughts in the Horn of Africa, starting in the beginning of the year following the appearance of high temperature and low rainfall dry season in equatorial Southeast Asia. Ayalew, M. (pers. comm.) indicates that, in recent years, famine-events associated with droughts have occurred in Ethiopia after one year following the warm events, terminating the ENSO-blocks of 1952-1953, 1959-1963, 1970-1972, 19751983, 1984-1987, 1988-1992. With reference to the Jakarta record, the ENSO blocks ending in 1878, 1891, 1902, 1914, 1951, 1953, 1958, 1963,1983, and 19921993 were apparently trending warmer than average. It is in association with these last-mentioned peaks that pronounced warm-event teleconnections might have occurred along with the geographical patterns noted earlier, and the particular associated impacts on biota such as coral reefs and tropical rain forests. The mean duration between such peak events was 10.6 years (for the instrumental record under consideration), and the longest period without such a peak was 37 years (1914-1951). It may be noted that the longest two strong events are separated by eight years (including an intervening weaker event).
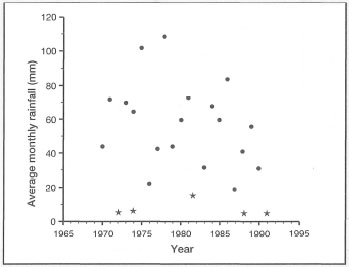
Figure 3.18. Average monthly rainfall (mm) during the dry season (i.e., rainfall < 100 mm.month-1) for the past 25 years. 'Star' symbol indicates ENSO events.
Conclusions
Atmospheric temperature build-up, possibly associated with the greenhouse effect, may be coupled to an increasingly wider temperature swing, in west and central Java, associated with the warm pool influence, but anchored by the ocean-sink. In Southeast Asia, longer dry periods (fig. 3.19) coupled with increased temperatures may thus result from an ENSO-driven mechanism which may force increased equatorial aridity as global carbon dioxide concentrations increase, resulting in a change from "ever-wet" conditions. Forest fires have become a persistent problem in Kalimantan during the ENSO-associated droughts of recent years. The warm-event years seem to provide the driving mechanism. The temperature record shown by the Southeast Asian cities studied to date, indicate a progressive annual warming for the region of around 0.013°C over the last century. This is almost an order of magnitude greater than the global mean cited above.
ENSO-year warm events vary in their effects as estimated by deviation of warmest-month mean air temperature from the secular trend exhibited by the Jakarta/Semarang data set, and perhaps more widely throughout Southeast Asia. The strength of this temperature deviation from the secular trend for ENSO year may provide a quantitative key to understanding the form of the teleconnections passed outwards from the region of Southeast Asia, and the associated "Warm pool" of surface seawater that accumulates against the western margin of the equatorial Pacific.
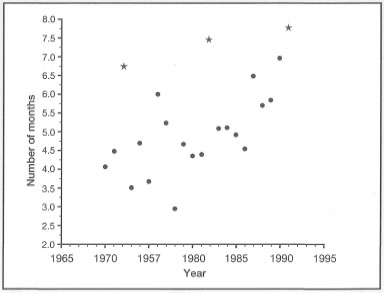
Figure 3.19. The length (months) of the dry season (i.e., rainfall <100 mm.month-1) on Java from 1979 to 1991. Note the progressive increase in the length of the dry season since 1970. 'Star' symbol indicates ENSO events.
The warming-pulse effect of the ENSO warm events recently observed are probably not quantitatively different from the "great dry event" of 1877-1878; however, the overall global temperature is now around 0.5°C higher, and perhaps as much as 1.5°C to 2.0°C in the equatorial regions. The Jakarta air temperature data, near the equator, show a clear change in amplitude and degree over the 127-year record. It is of course relatively easy to dismiss these changes in a superficial way by attributing them to a "city effect". Similar changes overall throughout the Indonesian and Philippine Archipelagos together with those from El Salvador are less easily dismissed. The fact is, however, that ecological conditions and vegetation cover have probably also been changed markedly in the same interval, thus making it difficult to ascribe such observed effects entirely to secular responses of a global nature. It is certain that if the instrumental records of the 1877-1878 ENSO event did not exist, the events observed in 1982-1983 and 1991-1992-1993 would appear to be quite extra-ordinarily severe in relation to all activity from 1879 forward.
Information drawn from meteorological records in Southeast Asia clearly indicates that each ENSO event is unique in terms of the signature, which it imposes on the rainfall and temperature from location to location. Nevertheless, a strong underlying pattern within the context of each event, itself apparently initiated or molded by the character of the preceding years, can be detected. This pattern permits relatively circumscribed predictions of forward conditions (drought intensity) for two to three years, and at least one year beyond, to be made once the event "locks in" for the duration of the warm event. The character of the intervening non-ENSO years can also be projected, but in a more tenuous, though fairly regular, manner.
When the non-ENSO years leading up to a warm event are scored in terms of the extent to which they depart from the secular warming trend for the warmest month, using data from Jakarta and Semarang on the north coast of Java, the cumulative temperature deviations signal the character of the upcoming ENSO event. This signal does not, however, allow an exact determination to be made with respect to whether or not an ENSO event will occur in the next year. For the available historical instrumental data, all markedly upward-moving traces eventually delivered a hot dry season in east Indonesia. This sort of tendency within non-ENSO blocks can thus serve as a caution in the sense that a very hot ENSO event is likely in the offing. The background data can also be used to actually predict the probable intensity of an ENSO event in the upcoming year in terms of its drought potential, should such an event take place in reality. In this respect, there is a high correlation between the cumulative temperature deviation of the inter-ENSO blocks and the temperature deviation of the first ENSO year (where r=0.43; P<0.02; n=27).
In the region of Southeast Asia, represented by Indonesia and the Philippines, relatively secure predictions, concerning likely upcoming droughts, can be made in specific instances once an ENSO event "locks in" for successive years (2-4) until the warm-event set terminates. In the case of Java, and within succeeding inter-ENSO years, further predictions can be made with reference to successive years in terms of the character of preceding years. This system, in conjunction with predictions generated by models, could form the basis of a crop advisory service for prediction of drought or rainfall within dry season from one year to the next. It is anticipated that broad description of temperature and rainfall patterns, associated in space and time with ENSO events, will lead to better food security for the region, as long as sudden changes do not occur.
Chapter Note
1 This link was the focus of the 10-year (1986-95) Tropical Ocean Global Atmosphere (TOGA) research programme of the World Meteorological Organization (WMO) and the Intergovernmental Oceanographic Commission (IOC).
2 Two-thirds of the island of Borneo, or 539,460 km2, are occupied by the four Indonesian provinces of West Kalimantan, Central Kalimantan, South Kalimantan and East Kalimantan.
3 This area includes the island of Madura because of its close geographic proximity.
4 The Indonesian province of Irian Jaya occupies the eastern half, or 421,981 km2, of New Guinea, the world's second-largest island.
5 These summaries follow closely from Ilahude and Gordon (1995), Water Masses of the Indonesian Seas Throughflow.
6 One Sverdrup (Sv) is one million cubic metres per second. The unit is named after the pioneer Norwegian oceanographer H. U. Sverdrup. One Sv is equivalent to 500 rivers of width 100 m and depth 10 m flowing at 2 m/s.
7 Diffusivity coefficients have units of (length )/(time).
8 Because seawater is slightly compressible, a sample brought from depth to the surface will expand and cool. The temperature of a sample that is raised to the surface without thermal contact with the water through which it moves (i.e., adiabatically) will have a temperature which is less than the temperature it had at its original depth. The temperature it would have at the surface if so moved is called the potential temperature, θ. The density of seawater calculated from the potential temperature is called the potential density, ρs,q,0, where 'S' refers to salinity and '0' to standard atmospheric pressure. Since the density of seawater varies from 1000 kg.m-3 (fresh water) to 1028 kg.m-3 for the most dense ocean surface water, the variation in density is entirely in the last four figures. In order to focus on this difference, the quantity δθ (which is also referred to as potential density) is defined as (δθ = ρs,θ,0 -1000). Potential temperature is useful when comparing water masses at significantly different depths.
9 Dates are approximate and will vary from year to year and across the archipelago.
10 Salinity is remarkably uniform throughout the ocean. The mean value for all oceans is about 34.7 psu. A value of 40 psu (Red Sea) would be extreme. From a physical oceanographic perspective, a difference of 0.5 psu represents a wide range of salinity values.
11 Salinity is expressed in psu = per standard unit of the 1978 Practical Salinity Scale.
12 The 'db' is for decibar. One bar is 106 dynes.cm-2. In the open ocean, the pressure at the depth of 1000 m is about 1010 db.
13 The motions of the two primary tide-producing forces, the Moon and Sun, are known precisely. Their resulting tide-producing forces can be expressed as the sum of simple harmonic components (sine waves) of constant and characteristic amplitude, phase and frequency. There are up to 65 components but in most cases the two main semidiurnal (M2 and S2) and the two main diurnal (K1 and O1) components are sufficient to give representative tidal descriptions.
14 The islands of Sumatra, Java, Sulawesi, Bali, Lombok and Sumbawa all have one or more mountains with elevations greater than 2700 m. The highest mountain is Mandala Top with an elevation of almost 4700 m in the Jaya Wijaya Range of Irian Java.
15 Standard atmospheric pressure is 1013.95 mb.
16 In the open oceans, primary production rates typically range from 50 to 100 g C•m-2•yr-1.