

THE STATE OF THE UNION 
If you follow history long enough, eventually you get to right now, the very moment you are reading this sentence.
And there’s some good news to report: lots of things are better than ever. In the twenty-first century Americans are, on average, living longer and enjoying a higher standard of living, with more leisure time and more disposable income than any previous period in history. After a nasty upswing in the 1960s–1970s, all types of crime have decreased steadily since the early 1990s, and the high school dropout rate has gone down across all races and income groups.
Technological advances that began in the United States have transformed the personal and professional lives of billions around the globe, with the rise of the Internet as the single most important communications revolution since the invention of the telephone. Some of America’s oldest and bitterest divisions appear to be fading, albeit slowly and unevenly. Race relations have improved to a degree previous generations would probably have considered impossible, as symbolized by the 2008 election of the first African-American president, Barack Obama (not to mention the first African-American Secretaries of State, Colin Powell and Condoleeza Rice, appointed by Obama’s predecessor George W. Bush).
But it ain’t all roses and perfume. In the first decade of the twenty-first century, the United States and the world received a shocking wake-up call about the threat of global Islamist terrorism with the terrorist attacks on September 11, 2001. Osama bin Laden’s declaration of war on the United States drew America, and the world, into another decades-long struggle that will dominate U.S. foreign policy for the foreseeable future. This won’t always be pretty, as demonstrated by the subsequent U.S. invasion of Iraq. America also gave the world not one but two economic downturns, both resulting from completely idiotic behavior on the part of people who should have known better. The second downturn is turning out to be rather epic–in fact, as of press time, it’s still going on.
 WHAT HAPPENED WHEN
|
February 26, 1993 |
World Trade Center bombed by Islamist terrorists. |
|
January 1, 1994 |
North American Free Trade Agreement (NAFTA) takes effect. |
|
November 1995 |
President Bill Clinton begins a furtive affair with intern Monica Lewinsky. |
|
January 23, 1997 |
Madeleine Albright becomes first female secretary of state. |
|
July 1997 |
Mars Pathfinder lands on Mars on July 4; Camel drops its cartoon mascot, Joe Camel, over allegations it targets children on July 27. |
|
August 1998 |
Al Qaeda bombs U.S. embassies in Dar es Salaam, Tanzania, and Nairobi, Kenya, killing 223; Bill Clinton admits to his relationship with Lewinsky on national TV. |
|
December 1998 |
U.S. bombs Iraqi weapons of mass destruction (WMD), government sites in Operation Desert Fox. |
|
February 2000 |
Dot.com stock bubble bursts, sending stocks into nosedive. |
|
November 2000 |
Ambiguous ballots in Florida lead to a dispute over the results of the 2000 presidential race between Vice President Al Gore and former Texas Governor George W. Bush. |
|
September 11, 2001 |
Terrorists attack World Trade Center and Pentagon. |
|
October 7, 2001 |
The United States invades Afghanistan. |
|
March 20, 2003 |
The United States invades Iraq. |
|
December 13, 2003 |
Saddam Hussein is captured. |
|
February 2004 |
CIA admits prewar WMD assessments were wrong. |
|
August 29, 2005 |
Hurricane Katrina destroys a large part of New Orleans. |
|
October 15, 2005 |
Iraqis vote to approve a new democratic constitution. |
|
October 2006 |
The U.S. population passes 300 million. |
|
January 2007 |
President Bush announces a “troop surge” for Iraq. |
|
September 2008 |
The worst global financial crisis in decades begins. |
|
October 3, 2008 |
The U.S. Congress approves a $700 billion emergency bailout. |
|
November 4, 2008 |
Barack Obama is elected the first African-American U.S. president. |
|
December 2009 |
President Obama announces a 30,000-troop surge for Afghanistan. |
LIES YOUR TEACHER TOLD YOU 
LIE: Bill Clinton cut welfare.
THE TRUTH: Kind of, but not really. During Bill Clinton’s presidency, a bunch of welfare was redistributed from one of the federal welfare programs to various other federal programs. The total amount of welfare spending never decreased–in fact, it kept going up.
Ever since Lyndon Johnson launched the Great Society in the 1960s, politicians have gotten votes by playing on middle class resentment of welfare, which is condemned as “free handouts” to the poor. Politicians and media portray welfare recipients as unwilling to work, and they warn that welfare programs encourage dependence on the government (which may be true). They also appeal to white racial prejudice by implying that most recipients are African-American (which isn’t true).
If anyone ever wanted votes, it was Bill Clinton, the Democratic governor from Arkansas who won a long-shot bid to unseat President George H.W. Bush in 1992, in the middle of a deep recession.
Sensing antagonism toward welfare recipients, Clinton made welfare reform a Democratic issue, promising to “end welfare as we know it"–a complete reversal of his party’s previous stance. But did Clinton really end welfare as we know it? Maybe at first glance: in 1996 he signed the Personal Responsibility and Work Opportunity Reconciliation Act, better known as the Welfare Reform Bill, which phased out a federal welfare program, Aid to Families with Dependent Children (AFDC) and replaced it with a new, more limited program, Temporary Assistance to Needy Families (TANF). TANF capped the amount of time a family could spend on welfare to three years and the amount of money that the federal government distributed to states for this assistance. It also cracked down on deadbeat dads who fell behind on child support payments. However, the most important reform as far as public opinion was concerned was that welfare recipients were required to work (which could include job training).
Setting aside the fact that the bill was authored by Republicans, and the fact that Clinton had vetoed a practically identical bill under pressure from liberal groups not long before, and the fact that he just happened to reverse himself a few months before the 1996 presidential election–the fact remains that the welfare reform bill didn’t achieve any long-term cost savings or reduce the number of people on federal welfare. It just shuffled the people and numbers around.
True, the number of individuals receiving family assistance from the federal government through AFDC or TANF decreased dramatically from a high of 14.4 million in 1994 to just 4.1 million in 2006. There was nothing magical about this: the number dropped primarily thanks to economic growth, which picked up halfway through Clinton’s first term. This fortunate coincidence allowed Clinton and the Republican Congress to take credit for moving millions of people “off welfare” (succeeding before the bill was even passed, which is especially impressive).
So did “cutting welfare” actually save any money? In a word, no. Crunching the numbers, there were 38.1 million people receiving food stamps or family assistance in 1996; in 2009 the number is back up to 40.4 million. Total federal food aid more than doubled from $28 billion in 2000 to $57.5 billion in 2008, while federal housing assistance increased from $28.8 billion to $41 billion over the same period.
LIE: America is divided into red and blue states.
THE TRUTH: We look purple from space. Americans get good and worked up over politics, an admirable quality taken advantage of by two groups: politicians and the media. Both do a great job of stirring up rivalry by vilifying the opposition, composed of “those other people” who live “over there.” “Red state” TV viewers can fulminate about the godless perverts sipping lattes and marrying their dogs “on the coasts,” while their “blue state” counterparts can heap scorn on all the stupid hicks who think dinosaurs are a U.N. hoax in “flyover country.”
![]() The late Tim Russert of NBC News is credited with popularizing the terms “red and blue states” during the 2000 presidential election.
The late Tim Russert of NBC News is credited with popularizing the terms “red and blue states” during the 2000 presidential election.
But the red-blue distinction is hardly black and white. While someone has to win the election in each state, we tend to forget how close those margins can be. During the presidential election in November 2000, Florida’s vote in the electoral college–for the win!–was decided by 537 ballots in the popular vote, or less than 0.01 percent of the total six million ballots cast in the state. Even the most extreme cases display a great deal of diversity. In 2004 the population of Utah–the “reddest” state that year–still voted 26.4 percent for John Kerry, meaning one out of every four people was secretly “blue.” Fast forward to the 2008 election, and the most pro-Obama state, Hawaii, still voted 26.6 percent for McCain.
And let’s not forget that red and blue aren’t the only two crayons in the box. Check out the 1992 election, when a third-party candidate, Ross Perot, took an astounding 19 percent of the popular vote, stealing an equal balance of voters from both parties. Basically, one out of five Americans was so fed up with both “red” and “blue” politicians that they voted for a rich, ornery gnome from Texas who promised to balance the federal budget and expand the war on drugs (usually Republican talking points) but also supported protectionist trade measures, gun control, environmentalism, and abortion rights (Democratic touchstones).
In other words, America is a lot more complicated than the red vs. blue setup. A look at county-level results more accurately reflects the political landscape: it turns out blue states like New York and California are mostly red outside their metropolitan areas, while seemingly solid red states in the Midwest and South have unexpected pockets of blue along major river valleys. But county-level results can also be misleading, as even small towns are often evenly divided. In 2008 the Missouri popular vote went for McCain by 49.4 percent to 49.3 percent–but would have gone the other way if just 2,000 people had voted differently in counties like Adair (which split 49.6 percent–48.3 percent for McCain) or Clay (49.7 percent to 49 percent). Meanwhile, in solidly blue New York City, a map of political donations in the 2004 presidential election showed the Upper East Side favoring Republicans and the equally rich Upper West Side supporting Democrats. In other words, we aren’t divided into red and blue states or even counties, but neighborhoods and streets.
Of course ideological divisions really do exist on issues like abortion, taxation, redistribution of wealth, and foreign wars. Such disagreements are a natural part of any functioning democracy–in fact, they’re the whole reason for democratic government.
But at some point the national dialogue started breaking down, as media sources have become more and more partisan. In the 1980s–1990s, many Americans believed national newspapers and TV news were pushing liberal opinions on the rest of the country, and their alienation was reflected in the growing popularity of conservative commentators like Rush Limbaugh, who by 1990 had the largest audience of any radio talk show host in the United States. It also contributed to the success of Fox News, a 24-hour news channel with a right-wing slant founded by Rupert Murdoch’s News Corp. in 1996. Fox News has in turn provoked more politically biased coverage from left-leaning new outlets.
The media bias certainly shows. For example, it’s probably not a coincidence that Fox News called the 2000 election for George W. Bush before any other news organization–or that the call was made by Bush’s cousin John Ellis, a former Boston Globe reporter who was working as a freelance political analyst for Fox News during the election. On the other side, CBS News anchorman Dan Rather was clearly eager to discredit Bush in the final months before the 2004 election with a report that Bush was AWOL from the Texas Air National Guard in the 1970s, based on documents that turned out to be forgeries–a discovery first publicized by a conservative blog, Powerline. (Indeed, Rather had pursued something of a vendetta against the Bush dynasty: in January 1988 he ambushed Bush Sr., the presumptive GOP presidential candidate, with questions about his involvement in Iran-Contra after promising not to bring up the subject.)
YOUR TIRED, YOUR POOR, YOUR UNDOCUMENTED MASSES
Always a popular immigration destination, the United States’ biggest immigrant group of recent years, hands down, consists of Spanish-speaking people from Latin America, particularly Mexico, which shares a long, not-so-policed border with the United States.
Of the 35 million immigrants living in the United States in 2008, the total number of foreign-born Spanish speakers constituted just over half–nearly 18 million. With the United States exerting this kind of attraction, it’s not surprising that Hispanics also constitute the largest population of illegal immigrants: 55 percent of the Mexican immigrants, or about seven million people, are living in the United States illegally, along with similar percentages from other Spanish-speaking countries.
Still, foreign-born Hispanics only represent about 40 percent of the American Hispanic population. Adding up native-born citizens, naturalized citizens, legal immigrants, and illegal immigrants, the total number of U.S. Hispanics topped 45 million in 2008, or about 15 percent of the U.S. population, making it the largest Hispanic population in the world outside Mexico. Overall, the Hispanic population is following the pattern of economic assimilation established by earlier immigrants, with the median income of Hispanic households nearing $39,000 in 2008, up 15 percent from $34,000 in 1992 (in 2008 dollars). Where 51 percent of the adult Hispanic population had a high school diploma in 1990, the number rose to 59 percent by 2005, while the number holding college degrees increased from 5.5 percent to 8.5 percent. Still, parts of the Hispanic community continue to face some serious challenges: in 2008 the high school dropout rate for Latinos was 17 percent, compared to 9 percent for African-Americans, 6 percent for whites, and 4 percent for Asians. This in turn affects progress in areas like learning English, which correlates directly with employment opportunities and income levels. About 16 million Hispanics, or 35 percent of the total population, have limited or no English.
Like other immigrant groups, the influx of Hispanics has triggered a xenophobic backlash, based partly on cultural difference and partly on fear of economic competition. Both political parties have pandered to anti-immigrant sentiment, with Republicans taking the lead in fighting immigration reform in 2005. But the rapid growth of the Hispanic electorate makes this a risky proposition, especially as the fastest-growing populations are in important states like Florida, Texas, and California.
LIE: BANKERS ARE GOOD WITH MONEY.
THE TRUTH: Bankers like money, but that doesn’t mean they’re any good with it. If anyone needed convincing of that fact, the ongoing financial catastrophe that began in 2007 should remove any lingering doubts. Of course, bankers weren’t the only culprits: like most good financial disasters, this one began with well-intentioned government policies that totally backfired.
Tinkering with interest rates has always been an accepted way of softening “down phases” during economic cycles. So when the recession hit in 1991–1992, the Federal Reserve lowered interest rates to get banks lending more money. The low rates and general prosperity of the mid–1990s, particularly in the housing sector, encouraged the growth of mortgage companies specializing in “subprime” and adjustable-rate mortgages–new kinds of loans for would-be homebuyers with bad credit histories. These mortgages were equipped with special features intended to help people with almost no money acquire property. During the boom years, millions of people plowed money into real estate, seduced by the prospect of getting rich quick. Everyone assumed property would continue increasing in value, paying for itself.
This wave of speculation drove real estate prices higher, attracting more speculators to the market, which raised prices even more–a classic bubble. Easy credit made it all possible, with new subprime and ARM loans jumping from $25 billion in 1993 to $140 billion in 2000. The real estate bubble began growing even faster following the Federal Reserve’s decision to lower interest rates again during the recession of 2001–2002. From 2000 to 2006, the total appraised value of residential real estate rose from $21 trillion to $30.5 trillion. As in any bubble, the apparent expansion in value was fueled by frantic deal-making, giving ordinary investors the impression of a solid trend–and the feeling that they might be missing out on a good thing. Mortgage debt more than doubled, while real estate agents cleaned up, with annual commissions jumping from $36 billion to $55 billion over the same period.
Were there warning signs? Of course. Alarmed financial analysts pointed to history, which showed that between 1890 and 1990, real estate prices had only increased 10.2 percent in inflation-adjusted terms. From 1990 to 2006, they soared an astounding 85 percent. Meanwhile, beginning around 1995 real estate prices started to eclipse their rental earning potential at an alarming rate. In other words, the value of residential real estate was no longer linked to its utility; instead, prices kept going up because, well, prices kept going up.
What’s that old expression about everything that goes up? From 2006 to 2009, the total appraised value of U.S. residential real estate fell from $30.5 trillion to $24.7 trillion, and if it continues falling in 2010, it could wind up right back where it started in 2000. This would have been bad if it had only affected the millions of Americans who took an ice-cold bath on real estate. But it was worse. It turned out banks had built an entire financial universe on the unworthy foundation of subprime mortgages. Although the deals were incredibly complicated, the basic story is pretty straightforward, involving–once again–some ill-advised moves by the U.S. government.
![]() In 2010, there were 19 million vacant homes in the United States–enough to house the population of France at 3.4 people per home.
In 2010, there were 19 million vacant homes in the United States–enough to house the population of France at 3.4 people per home.
The first ill-advised move came after a 1992 study by the Boston Federal Reserve Bank revealed continuing discrimination against low-income homebuyers, including minorities. In 1994 President Clinton pushed the Department of Housing and Urban Development to draw up new guidelines for banks issuing mortgages in its National Homeownership Strategy, loosening lending standards and establishing quotas determining the number of low-income mortgages banks had to offer. To encourage banks to lend more to homebuyers, the government offered positive incentives for more subprime mortgages, urging the Federal National Mortgage Association, nicknamed “Fannie Mae,” and the Federal Home Mortgage Corporation, “Freddie Mac,” to buy more and more subprime securities packages (investment products resembling mutual funds) from banks.
In 2000 Fannie and Freddie increased their quota of low-income mortgage-backed securities from 42 percent to 50 percent of all purchases–then again to 52 percent in 2005 and 55 percent in 2007. Meanwhile, investment bankers complained that they were missing out on all the fun. So in October 2004 the Securities and Exchange Commission agreed to waive regulations on five of the biggest–Goldman Sachs, Merrill Lynch, Lehman Brothers, Bear Stearns, and Morgan Stanley–allowing them to invest more in these risky mortgage-backed securities.
All this gave a huge boost to the risky securities market, which in turn gave private lenders a big incentive to offer more risky loans. Following the lead of Countrywide Financial, a big subprime lender, in 2004 many subprime mortgage corporations began using automated loan approval systems, meaning loan applicants were (barely) screened by computers, with scant human supervision. By 2007 a total of $1.5 trillion in subprime mortgages were held by 7.5 million homebuyers–13.4 percent of all outstanding home loans.
At the same time, the volume of risky mortgage-backed securities issued annually rose from $87 billion in 2001 to $450 billion in 2006, with private investors taking a bigger and bigger slice. Thus when the real estate market began declining in the second half of 2006, a lot more was riding on it than most people understood–but everyone was about to get a quick tutorial. Large numbers of subprime mortgages began going into default, and by August 2008, 9 percent of all U.S. mortgages were in default. The first wave of failures hit subprime mortgage corporations, with more than 20 of these specialized lenders collapsing in 2006–2007. Now all of those securities based on subprime mortgages were basically worthless too, and from 2007 to 2008, it became increasingly obvious that trillions of dollars that banks believed to exist, in fact, didn’t.
Fall 2007 brought revelations of giant losses on subprime holdings across the industry. The losses were so huge that everyone started clamping down on loans to other financial institutions (a little late, guys!), making the situation even worse. As credit markets froze, banks started selling shares to anyone with money in a desperate effort to raise cash. This included “sovereign investments” from the governments of Singapore, Saudi Arabia, Kuwait, and South Korea.
And it was about to get even worse. For 2007–2008, there were hundreds of billions of dollars in write-downs from the main players, with Merrill Lynch taking the biggest hit at a total of $60 billion, followed by Citigroup with $46 billion. Frantically trying to stave off total financial collapse, the Federal Reserve and U.S. Treasury rushed from emergency to emergency, forcing banks into hastily conceived and comically mismatched marriages. With their perfunctory blessing, from January to October 2008, Bank of America bought Countrywide Financial Corp. and Merrill Lynch, JP Morgan Chase got Bear Stearns and WaMu, and Wells Fargo acquired Wachovia. Unfortunately, not everyone made the cut: U.S. officials peddled Lehman to any and every possible suitor, to no avail. With $50 billion of subprime securities, Lehman was stuck, and in September 2008, it flat out folded triggering the feared financial crisis.
From January to December 2008, total subprime losses in the financial sector almost quadrupled, from $218 billion to $800 billion, rippling outward from the original subprime culprits. Adding up the failures and government-brokered fire sales, bank shareholders lost $7 trillion. Meanwhile, global stock markets lost an incomprehensible $30 trillion in value–yes, that’s $30,000,000,000,000. For comparison, that’s the net worth of Green Bay, Wisconsin, if every resident was Madonna; alternatively, it’s like winning the Powerball lotto jackpot 300,000 times in a row.
The staggering losses made a government bailout funded by the public (hello, you!) unavoidable. In July of 2008, President Bush signed a bill providing $300 billion in new loans to keep the mortgage market from freezing up completely. As panic set in following the Lehman Brothers failure in September, the U.S. government took control of Fannie Mae and Freddie Mac (setting aside $200 billion to cover their subprime securities losses), poured another $295 billion into domestic financial markets, loaned $330 billion to foreign central banks to stabilize overseas financial markets, and ponied up $125 billion to bail out American International Group (AIG), an insurance giant that lost tens of billions. In October, President Bush signed a bailout bill allocating $700 billion to buy risky mortgage-backed securities from banks, while the Fed provided another $150 billion in short-term loans to U.S. banks and $540 billion in loans to keep money markets functioning. The government also bailed out major U.S. automakers, ultimately investing $130 billion in Chrysler and GM.
American taxpayers were none too happy about bailing out irresponsible bankers, or taking ownership of AIG and GM (which turned over majority control to the U.S. government in exchange for bailout funds). As of 2010, the general American view of bankers might be characterized as a mix of resentment, jealousy, and distrust. How could bankers screw the pooch on such an epic–nay, cosmic–scale?
![]() The $5.8 trillion decline in the value of residential real estate was more than twice China’s 2006 GDP of $2.7 trillion.
The $5.8 trillion decline in the value of residential real estate was more than twice China’s 2006 GDP of $2.7 trillion.
Although it would be impossible to recount them all, the financial meltdown was made possible by mistakes and deceit at various levels. At the bottom, unqualified or under-qualified homebuyers were approved for sketchy loans through unethical (or plain illegal) practices by subprime mortgage corporations. Then brokers deliberately mixed bad loans with good loans in securities, making the securities appear less risky than they actually were. Some subprime mortgage corporations simply altered information on bad mortgages before selling them to banks. And it was easy to trick banks because credit-rating agencies gave high ratings to risky securities based on the (inaccurate) information provided by the subprime mortgage corporations.
Basically, no one did any research checking where all this (imaginary) money was coming from, even though a perfunctory examination of lending practices would reveal that an alarming number of subprime loans were bound to default. Why didn’t bankers or regulators check? They were lazy, and it was easier to believe everyone could get rich by helping poor people buy houses.
If you’re looking for political culprits in the financial disaster of 2007–20??, you won’t be able to pin it on one political party. The Democrats helped lay the groundwork with President Clinton’s 1995 decision to allow Fannie Mae and Freddie Mac to count subprime securities purchases as aid to low-income homebuyers, followed by congressional Democrats pushing the mortgage agencies to increase their subprime purchase targets in 2000 and 2005. For their part, in 2004 the Republicans poured gasoline on the fire by pressuring the SEC to let investment banks purchase more subprime-backed securities. Unlike nearly everything else to come out of Washington in the early 2000s, the financial crisis was a true bipartisan creation.
 OTHER PEOPLE’S STUFF
Two Towers and the Morning of 9/11
On the clear, sunny morning of September 11, 2001, fifteen Saudis, two citizens of the United Arab Emirates, one Lebanese, and one Egyptian armed with box cutters commandeered four airliners, and then crashed two into the twin towers of New York’s World Trade Center and one into the Pentagon in Washington, D.C. The fourth airliner–possibly intended for the U.S. Capitol or the White House–crashed in rural Pennsylvania after passengers tried to overpower the hijackers. Besides the 19 hijackers, the attacks claimed the lives of 2,740 Americans and 236 foreigners, including 2,605 at the World Trade Center, 70 civilians and 55 military personnel at the Pentagon, and 246 passengers and crew aboard the planes; among the Trade Center dead were 411 emergency workers, including 341 firefighters.
Americans responded to the murderous attacks with shock and fury, as sympathizers abroad held candlelight vigils to express solidarity. By the end of the day, the U.S. government had identified the culprit as Al Qaeda, a terrorist organization formed by Osama bin Laden after his involvement in the Maktab al-Khidamat (MAK), founded to help Afghan mujahedin fight Soviet invaders. In fact, Al Qaeda had demanded that the United States withdraw all of its troops from Saudi Arabia, because the Americans defiled Mecca by their very presence. The terrorist group also wanted America to cease interference in any internal affairs of Muslim countries. The attack on America was Al Qaeda making its threat heard.
While the civilian death toll was lower than initially feared (up to 50,000 people worked in the World Trade Center on a typical day), it was still shocking–and completely outside any accepted rules of warfare. A decisive military response was inevitable. While President George W. Bush vowed to wage a wide-ranging war on terror, the first logical target was Afghanistan, where the ultra-Islamist Taliban regime had harbored bin Laden since 1997. On the evening of September 11, the leader of the Taliban, Mullah Omar, begged the United States not to attack Afghanistan, but he subsequently refused to give up bin Laden, citing Islamic rules of hospitality. On September 12, NATO invoked Article 5 of the Alliance treaty calling for collective defense, making European and Canadian forces available for the U.S.-led response. Within 24 hours of September 11, three aircraft carrier battle groups set sail for the Arabian Sea, and U.S. planes and ground forces began gathering in friendly countries around the Persian Gulf. Under U.S. pressure, Saudi Arabia and Pakistan renounced the Taliban, whom they’d previously supported, and Pakistan opened its airspace to U.S. warplanes. Even Iran, still a bitter U.S. enemy, agreed to rescue any American airmen forced down in its territory.
The attack on the Taliban regime commenced October 7, 2001, with bombardments focused on breaking the stalemate in northern Afghanistan, where Taliban and Northern Alliance troops faced each other from networks of defensive trenches. The results were dramatic and, by all accounts, terrifying: low-flying B-52s carpet bombed the Taliban trenches, annihilating entire divisions in a single pass, while C-130 transport planes dropped 15,000-pound BLU-82 “Daisy Cutters"–the largest nonnuclear explosive in the U.S. arsenal, obliterating an area measuring 260 feet in diameter. The Taliban broke and ran, loading everyone in pickup trucks and beating a retreat for the capital, Kabul. But this was a mistake: trained to destroy tank armies, U.S. air power specialized in picking off vehicles moving across open terrain. Kabul fell to the Northern Alliance on the night of November 12–13, 2001, bringing overjoyed residents into the streets, with men publicly shaving their beards and young people dancing to music from radios (all forbidden by the hirsute, fun-averse Taliban). In December the remaining Taliban abandoned their southern stronghold, Kandahar, and returned to the remote, ungoverned mountain ranges of southeastern Afghanistan from which they’d emerged a decade earlier.
FILE UNDER “COUNTERPRODUCTIVE”
Sadly, terrorism is almost certain to continue, despite the fact that it has never, ever worked. The record of nineteenth-century anarchist terror was one of complete, unmitigated failure. In the twentieth century, Gerry Adams, the leader of Sinn Fein (the political arm of the Northern Irish independence movement) admitted that IRA bomb attacks against civilians were a “mistake;” the Basque separatist movement in Spain, ETA, is almost terminado; and the PLO, Hamas, and Hezbollah have gained nothing from decades of violence against Israel. In fact, terrorism historically has been inherently self-defeating: random acts of violence against civilians only succeed in making the survivors angry.
But this spectacular success didn’t translate into lasting victory. Osama bin Laden managed to elude the U.S. dragnet, while his Taliban allies regrouped in southeastern Afghanistan and Pakistan, protected by rugged terrain and their Pashtun ethnic kinsmen. In December of 2009, President Obama increased the U.S. troop commitment by 30,000, but if history is any guide, force alone won’t be sufficient to “fix” Afghanistan, let alone “win” the War on Terror.
The Case of the Missing WMDs
The invasion of Iraq in 2003 is America’s most controversial foreign war since Vietnam. While it’s too soon to make any big historical judgments, there are a couple of aspects of the story that aren’t quite as straightforward as they seem.
Iraq’s dictator, Saddam Hussein, was universally condemned for using chemical weapons in both the Iran–Iraq War and against his own people during the Anfal Kurdish genocide. He was universally re-condemned for invading Kuwait in August 1990, and after his defeat in the First Gulf War, Hussein remained a bitter foe of the United States and its allies. He was also viewed as a threat to regional stability because of his support of Palestinian terrorist groups opposing Israel and his dogged pursuit of weapons of mass destruction.
Official American policy toward Iraq emphasized the need to halt Hussein’s nuclear, chemical, and biological weapons programs. After the First Gulf War, the U.S. Navy enforced U.N. sanctions intended to deprive Iraq of materials needed for weapons of mass destruction (WMD). And in December of 1998, President Clinton ordered Operation Desert Fox, a bombing mission targeting Iraq’s WMD sites, government, and infrastructure after Hussein refused to allow U.N. weapons inspectors access to some suspected sites. It wasn’t until Clinton’s signing of the Iraq Liberation Act in October 1998, however, that the United States also officially sought Hussein’s overthrow. The Iraq Liberation Act was mostly symbolic. But the terrorist attacks on 9/11 completely transformed the American political landscape, allowing Bush to pursue regime change much more aggressively than Clinton had been able to.
This is where the controversy comes in, with opponents of the war leveling a number of criticisms regarding the Bush administration’s handling of the WMD issue, its true intentions in going to war, and its conduct of the invasion and occupation.
In keeping with previous U.S. policy, the Bush administration presented Iraqi WMD as the main justification for war. But when Hussein allowed U.N. weapons inspectors to return to Iraq in November 2002, they didn’t find any evidence of WMD stockpiles or production. Yet the White House chose to ignore these findings in favor of much more alarming assessments from “working groups” in the Pentagon and CIA who were ordered to err on the side of suspicion. Critics point to this pattern as proof that administration officials only wanted to hear analyses that confirmed their suspicions; some even accuse the administration of deliberately lying about Iraqi WMD to swing public opinion behind the war.
![]() Yet another new term emerged from the Iraq war in 2003– “embedded reporters, “journalists who are attached to military units engaged in armed conflicts.
Yet another new term emerged from the Iraq war in 2003– “embedded reporters, “journalists who are attached to military units engaged in armed conflicts.
There’s no question the administration painted an alarming picture of Iraq’s WMD progress to make the case for war, including many claims that turned out to be untrue. But that doesn’t necessarily mean administration officials knowingly deceived the public. The U.N. and CIA had both been hoodwinked about WMD in the past. Hussein was a champion liar, and Iraq is a big country–170,000 square miles, the size of California–with lots of hiding places. It remains something of a mystery why Hussein didn’t allow inspectors in earlier if he really had nothing to hide; one theory is he wanted everyone to think he had the weapons to deter other countries from invading Iraq (ah, the irony).
At the time I was preparing that presentation it was presented to me as being solid.
–U.S. Secretary of State Colin Powell, on his inaccurate February 2003 address to the U.N. about Iraqi WMD
But none of this proves that they didn’t knowingly deceive the public. The basic WMD premise didn’t make much sense at all. It was extremely unlikely that Hussein would have used the WMD himself against civilian targets in the United States, since that would have basically ensured his own destruction. And the suggestion that Hussein might hand off WMD to Al Qaeda is even more ridiculous, considering that Osama bin Laden had on several occasions called for the overthrow of Hussein, whom he condemned as a secular tyrant, “a bad Muslim” and “an infidel.”
And then there’s that 18.5-billion-ton gorilla in the room: Iraq’s massive oil reserves. According to the conspiracy theory, Bush and company used Hussein’s alleged WMD as an excuse to grab Iraq’s oil. Critics point to a number of nefarious connections between the administration and oil interests, including Vice President Dick Cheney’s connection with Halliburton, an energy services firm that performed emergency repairs on Iraqi oil infrastructure after the invasion. It’s true Cheney was in a position to direct business to Halliburton (where he served as CEO from 1995 to 2000), but it would be hard to prove charges of favoritism, as Halliburton is the largest energy services company in the world and had already won several contracts from the U.S. Army Corps of Engineers during the Clinton administration.
But the fact remains that successive U.S. administrations have sought to control global energy supplies since before the Second World War–especially oil. So the idea that the invasion had nothing to do with Iraq’s oil is obviously pretty implausible. The focus on oil was evident in the planning and execution of the war, when special forces parachuted in to protect Iraq’s oil fields, while armories, power plants, and other government buildings were left open to looters and saboteurs. After the war, U.S. advisors helped draw up new contracts dividing up oil development between five Western energy companies, including America’s largest oil companies, Exxon-Mobil and Chevron. Mission accomplished?
Not exactly. Clearly, the invasion of Iraq didn’t turn out quite as hoped. So what happened?
The mistakes began with the size of the invasion force. As the Bush administration worked to rally support for the invasion of Iraq, it needed to persuade the American public that the war wouldn’t be enormously expensive. By using a smaller invasion force, the administration intended to burn through less money. Initially, Secretary of Defense Donald Rumsfeld proposed an invasion force of just 75,000 U.S. troops, but General Tommy Franks eventually persuaded him to allocate 125,000 U.S. troops to the invasion of Iraq (together with 45,000 British troops). Even then, Rumsfeld’s aide Paul Wolfowitz estimated the total cost of the invasion and reconstruction at less than $95 billion (by the end of 2009, actual expenditures topped $700 billion).
![]() Donald Rumsfeld was both the youn gest and oldest person to serve as Secretary of Defense in U.S. history, at age 43 in 1975 and age 74 in 2006.
Donald Rumsfeld was both the youn gest and oldest person to serve as Secretary of Defense in U.S. history, at age 43 in 1975 and age 74 in 2006.
In March of 2003 the Iraqi military collapsed before the initial U.S. combined air and ground onslaught–but there were early signs of trouble. As the Marines pressed forward toward Baghdad, rear areas came under attack by Iraqi guerrilla fighters. In the end, the Marines were able to crush most of this early guerrilla activity–but the mere fact of continuing resistance was a bad sign, foreshadowing a long postwar insurgency that the Pentagon failed to anticipate.
As we know, there are known knowns. These are things we know that we know. We also know there are known unknowns. That is to say, we know there are some things we do not know. But there are also unknown unknowns, the ones we don’t know we don’t know.
–Donald Rumsfeld, February 12, 2002
These problems were multiplied by some profoundly ill-advised U.S. policies. The first wrong move was the disbanding of the Iraqi army in May 2003 by L. Paul Bremer, the civilian governor of Iraq appointed by the Bush administration. Bush later tried to push blame for this disastrous decision on to Bremer, who fired back that he was following the wishes of the president. It’s amazing that we still don’t really know who decided to disband Iraq’s army, but we do know that it was a really bad idea. The U.S. occupiers basically told a quarter-million angry young men: “Sorry, you’re out of work–but you can keep your gun!”
The same goes for the Bush administration’s decision to purge all former members of Hussein’s Ba’ath Party from positions of responsibility–effectively firing most of Iraq’s clerks, police officers, engineers, bank managers, factory bosses, teachers, doctors … basically anyone with any sort of experience and authority. Firing them was a double whammy, since it provided even more unemployed, embittered potential recruits for the insurgency.
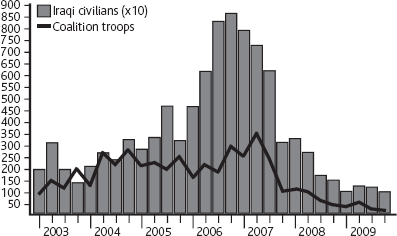
While it’s still way too soon to say, despite all the mistakes, it appears that the American invasion and occupation of Iraq may actually succeed, thanks to a combination of delayed common sense and good luck. On the American side, common sense prevailed when the Pentagon adopted a “surge” strategy committing 20,000 more troops to help stabilize the war-torn country in 2007–2008. Common sense scored another victory with the decision by most Shiite groups to embrace the democratic process, as free, fair elections were virtually guaranteed to give the country’s oppressed majority the upper hand. Last but not least, the political landscape was transformed by the emergence of the Sunni Sahwa or “Awakening” movement, led by tribal sheiks who succeeded in rooting out at least some of the foreign terrorists inspired by Al Qaeda.
Iraq: Fatalities per Quarter
PROFILES IN URGES 
Politicians have always engaged in extracurricular hanky-panky, but before the late twentieth century, the press usually chose to politely ignore their various dalliances, peccadilloes, rendezvous, and seraglios. Why, it seems almost quaint now, doesn’t it? Here’s a quick review of just a handful of the bigger political sex scandals.
GARY HART (b. November 28, 1936). The handsome senator from Colorado was considered a front-runner for the Democratic presidential nomination in 1988 until revelations in The New York Times and The Miami Herald that he was having an extramarital affair with a 29-year-old model named Donna Rice. Not long after, the National Enquirer published a photo of Rice seated on Hart’s knee aboard a yacht (the aptly named Monkey Business). The scandal was devastating to Hart’s political prospects: literally overnight, his support in the New Hampshire Democratic primary dropped from 32 percent to 17 percent, leaving Massachusetts Governor Michael Dukakis the front-runner. On May 8, 1987, Hart dropped out of the race; interestingly, a Gallup poll found 64 percent of Americans thought Hart’s treatment by the media was unfair.
CLARENCE THOMAS (b. June 23, 1948). After Thurgood Marshall retired in 1991, President George H.W. Bush stirred controversy by nominating Clarence Thomas, a conservative African-American judge from the U.S. District Court of Appeals in Washington, D.C., to the Supreme Court. Liberals criticized Thomas for opposing abortion rights and affirmative action, while legal scholars questioned his qualifications (he was 43, compared to an average age of 54 for new justices). Then a female professor from the University of Oklahoma, Anita Hill, told the FBI that Thomas sexually harassed her when she was his assistant in 1982–1983. Among other things, Hill said Thomas recounted pornographic movies depicting orgies, rape, and bestiality; discussed the endowment of a pornographic film star, “Long Dong Silver"; and joked about what appeared to be a pubic hair on a soda can. Dividing along partisan lines, the Democrats looked for more dirt on Thomas, while the Republicans did their best to discredit Hill with rumors and innuendo. Thomas angrily accused Hill (who is also African-American) of participating in a “high-tech lynching” orchestrated by the white news media. He was finally confirmed by a party-line vote of 52–48.
BOB PACKWOOD (b. September 11, 1932). Before his downfall, the Republican senator from Oregon was considered “one of the nation’s most powerful elected officials,” because of his senior position on several key Senate committees. Respected by liberals for his views on the environment and women’s rights–especially on abortion–Packwood wasn’t quite so enlightened in his private life. In November 1992 The Washington Post published shocking allegations of sexual misconduct from ten women, including lobbyists and former female staffers. The Senate Ethics Committee demanded Packwood turn over his diary, which was said to include incriminating details of his sex life, but Packwood stonewalled, vaguely threatening to expose misconduct by other members of Congress. The Senate Ethics Committee finally recommended Packwood be expelled from the Senate–an extraordinary measure last used during the Civil War–prompting him to resign on September 7, 1995.
BILL CLINTON (b. August 19, 1946). Clinton was dogged by allegations of sexual harassment and extramarital affairs before he was even elected, beginning with Gennifer Flowers, who claimed she had an affair with Clinton when he was governor of Arkansas. After he won election, in May 1994 Clinton was accused of sexual harassment by a former Arkansas state employee, Paula Jones, who said she’d been lewdly propositioned by then-governor Clinton three years before. In 1997 a judge ruled that Jones’s lawyers could subpoena other women to testify about their relationships with Clinton, including Monica Lewinsky, a 22-year-old former White House intern. Clinton and Lewinsky both denied any sexual relationship, and Clinton eventually settled with Jones out of court with a payment of $850,000.
But it turned out one of Lewinsky’s coworkers, Linda Tripp, had secretly taped phone conversations in which she discussed her affair with Clinton. In January 1998 Tripp turned the tapes over to a special prosecutor, Kenneth Starr, appointed by the Republican-dominated Congress to investigate Clinton’s other alleged misdoings. After the Drudge Report Web site broke the news on January 17, Clinton gave a press conference where he famously insisted, “I did not have sexual relations with that woman, Ms. Lewinsky.”
In July Starr agreed to give Lewinsky immunity for her perjury in the Jones case in return for testifying about her affair with Clinton and the subsequent cover-up. This included turning over a blue dress with a semen stain, which DNA testing showed to be Clinton’s. In August 1998 Clinton admitted the relationship with Lewinsky in grand jury testimony, opening himself to charges of perjury and obstruction of justice–both impeachable offenses. Congress voted to impeach him on December 19, 1998, but he was acquitted by the Senate on February 12, 1999.
SPECIAL REPORT 
We’ve Got New Issues The Gay Marriage Debate
Homosexual activity used to be illegal in most states, under statues prohibiting “sodomy,” which includes any sexual contact between two people of the same gender. However, most of those laws were repealed voluntarily by the states in the second half of the twentieth century, and in 2003 the Supreme Court overturned all remaining sodomy laws in Lawrence v. Texas. The next logical step, to many gay rights activists, was gaining the right to marry. While most state laws have defined or presumed marriage to be the union of a man and a woman, gay marriage advocates point out there’s no particular reason it shouldn’t be modified to allow any two consenting adults to marry.
No surprise, there is more than a little disagreement on this point. Many opponents object on religious grounds, while gay marriage advocates point out that religious laws as set forth in holy books are not identical with the laws of the United States (the whole separation of church and state thing). Similarly, some opponents warn that same-sex marriages will “undermine the sanctity of marriage” although some of the sanctity-free marriages coming out of Hollywood seem a rebuttal in their own right. Others equate marriage with “natural law,” arguing that it brings a man and woman together for the purpose of biological reproduction … which would also seem to exclude straight couples who are infertile or don’t want children. Then there’s the “slippery slope” argument, i.e., “if two men can get married today, somewhere down the line a man will be able to marry his dog/Gila monster/emu.” (Of course, the obvious difference here is that–unlike two consenting human adults–the animal of choice is not able to give verbal consent, let alone demand a pre-nup.)
![]() In 2004, 30% of U.S. high school students said they had a close friend who was gay.
In 2004, 30% of U.S. high school students said they had a close friend who was gay.
At this point, each side is digging in its heels, and the argument goes on. As of 2010 gay marriage was legal in five states–Connecticut, Iowa, Massachusetts, New Hampshire, and Vermont–as well as Washington, D.C. Meanwhile, New York, Rhode Island, and Maryland recognize same-sex marriages performed in other states, but don’t grant them in state. On the other hand, the 1996 Defense of Marriage Act signed by Bill Clinton prevents the federal government from recognizing same-sex marriages, and 30 states have passed amendments to their state constitutions banning same-sex marriage, including California, which passed Proposition 8 in 2008. (Many of these laws resemble anti-miscegenation laws prohibiting interracial marriages in the early twentieth century, which should tell you something.).
But the big story is at the national level, where the halfhearted attempt by Republicans in Congress to amend the U.S. Constitution to prohibit gay marriage failed in 2006. Without a constitutional amendment, gay rights activists can challenge the state laws before the U.S. Supreme Court on the grounds they violate the Fourteenth Amendment, which guarantees “equal protection.” Meanwhile, the overall trend seems to be one of gradually increasing acceptance. Where Gallup found that 68 percent of American adults opposed gay marriage in 1996, that number gradually dropped to 61 percent in 2003 and then 57 percent in 2009.
DISASTER ALERT
Hurricane Katrina
The worst U.S. natural disaster in over a century, Hurricane Katrina killed more people and caused more damage than any natural event since the Galveston Hurricane in 1900. After originating as a tropical depression over the mid-Atlantic on August 23, 2005, Katrina passed over southern Florida into the Gulf of Mexico on August 26, where it absorbed more energy from the warm tropical waters. By the evening of August 28, Katrina was a Category 5 hurricane with sustained winds of 175 miles per hour and gusts up to 215 miles per hour. It weakened to a Category 3 hurricane by the time it made landfall south of New Orleans early on August 29, 2005, but the storm surge was still devastating to coastal towns. At around 8 a.m., a levee on the east side of New Orleans was breached by rising water in the Industrial Canal. Within minutes the National Weather Service issued a flash flood warning, and less than an hour later, there were over six feet of water in the city’s impoverished Ninth Ward.
![]() The Galveston Hurricane on September 8, 1900 completely destroyed the low-lying port city, killing 8,000 people. Afterwards, the entire city was raised by 17 feet to prevent a repeat of the disaster.
The Galveston Hurricane on September 8, 1900 completely destroyed the low-lying port city, killing 8,000 people. Afterwards, the entire city was raised by 17 feet to prevent a repeat of the disaster.
On August 30 a second levee broke, and by the next day, 80 percent of New Orleans was underwater. As the city’s low-lying areas were submerged, residents who’d ignored earlier warnings to evacuate (or were unable to comply) found themselves stranded on their rooftops waiting for rescue by Coast Guard helicopters. And they were the lucky ones: around 400 people drowned, while another 360 died of injury and illness in New Orleans–including many old and infirm people who couldn’t move to safety–contributing to almost half of Katrina’s total death toll of 1,836 in Louisiana and Mississippi.
Twenty-five thousand people took shelter in the New Orleans Superdome, where they were protected from the elements but lacked food, water, or medical treatment for several days. Cut off from the outside world, conditions at the Superdome became increasingly squalid as the displaced people overwhelmed the trash receptacles and bathrooms. By the time the last people were evacuated to the Houston Astrodome on September 4, 2005, six had died–including four from “natural causes,” one from a drug overdose, and one from suicide. Although the news media was filled with reports of rape and murder in New Orleans and the Superdome, virtually all these turned out to be baseless rumors. There was, however, widespread looting in New Orleans.
I don’t want to go to no Astrodome. I’ve been domed almost to death.
–Janice Singleton, at the Superdome, September 3, 2005
The disaster also led to widespread criticism of the city, state, and federal governments for allowing the better part of a large American city to be destroyed. While local and national officials are still trading accusations, there is plenty of blame to go around. The director of the National Hurricane Center advised the governments of New Orleans and the state of Louisiana to issue a mandatory evacuation order on Saturday, August 27, but New Orleans Mayor Charles Nagin delayed until the following day–then failed to enforce the order. (He finally authorized police and National Guardsmen to remove residents by force, if necessary, on September 6.) As a result emergency response personnel were forced to improvise, including housing 20,000 people in the New Orleans Convention Center; no one knows who made this decision.
Brownie, you’re doing a heckuva job.
–George W. Bush, to FEMA director Michael D. Brown, September 2, 2005
It was beyond the capacity of the state and local governments, and it was beyond the capacity of FEMA.
–Brown, January 18, 2006
It was popular to blame the Federal Emergency Management Administration for its belated intervention, and it seems safe to say its performance didn’t justify praise it received from President Bush. On the other hand, some of this criticism was spin from local officials trying to dodge blame for their own mistakes. There’s no question, however, that the federal government shared responsibility for failing to strengthen and maintain the levees around New Orleans. Flood control is partly a federal responsibility because New Orleans was made more vulnerable by navigation improvements on the Mississippi River intended to facilitate interstate commerce. However, flood control improvements planned in 1965 still weren’t finished–40 years later!–due to lack of funds. Complicating the situation, in the 1970s some proposed flood protection measures were blocked by environmental lobbyists. Meanwhile, studies by the U.S. Army Corps of Engineers, which built the levees in the 1960s, repeatedly warned that they were vulnerable to storm surges–as did some of the contractors employed by the Corps, as well as the New Orleans Times-Picayune, which published a multipart series on the threat in 2002.
None of this talk resulted in any action, however, and New Orleans paid a spectacular price for the negligence. In addition to the deaths, the city suffered $20 billion in damage, contributing to the total price tag of $100 billion for a 93,000-square-mile swath of the Gulf Coast. Indeed, even without the flooding, Katrina was a Grade-A catastrophe. Altogether the hurricane and flooding destroyed 300,000 homes, generated 120 million cubic yards of debris, and displaced 770,000 people, many of whom never returned. The population of New Orleans dipped from 461,600 in 2004 to just 210,768 in 2006; by 2008, it had rebounded to 311,853.
trendspotting
Debt Row
Americans are practically addicted to addiction: alcohol, tobacco, caffeine, gasoline, pornography, reality TV, etc. But, possibly thanks to too many hours playing Monopoly as kids, Americans’ most American addiction is something that doesn’t exist at all: imaginary money.
For most of its history, the U.S. government borrowed very little money. In emergencies (wars), the government was authorized to borrow money from the people by selling “war bonds.” But then during the Great Depression, Presidents Herbert Hoover and Franklin Delano Roosevelt attempted to “prime the pump” of the economy with an innovation–large-scale peacetime deficit spending, peaking at $4.3 billion in 1936. Anathema to old-fashioned fiscal conservatives, deficit spending became linked with economic recovery in the popular imagination, changing American public finance forever. In fact, every administration since LBJ has turned to deficit spending at some point: from 1970 to 2010, there have only been four years when the U.S. government didn’trun a deficit (1998–2001).
You may be wondering–if the country did just fine without deficit spending for its first 150 years of existence–what are we spending all this money on now. Well, a whole bunch of “mandatory” social spending like Medicare and Medicaid, for one thing. Combined spending on these two programs alone came to $511 billion in 2006 and is projected to increase to $1 trillion annually by 2020 (down from an earlier projection of $1.5 trillion, thanks to the health-care reform bill passed amid much acrimony in March 2010).
Despite the supposed cost reductions contained in the bill, the fact remains that both political parties have embraced increasingly reckless financial policies. From 2000 to 2008, the Republican Party threw its small government ideology to the wind, with deficit spending growing to $460 billion in 2008. And that’s nothing compared to the deficits that followed during the Obama administration, as the government borrowed to stimulate a shell-shocked economy and escalate the war in Afghanistan–sending the annual budget deficit to $1.41 trillion in 2009, $1.56 trillion in 2010, and a projected $1.27 trillion in 2011. At this rate, the total U.S. debt is projected to increase from $12 trillion in 2009 to $20 trillion in 2020.
Those figures are enough to make economists very nervous. One of the most commonly used measures of a country’s financial health is the ratio of its total debt to its annual gross domestic product. From about one-third of GDP in the mid-1970s, the U.S. government debt gradually increased to about 50 percent of GDP in the late 1980s, before zooming to 94 percent of GDP in 2010.
At Debt’s Door
U.S. Budget Deficits ($ billions)
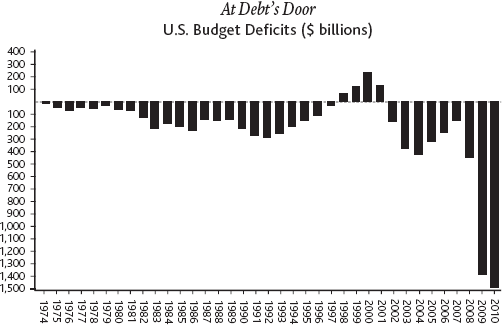
Will there be any negative consequences from owing this much dough? No one knows, because the United States is entering mostly uncharted territory in terms of its debt. What we do know is that so far, 2010 is turning out to be an anemic recovery at best, with most economists forecasting low growth rates for the next decade or so–meaning the debt is just going to sit there and fester.
CASH OR CREDIT?
In addition to the national debt and the mortgage debt, Americans have piled up an impressive amount of consumer debt–mostly in the form of credit card debt. From 2006 to 2008, total U.S. credit card debt increased from $770 billion to $973 billion. That comes to $8,316 per household. By contrast, Chinese consumers owe a total $114 billion, equaling $325 per household. What’s more, from 2010 to 2014, U.S. credit card lenders expect to write off $395 billion in bad loans–up from $275 billion from 2005 to 2009.
When it’s $100,000 of debt, it’s your problem. When it’s a million dollars of debt, it’s the bank’s problem.
–Robert D. Manning, author of Credit Card Nation
Going Green
Americans have been concerned about the impact of human activity on the environment at least as far back as the conservationist movement in the late nineteenth century, which resulted in the establishment of the National Park System, beginning with Yellowstone in 1872. In the second half of the twentieth century, books like Rachel Carson’s Silent Spring, published in 1962, raised awareness about the effects of man-made pollutants on the natural world and human health, leading to the modern environmental movement. Environmental legislation brought reductions in common pollutants like lead and mercury and combated the growth of landfills through recycling.
The last years of the twentieth century brought a second wave of environmental activism, focused on the threat of global warming (allegedly) caused by man-made “greenhouse” gases, chiefly carbon dioxide. Scientists first proposed the theory of a “greenhouse effect,” in which carbon dioxide and water vapor trap reflected solar radiation in Earth’s atmosphere, in the late nineteenth century–but their work was largely ignored until 1976, when Stanford University climatologist Stephen Schneider linked the greenhouse effect to a sharp rise in temperatures. In 1988 the United Nations and the World Meteorological Organization formed the Intergovernmental Panel on Climate Change to study and combat the phenomenon of global warming. In 1998, 186 countries signed the Kyoto Protocol, agreeing to reduce greenhouse gas emissions–although it received a setback when the Bush administration refused to ratify it in 2001.
While the U.S. government has been balky about combating climate change, the American people seem increasingly willing to jump on the “green” bandwagon, as reflected in the success of Al Gore’s 2006 documentary, “An Inconvenient Truth,” and the growing obsession with “carbon footprints.” Unsurprisingly, marketers have latched on to the green trend with an array of “environment-friendly” products and services, including food, clothing, cars, houses, appliances, consumer electronics, bathroom fixtures, financial planning, travel bookings, daycare, pet grooming, mortuary arrangements … the list is practically infinite.
But America is a contradictory place, and there also seems to be growing skepticism about global warming: in 2009 an opinion poll by Harris Interactive found 51 percent of Americans believed that global warming was caused by greenhouse gases–down sharply from 71 percent just two years before. The cause wasn’t helped by revelations that climate scientists at the IPCC had issued exaggerated forecasts of global warming impacts.
In the midst of the worst recession in decades, polls also show that a majority of Americans prioritize economic growth above environmental issues. Still, there seem to be areas where “green” issues and economic concerns overlap. One hot-button issue is fossil fuels, where environmentalists and economists receive additional support from national security wonks who want to discourage dependence on Middle Eastern oil.
![]() In 1980 there were about 105 million acres of wetlands in the United States, but by 2010 the number had shrunk almost 10 percent to 95 million acres. The country is currently losing about 80,000 acres of wetlands per year–scientists estimate there were over 220 million acres of wetlands before European settlement.
In 1980 there were about 105 million acres of wetlands in the United States, but by 2010 the number had shrunk almost 10 percent to 95 million acres. The country is currently losing about 80,000 acres of wetlands per year–scientists estimate there were over 220 million acres of wetlands before European settlement.
Better Living Through Medication
The end of the twentieth century brought a huge increase in the number and amount of prescription drugs taken by Americans, both legally and illegally. In 2004 the U.S. Department of Health and Human Services found that half of Americans were taking at least one prescription drug, with one in six Americans taking three or more medications. Some of the most popular–and controversial–prescription drug categories include antidepressants, stimulants to treat attention deficit hyperactive disorder, drugs for erectile dysfunction, and of course those perennial favorites, the opioids.
The antidepressant surge began with Prozac, invented in 1972 and first marketed in the United States for treatment of depression and other mental illnesses in 1988. The number of prescriptions for all kinds of antidepressants surged over 250 percent from 46 million in 1990 to 164 million in 2008. Predictably, the explosion in antidepressant use has caused some alarm: experts point out that no one knows the long-term effects of these drugs, and some critics have blamed Zoloft and Paxil for psychotic episodes in some patients (although these allegations are disputed). Nonetheless, the drugs have proved a godsend for the roughly 20 million Americans who suffer chronic depression, helping them live normal, productive lives.
![]() Even though it seems much longer, we’ve only been inundated with TV commercials for prescription drugs since 1997, when the FDA relaxed the rules for direct-to-consumer drug advertising.
Even though it seems much longer, we’ve only been inundated with TV commercials for prescription drugs since 1997, when the FDA relaxed the rules for direct-to-consumer drug advertising.
You don’t hear nearly as many complaints about another new class of prescription wonder drug–medications for the treatment of male erectile dysfunction, including sildenafil citrate (Viagra, invented by Pfizer and approved by the FDA in 1998), vardenafil (Levitra, Bayer-GSK-SP, 2003), and tadalafil (Cialis, Eli Lilly-ICOS, 2003). These drugs represented a revolution in the treatment of impotence–one of the most common and psychologically harmful male sexual complaints–so in that regard, they pretty much sell themselves. However, in the early stages of marketing Viagra, Pfizer still faced the challenge of, heh, raising awareness about the new treatment and overcoming predictable reactions of shame and embarrassment, not to mention general reluctance among older generations to talk about, you know … S-E-X. So who better to, er, spearhead the marketing effort than Bob Dole, the former Republican senator from Kansas? After stepping into the national spotlight with his failed campaign to unseat the Democrat President Bill Clinton in 1996, in 1999 Dole lent his folksy humor and respectability to Pfizer’s print and broadcast ad campaign promoting Viagra.
ROID RAGE
Another troubling trend is the illicit use of anabolic steroids, which male and female athletes take to build muscle and improve their performance on the playing field. Currently about one million Americans are estimated to take anabolic steroids illegally, about half of whom are adolescents. A 1990 survey found about 4.4 percent of high school students said they had used or were currently using steroids, edging up to 6.1 percent in 2005–and that’s just the ones who admitted to it. But it’s not just about athletics. Interestingly, roughly a third of male high school students who abuse steroids say they do so solely to improve their appearance, reflecting the steady inflation of expectations for physical beauty among men and women alike.
Steroid users run the risk of quite a few negative side effects, which include increased risks of heart disease, immune suppression, kidney disease, prostate enlargement, and sterility in both men and women. Of course, taking male sex hormones linked to aggression can also have some predictable psychological side effects, like … aggression. The phenomenon of “roid rage,” while seemingly less common than other side effects, is potentially the scariest: anecdotal evidence includes stories of mania, paranoia, psychosis, and violence from previously stable individuals … who can now hurl a grown man across the room. What’s not to like?
Statistical evidence seems to suggest (but not prove) the existence of an epidemic: for example, the average weight of NFL linemen increased from about 250 pounds to 300 pounds from 1980 to 2005. Meanwhile, the number of home runs per Major League Baseball game jumped from 0.8 per game around 1990 to 1.2 per game in 2000. Baseball players seem especially prone to steroid abuse, as revealed by the investigation into a hormone supplement company called BALCO in 2003–2004. Famous baseball players who admitted using steroids include Mark McGwire, Barry Bonds, Jason Giambi, Alex Rodriguez (“A-Rod”), Ken Caminiti, and Jose Canseco. Canseco estimated that 85 percent of players in Major League Baseball abused steroids, while Caminiti offered a more modest estimate of 50 percent. (The MLB banned steroids in 1991, but for some reason didn’t start testing until 2003; from 2005 to 2006, 111 players were suspended.)
A great deal more controversy surrounds the growing use of stimulants like Ritalin and Adderall, in large part because so many medicated people are preteens. Parents and teachers have looked on these drugs as a miracle cure for attention deficit disorder (ADD), characterized by an inability to focus or complete tasks, and attention deficit hyperactive disorder (ADHD), which has the bonus of rambunctious, disruptive behavior in the home and classroom. The total number of prescriptions for Ritalin, Adderall, and related ADD/ADHD drugs rocketed from three million in 1990 to 39.5 million in 2008–a 1,200 percent increase–while the number of children taking these drugs increased from one million to over six million. And many of these kids are young: in the mid-1990s, the biggest rate of increase in new Ritalin prescriptions was among children ages 2–4.
All this has elicited a number of criticisms from researchers, doctors, and children’s advocates. First of all, they point out that (like antidepressants) the long-term effects of these drugs are still unknown, while studies have shown that amphetamines in general can cause permanent changes in brain chemistry. Even if the drugs aren’t harmful, many believe they are overprescribed, accusing doctors and parents of being too quick to classify any undesirable behavior or learning disability as ADD/ADHD. They also warn that stimulants are habit-forming, pointing to widespread abuse of Ritalin and Adderall by teenagers and college students: one study found 10 percent of teens admitted to taking Ritalin or Adderall without a doctor’s order.
Popping Pills
U.S. Prescriptions Filled (millions)

But Ritalin and Adderall ain’t got nothin’ on the golden oldies of prescription drug abuse–opioid painkillers like codeine, Vicodin, and Percocet, whose appeal has only grown with the introduction of new, more powerful medications like oxycodone (brand name OxyContin). According to the Mayo Clinic, the number of prescriptions written for opioid painkillers increased from 40 million in 1991 to 180 million in 2007. Even factoring in the growing number of elderly people in end-of-life care and an increase in the number of surgical procedures (from 24 million to 33 million in 2006), this 350 percent increase in opioid prescriptions seems a little suspicious. And those numbers don’t take into account the drugs that are simply stolen: in 2003 over two million doses of opioid painkillers were filched from pharmacies, with thieves often leaving cash and other valuables untouched. In 2007 an estimated five million Americans were addicted to prescription opioids. The results have been predictable: from 1999 to 2006, opioid overdose deaths more than tripled from 4,000 to 13,500.
 MADE IN AMERICA
Rise of the Dot.coms
990 about two million Americans were using the Internet–less than 1 percent of the total U.S. population; by 2010, the number had climbed to 200 million, or 63 percent of the total population. This expansion went hand in hand with a tidal surge of online business activity, beginning–where else?–in America.
The groundwork for the commercialization of the Internet was laid by Congress in 1992, effectively ceding control of the Internet to private interests. Also in 1992 the Internet became more accessible to non-computer geeks with the launch of America Online and Mosaic, the forerunner of Netscape Navigator. At the time, big businesses were already using the Electronic Data Interchange, their own proprietary system for business-to-business electronic vending, which anticipated many features of the Internet and proved the viability of e-commerce.
Once business-to-business transactions had paved the way, it was only natural to bring the efficiency of e-commerce to business-to-consumer transactions as well: enter online shopping! In addition to convenience, e-commerce eliminated whole categories of business expense: all you really needed was warehouse space, as demonstrated by Amazon.com, the online book–and now, everything–emporium, which launched in 1995. Soon you could buy anything under the sun (and some things beyond the sun: the International Star Registry will let you name a star for $15).
Inevitably, people got a little too excited about the potential for e-commerce, leading to–yes–a financial bubble on Wall Street as stock prices for new “Dot.com” ventures soared, regardless of minor details like profitability and redundancy with other companies with the same idea. The numbers certainly looked good at first glance, as total e-commerce revenues shot up from $4 billion in 1997 to $29 billion in 2000. But startup costs were also huge, with many companies requiring multiple rounds of investment before they could break even. Amazon.com, arguably the most successful Dot.com, had revenues of $1.6 billion in 1999 but still lost $722 million. Across the board, the growth of Dot.com stock values was wildly out of proportion to the actual size of the businesses.
One company in particular, AOL, became an iconic symbol of the Dot.com boom with multi-billion-dollar deals: in 1998 it acquired Netscape for $4.2 billion, and in January 2000, it paid a stupefying $182 billion for Time-Warner, a traditional media company and cable provider. But “irrational exuberance,” as Federal Reserve Chairman Alan Greenspan put it, was endemic. That same month–the end of the good times–20 Dot.com startups paid $2 million-$3 million each for 30-second spots during the Superbowl, while the Dow Jones Industrial Average hit a record high of 11,722.98.
![]() Pizza Hut was the first restaurant chain to offer online ordering to its customers. The pizza peddler test-marketed the system in Santa Cruz, California, in the summer of 1994.
Pizza Hut was the first restaurant chain to offer online ordering to its customers. The pizza peddler test-marketed the system in Santa Cruz, California, in the summer of 1994.
And just as inevitably, the bubble burst as the Dot.coms dot bombed. From February to November 2000, Dot.com stocks shed about $1.8 trillion in value, sinking to a mere $1.2 trillion. Over this period Yahoo alone lost $102 billion in value. But the most spectacular decline came at newly created AOL-Time Warner, which was slammed by the market-wide shift of Internet users from portal-based subscription access, on the AOL model, to high-speed broadband connections. AOL-Time Warner’s total value plunged from $350 billion in January of 2000 to $84 billion in 2004; the companies ended the failed merger in May 2009, and as of 2010, the combined value of the now-separate companies is roughly $50 billion. In other words, in less than a decade, a single corporation saw its value decrease by an amount exceeding the individual GDPs of 180 countries in the year 2000, including Russia, Sweden, Turkey, and Pakistan.
But this was only a bump in the road for e-commerce. The basic concept was sound, indeed irresistible. Total online shopping revenues rose steadily from $30 billion in 2001 to a projected $140 billion in 2010. Meanwhile, whole new growth areas were opened up by the rise in broadband subscriptions, which soared from five million in 2000 to 90 million in 2010, enabling a creative explosion of multimedia content and interactive applications for both good and bad, including blogs, social networks, and photo-, audio-, and video-sharing.
The new king of the Internet (at least for the time being) is Google, the search engine founded in 1998, which took the basic search advertising model established by Yahoo and made it pay, by giving advertisers an opportunity to bid for search-term-based ad placement, greatly increasing the chances of reaching someone interested in their product. From a mere $19 million in 2000, Google’s total ad revenues increased over a thousandfold to $23.6 billion in 2009. More generally, the interactive quality of the Web gives online advertising a huge advantage over traditional media, since advertisers can now directly observe which ads and ad placements spark consumer interest and adjust their strategies accordingly. Excluding Google, total online ad revenues increased from under $1 billion in 1997 to a projected $24 billion in 2010.
INTERNET, INTERNET, MAKE ME A MATCH
For once, money is the least interesting part of the story. What’s truly fascinating is how the Internet is changing everyday life for billions of people around the planet. The phenomenon is too wide-ranging, varied, and dynamic to ever accurately describe, but just look at personal ads: in the good ol’ days, most people frankly viewed personals ads as a last resort, the domain of the antisocial, the ugly, and the generally unmarriageable. Then the Internet changed everything.
One of the first online dating sites, Match.com, was founded in 1993, and by 2004 had eight million active members. It didn’t take long before other dating sites joined the party, and by 2010 the sheer number and variety of online personals sites is astounding, with countless “niche” services targeting various identities at the local, regional, national, and global levels. There are online dating sites for Christians, Muslims, Jews, Hindus, Buddhists, and pagans, as well as dozens of sects, confessions, and sacral divisions within these religions–and don’t forget the sites for atheists and agnostics. There are ethnic dating sites for African-Americans, Hispanics, Asians, mixed-race individuals, and, yes, white supremacists. There are dating sites targeting gays and lesbians, seniors, gold diggers, single parents, and HIV-positive people. There are even sites and people who market themselves as e-Cyrano de Bergerac’s, with the sole goal of polishing up your profile and helping you suave up your e-communications so you can reel in your dream prospect.
And, okay, money’s still part of it. Online dating is big business: in 2009 Match.com’s revenues came to over $340 million, and the company spent over $50 million on TV advertising in 2008. And the money is well-earned, to judge by the growing number of online romance success stories. While it’s hard to judge the company’s claims, one of the most popular online dating sites, eHarmony, claimed to have helped facilitate 43,000 marriages in 2007 alone–about 2 percent of the total 2.3 million weddings in the United States in 2007.
Robots vs. Martians
It’s hard to top the Apollo Program for sheer technical awesomeness in outer space, but the series of remote-controlled robots built by NASA to explore the surface of Mars come pretty darn close (while going a whole lot farther).
First, there’s the robots themselves, which pack a huge amount of sophisticated scientific equipment into an incredibly small package. Sojourner, which landed on Mars as part of the Pathfinder mission on July 4, 1997, weighed just 10.5 kilograms–but this included a computer, solar power panels, several cameras, and a miniature X-ray spectrometer for analyzing soil samples. The two Mars Exploration Rovers that landed on Mars in June and July 2003–Spirit and Opportunity–both weighed 185 kilograms, including solar panels, batteries, computers, communications antennae, cameras, and an instrument arm containing three kinds of spectrometer and a grinder for preparing rock samples. By comparison, the Viking landers sent to Mars by NASA in 1976 weighed 600 kilograms each and carried less scientific instrumentation.
It’s even more amazing that all this complex, sensitive equipment actually works, considering the way these robots are delivered to the Red Planet.
In 2003 the MER missions loaded Spirit and Opportunity onto three-stage Boeing Delta II rockets, which propelled them beyond Earth’s gravity for their 320-million-mile journey to Mars. Six months later, both Explorer spacecraft entered the Martian gravity field in January 2004 traveling at about 12,000 miles per hour.
After hitting the atmosphere, the entry vehicles were slowed to about 1,000 miles per hour by air braking, with external temperatures rising to 2,637° Fahrenheit–the same as the surface of the sun. Then, about 30,000 feet above the planet’s surface, giant supersonic parachutes deployed and rockets fired. The rovers were cushioned from impact on the surface of Mars by pyramid-shaped honeycombs of air bags, measuring 18 feet across, which inflated around the entry vehicles just seconds before impact. After impact, the “bubble-wrapped” landing vehicles bounced four to five stories while rolling about half a mile across the planet’s surface.
Once they came to a stop, NASA mission control crew at the Jet Propulsion Laboratory in Pasadena, California, established regular communications via the Mars Odyssey and Mars Global Surveyor orbiters circling the planet; traveling at the speed of light, it took anywhere from 3 to 22 minutes for radio waves from Earth to reach the landing vehicles and rovers on Mars, depending on the relative location of the two planets. Mission control then transmitted commands causing the air bags to deflate and retract–clearing the way for the landing vehicle’s “petals” to unfold, revealing the Mars Explorer Rovers. After leaving the landing vehicles, the rovers far exceeded their original 90-day mission, and as of 2009, both were still operational. In those six years, the rovers traveled over 13 miles across the surface of Mars, sent back over 250,000 digital photos, and conducted experiments giving scientists a window into the planet’s watery past.
Perhaps most incredible of all is the total cost of the missions to date: just $950 million (which is a rounding error in terms of federal spending in the first decade of the twenty-first century). And of course, one of the best things about robots is that they aren’t people, so if you blow them up, no one gets too upset. Which is not to say they’re disposable: NASA gave comedians priceless material with the 1999 loss of the $125 million Climate Orbiter, which broke up in the Martian atmosphere after mission control engineers mixed up metric and “imperial” units (centimeters and inches).
 BY THE NUMBERS
|
78 |
acres covered by the Mall of America, completed in Minnesota in 1992 |
|
2,995 |
number of people who died in the terrorist attacks on September 11, 2001 |
|
450,000 |
number of troops recommended for an invasion of Iraq by the Pentagon, 1999 |
|
125,000 |
number of U.S. troops in the 2003 invasion of Iraq |
|
75,000 |
number of U.S. troops originally proposed by Secretary of Defense Donald Rumsfeld for the invasion of Iraq |
|
19,000,000 |
vacant homes in the United States, 2010 |
|
$30,000,000,000,000 |
decrease in value of global stock markets following the financial collapse of 2008 |
|
$1,560,000,000,000 |
projected U.S. budget deficit in 2010 |
|
$22,500,000,000,000 |
projected U.S. debt in 2020 |
|
$300 billion |
decrease in stock value of AOL-Time Warner from 2000 to 2009 |
|
$260 billion |
gross domestic product of Russia, 2006 |
|
13,000,000 |
Americans taking antidepressants in 1996 |
|
30,000,000 |
Americans taking antidepressants in 2008 |
|
70,000,000 |
acres of developed land in the United States, 1990 |
|
120,000,000 |
acres of developed land in the United States, 2009 |
|
1,836 |
deaths resulting from Hurricane Katrina, 2005 |