14
Throughout history, poverty has always been and still is bad for your health. Even as the technological advances of the late 19th century lessened the burden of labor and lengthened life expectancy, it was still the poor, living in crowded slums, where infections disease flourished, or on rural dirt farms with barely enough to eat, who suffered the brunt of disease and early death. However, atherosclerosis in general, and coronary heart disease in particular, was a notable exception. As the 20th century began, coronary heart disease was viewed as a disease of affluence and was relatively rare among the poor.1 However, as the 20th century brought less oppressive working conditions, better nutrition, a higher general standard of living, and longer life to the U.S. population at large, it also brought coronary heart disease to the masses. As more and more Americans grew able to enjoy a middle-class lifestyle and extreme poverty grew relatively rare, atherosclerosis coronary heart disease became the leading cause of death among all strata of American society. By the end of the century, it was those at the bottom of the socioeconomic ladder, who suffered the most from this disease. This chapter will explore the role of the elements of the emerging middle-class lifestyle—specifically an abundant diet, a shrinking necessity for vigorous physical inactivity, and the increasing prevalence of obesity—in the rise and decline of heart disease from 1900 to the present.
In the previous chapters, I have tried to present an orderly progression of evidence-based advances informed by epidemiology and confirmed by randomized clinical trials. However, we must rely mostly on epidemiological observations for evidence of the impact of lifestyle on cardiovascular disease.
• In prospective epidemiologic studies like Framingham, diet, physical inactivity, and obesity are not independently associated with subsequent risk of cardiovascular events. Their impact on cardiovascular risk seems to operate substantially through their effects on more proximate risk factors like BP, cholesterol, and diabetes.
• Measuring diet and exercise accurately and controlling behavior are next to impossible in free-living volunteers. Few people are willing and able to keep a detailed and accurate diary of their food intake or physical activity over any length of time. Instruments like the 24-hour dietary recall, which are often the best one can do in these studies, provide an incomplete and sometimes skewed version of the participant’s typical daily diet.
• Since everyone must eat something, it is difficult to separate the effects of specific dietary components on the outcome of interest. For example, if one wants to reduce the percentage of caloric intake from fat while maintaining overall caloric balance, the percentage of other dietary components—most often, carbohydrate—must go up. So, if LDL cholesterol falls, how can one be certain whether the reduction in dietary fat or the complementary increase in dietary carbohydrates is responsible? If one simply reduces fat and does not replace the calories with something else, how can one be certain whether any observed fall in LDL cholesterol is due specifically to the reduced intake of fat or to the general reduction in caloric intake?
• Randomized clinical trials of the direct impact of diet, exercise, and obesity on cardiovascular disease outcomes require very large numbers of participants (10,000 or more) and 7–10 years to complete. Maintaining compliance over the full duration of such a trial is all but impossible outside of a prison or institution. Very few such trials have been successful.
There is certainly no shortage of scientific and popular books and articles on diet, exercise, obesity and cardiovascular disease. Indeed, a bewildering array of popular books have been written, especially on diet, each offering detailed (and sometimes conflicting) guidance for attaining a svelte physique and cardiovascular health. Even the scientific literature on this subject is rather contentious. A detailed review of this diverse literature is beyond my scope or expertise. I will simply confine myself to acquainting you with the consensus lifestyle recommendations of the mainstream medical experts and their rationale.
Without embarking on a lengthy review, I will cite three examples of unsuccessful attempts to show that lifestyle interventions improve cardiovascular outcomes. In the late 1990s, the Women’s Health Initiative (WHI) randomized 48,835 postmenopausal women to receive either a control diet in which fat comprised at least 32% of the caloric intake or a diet designed to reduce fat intake to 20% by limiting meats and fatty foods and adding fruits, vegetables, and grains.2 After 8.1 years mean follow-up, there were only modest differences in cardiovascular risk factors and no differences in the incidence of heart attack, stroke, or cardiovascular mortality between the two groups. I have already commented on the NIDDK’s Look-AHEAD Study, a dietary weight loss study in 5125 obese type 2 diabetic patients, in Chapter 7.3 In that study, patients on the active diet successfully lost 8.6% of total body weight in year 1 (versus 0.7% in the control group) but could not sustain this weight loss over time. After nine years of follow-up, there was no difference in mortality between the two groups. Finally, the 1976–79 National Exercise and Heart Disease Project (NEHDP) trial randomized 651 male heart attack survivors to a supervised exercise program versus usual care.4 After 19 years, mortality was not significantly reduced. A 1989 overview of 22 similar cardiac rehabilitation trials also showed no net reduction in mortality.5
So, the 2013 AHA/ACC Lifestyle Management Guidelines, which acknowledge that “RCTs examining the effects on hard outcomes (myocardial infarction, stroke, heart failure, and CVD related death) are difficult if not impossible to conduct,” are based on studies of the impact of these interventions on cardiovascular risk factors rather than health outcomes.6 Here are the key recommendations of this panel and of a separate AHA/ACC Panel on Managing Obesity7:
Dietary recommendations:
• Consume a dietary pattern that emphasizes vegetables, fruits, and whole grains, includes low-fat dairy products poultry, fish, legumes, non-tropical vegetable oils, and nuts, and limits sweets, sugar-sweetened beverages and red meats.
• For LDL cholesterol lowering, reduce intake of saturated fats (5–6% of calories) and trans fats.
• For BP lowering, reduce daily intake of sodium below 2400 mg; below 1500 mg is even better.
Physical Activity:
• Adults should engage in aerobic physical activity, 3–4 sessions per week, lasting on average 40 minutes per session and involving moderate- to vigorous-intensity physical activity.
Obesity
• Body Mass Index (BMI), which is calculated by dividing body weight in kilograms by the square of the height in meters, is the standard criterion. BMI > 25 indicates overweight, BMI > 30 indicates obesity, and BMI > 35 indicates morbid obesity. Body waist circumference is another useful measurement.
• Caloric restriction—< 1500 Cal per day in women and < 1800 Cal per day in men—is the preferred method of weight reduction in those who are overweight or obese.
• Bariatric surgery (in which a portion of the stomach is stapled to reduce its capacity) may be warranted in morbidly obese high-risk patients.
Diet and Cardiovascular Risk Factors
In the absence of direct evidence linking lifestyle interventions to cardiovascular outcomes, expert panels have relied mainly on studies linking these interventions to established cardiovascular risk factors—specifically LDL cholesterol, BP, and type 2 diabetes. There have been many small but rigorous studies, performed under controlled conditions in metabolic wards, of the influence of dietary fats on serum cholesterol level. Two classic examples, a study by Ancel Keys and another by David Hegsted, both published in 1965, developed linear regression models showing that (in descending order of strength of association) higher intake of saturated fat (found in animal fat and tropical oils), lower intake of polyunsaturated fat (found in corn, sunflower, safflower, and other plant oils), and higher intake of cholesterol (found in animal and dairy fat and eggs) each raised serum cholesterol levels.8 Their work has held up well in subsequent studies. In my own master’s thesis, for example, I found similar (but weaker) relationships of changes in dietary composition (as derived from 24-hour dietary recall data) to changes in LDL cholesterol in the run-in phase of the Lipid Research Clinics Coronary Primary Prevention Trial.9 In my analysis, weight loss was an even stronger predictor of a fall in LDL cholesterol, but this may reflect the greater precision of measuring weight than dietary composition in this study.
The most important studies of the impact of diet on cardiovascular risk factors are the two Dietary Approaches to Stop Hypertension (DASH) trials, (both supported by the NHLBI) in which all meals were prepared for study participants to rigorous specifications and sample meals were sent to a laboratory for nutrient analysis.10 In the first DASH trial, after a three-week run-in period in which all 464 participants received a control diet designed to reflect a “typical American diet” containing 36% fat, they were randomized to three groups: (1) a control group who continued to receive the typical American diet, (2) a diet enriched in fruit, vegetables, and whole grains but in which fat content and total calories were similar to the control diet, or (3) a diet similar to #2 but with replacement of dairy products with their low-fat counterparts and overall reduction of fat content to 26%.11 After eight weeks, diet #2 significantly reduced both systolic and diastolic BP by 2.8 and 1.1 mmHg, respectively, relative to the control diet, and diet #3 reduced systolic and diastolic BP by 5.5 and 3.0 mmHg. In a subsequent analysis, diet #3 (but not diet #2) also significantly reduced LDL cholesterol by 10.7 mg/dL.12 Diet #3 is now known as the DASH diet.
Upon the completion of the first DASH trial, a second 2×3 factorial trial was undertaken in which 412 participants were randomized to the DASH or control (typical American) diet and to either high (3.3 g/day), intermediate (2.5 mg/day), or low (1.5 g/day) sodium content.13 At the end of 30 days, systolic and diastolic BP both fell significantly as sodium intake was reduced and were significantly lower in the group receiving the DASH versus control diet at every level of sodium intake. Mean BP was 133/84 mmHg in the group receiving the control high-sodium diet and 124/79 in the group receiving the DASH low-sodium diet. Thus, the DASH low-sodium diet became the standard dietary recommendation for treating hypertension.
In view of the worsening problem of obesity, insulin resistance, and type 2 diabetes since the 1970s, dietary plans employing the “glycemic index,” a quantitative scale of the glycemic load imposed by the consumption of different carbohydrates, have gained popularity.14 Sugars, refined carbohydrates (like white bread), and potatoes are among the foods with a high glycemic index, while whole grains, fresh produce, and fructose are among the foods with a low glycemic index. While the standard DASH diet tends to be high in foods with a low glycemic index, an NHLBI controlled feeding trial called OmniCarb (Effect of Amount and Type of Dietary Carbohydrates on Risk for Cardiovascular Heart Disease and Diabetes Study), which specifically compared a low-glycemic index version of the DASH diet with a high-glycemic index version of the DASH diet, found no significant improvement in insulin sensitivity or other risk factors.15
Recently, a dietary model based on the diet of Mediterranean countries like Spain, Italy, and Greece (which enjoy relatively low rates of heart attack and stroke) has gained increasing currency.16 Like the DASH diet, the “MED” diet emphasizes fruits, vegetables, and whole grains and reduced intake of red meats. But unlike the DASH diet (which replaces sources of saturated fat with carbohydrates), the MED diet calls for increased intake of sources of unsaturated fat (like olive oil and nuts) to compensate for lost saturated fat calories. In 2013, a 7447-participant Spanish randomized trial called Prevención con Dieta Mediterránea (PREDIMED) compared two versions of the MED diet—one involving supplementation with extra virgin olive oil and the other involving supplementation with nuts—versus a control diet recommending reduced fat intake.17 Although the first version of their article had to be retracted due to data irregularities, the revised corrected version still showed a significant 30% reduction in the combined incidence of heart attack, stroke, and cardiovascular death (the primary outcome measure) in both MED groups versus the control groups after a mean 4.8 years of follow-up. Unlike DASH, PREDIMED was conducted in free-living people and did not report dietary compliance or actual nutrients consumed. So the actual specifications of the MED diet and the control are difficult to pin down. The results of PREDIMED are consistent with other published studies (mostly observational) of the Mediterranean diet.18 Because of the success of PREDIMED where prior diet-heart trials had failed, the Mediterranean diet will likely be put on an equal footing with the DASH diet in future AHA/ACC guidelines.
Exercise and Cardiovascular Risk Factors
Exercise is one of those virtuous behaviors that everyone knows is good for you, but it is best not to rely on epidemiologic cohort studies like Framingham, to support this hypothesis. People who exercise regularly are undoubtedly healthier than those who do not, but there is a chicken-and-egg factor here. Is it lack of exercise that causes poor health, or is it poor health that limits a person’s capacity to exercise? The best epidemiologic evidence that exercise lowers cardiovascular disease outcomes comes from classical occupational studies going back to the 1950s and 1960s, which compared seat-bound London coach drivers with conductors who walk the aisles, sedentary postal office workers versus mailmen who walk a delivery route, sedentary railroad workers versus active longshoremen. Each of these studies showed that people of comparable socioeconomic status with more active jobs had lower rates of heart attack and other cardiovascular events than those with sedentary jobs in the same sector.19
The evidence linking exercise with improvement in known cardiovascular risk factors is more robust. A 2003 overview of exercise studies reported that regular exercise is associated with improved exercise tolerance, reduced body weight, reduced BP, reduced LDL cholesterol, increased HDL cholesterol, and increased physical activity.20 The first two benefits are obvious, although they are not among the traditional Framingham independent risk factors. However, getting more exercise clearly helps lower BP and LDL cholesterol and curb the development of insulin resistance—the precursor of type 2 diabetes. These benefits may be mediated at least in part by the importance of exercise in maintaining a healthy body weight. The increase in HDL cholesterol, which was touted in 2003 as a major benefit of exercise, has lost some of its luster in view of the recent negative CETP trial experience (see Chapter 8).
The specific benefits of exercise in patients with metabolic syndrome (a constellation of metabolic risk factors that includes insulin resistance) were explored in a 2013 meta-analysis of seven randomized clinical trials.21 Significant reductions in BMI, waist circumference, systolic and diastolic BP, LDL cholesterol, plasma glucose, and cardiovascular fitness (as measured by peak oxygen consumption) and a significant increase in HDL cholesterol were observed. Again, the extent to which the beneficial effects of exercise on BP, cholesterol, and insulin resistance are mediated by weight control is uncertain.
Obesity and Cardiovascular Risk Factors
Although obesity is generally not an independent predictor of future heart attacks and other adverse cardiovascular events in Framingham and other epidemiologic studies, there is no doubt that obesity is bad for the heart.22 There are two major problems with epidemiologic studies of obesity. First, obesity is a major contributing cause of type 2 diabetes, hypertension, and hypercholesterolemia. So epidemiologic models that include these more proximate causes of cardiovascular disease tend to drown out the impact of obesity acting through these risk factors. Second, significant weight loss (“wasting”) is a frequent pre-terminal accompaniment of failing health—not just in cancer patients, but in patients with advanced heart failure or dementia and for very elderly and frail persons in general. This phenomenon gives rise to the “obesity paradox” in which persons at the far low end of the BMI distribution—especially those who have lost weight recently—tend to exhibit the highest rates of cardiovascular disease and mortality in epidemiologic studies. The 2006 updated AHA Scientific Statement on Obesity and Cardiovascular Disease sums up the evidence very nicely, including the direct cardiovascular adverse effects of obesity and its contribution to increased morbidity and mortality during cardiovascular surgery.23 But most of all, the alarming rise in obesity in the U.S. during the last three decades, as shown in Figure 14.1, is certainly the major cause of the explosive rise in type 2 diabetes during this period (see Figure 7.1 in Chapter 7) and has been a drag on progress in controlling BP and LDL cholesterol.24
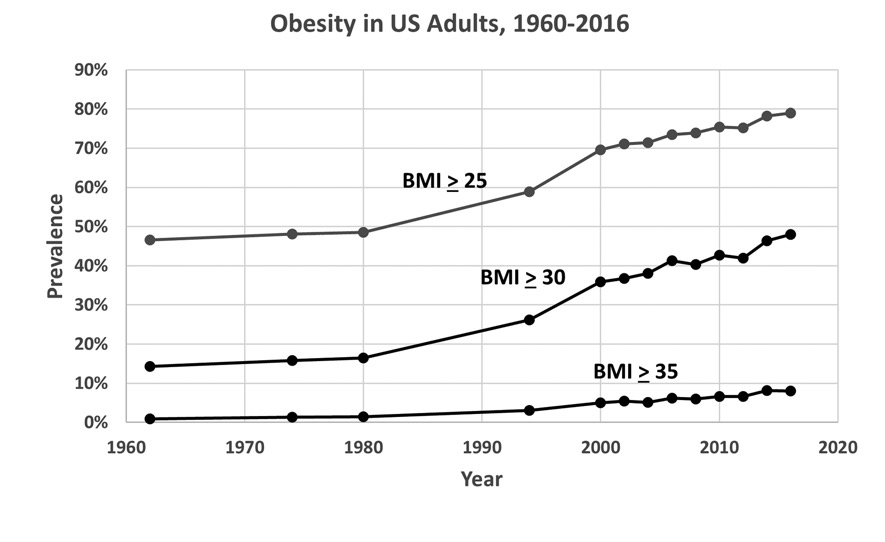
U.S. obesity trend, 1960–2016. Data are from NHANES surveys. National Center for Health Statistics. Health E-Stats, September 2018.
A 2019 article projecting recent obesity trends forward predicts that the prevalence of obesity (BMI > 30 kg/m2) among U.S. adults will stabilize at 50% but that the prevalence of severe obesity (BMI > 35 kg/m2) will triple to 24% in 2030.25
A History Lesson: The Role of Changing Lifestyle in the Heart Attack Pandemic
As we have said earlier, the 20th-century cardiovascular disease pandemic was actually a pandemic of atherosclerotic coronary heart disease or, more simply put, heart attacks. Mortality from heart attacks, all heart diseases, and all cardiovascular diseases rose during the first 60 years or so of the 20th century then declined steadily thereafter, falling well below the 1900 mortality rates (Figure 1.1). Stroke mortality, on the other hand, was already declining in 1900 and declined steadily throughout the 20th and early 21st century. In the previous chapters we have addressed the role of smoking in explaining about 28% of the doubling of heart disease mortality between 1900 and 1960 and the role of a variety of medical advances in the > 80% decline in heart attack deaths since then. So where do diet, exercise, and obesity come in?
We must begin with a summary of the profound social and cultural developments that had already taken hold in 1900 and accelerated over the course of the 20th century, transforming every aspect of American life. These developments include:
• The industrial revolution of the late 19th century sparked a mass migration from farms to cities. The proportion of Americans living on farms which had been 94% in 1800, declined to 39% by 1900, and continued to decline to 16% in 1950, and 1% in 1990.26 Meanwhile, the proportion of Americans living in cities increased from 40% in 1900 to 64% in 1950 to 75% in 1990.
• In the late 19th and early 20th centuries, waves of immigration from Ireland, Italy, Germany, China, Eastern Europe, and Latin America and of migration of southern rural Blacks to northern cities brought greater diversity to American cities.
• Automation and the union movement reduced the burden of physical labor and afforded average Americans more leisure time for recreation.
• Advances in public hygiene and the development of vaccines and (much later) antibiotics reduced infant and maternal mortality and extended life expectancy. In 1900, for every 1000 live births, 100 infants did not live to see their first birthday and six to nine women died of pregnancy-related complications.27 By 1997, infant mortality had fallen by 93% to about 7 per 1000, and maternal mortality was less than 5 in 100,000. Mean life expectancy increased from 49 years in 1900 to nearly 80 years today.28
• The invention and popularization of the automobile around the turn of the century made it possible to perform daily errands without physical exertion.
• The popularization of television in the 1950s and personal computers in the late 1990s has contributed mightily to Americans’ increasingly sedentary lifestyle and the acceleration of our epidemic of obesity.
One thing that has changed less than you might think since 1900 is the American diet. The popular myth in some circles is that the doubling of heart disease deaths in 1900–60 reflects our straying from the pristine heart-healthy diet of our agrarian forbearers and succumbing to the charms of red meat, butterfat, salty, fatty convenience foods, and general overindulgence. The truth is more complicated. Deprivation and malnutrition were widespread in the inhabitants of rural backwaters and crowded city slums at the turn of the century; their lean dietary intake was dictated by necessity, not by choice. The elites and the prosperous farmers of that time ate very well indeed, as illustrated in the following literary descriptions of Sunday dinner on the farm in the late 19th century—the first from Laura Ingalls Wilder’s Farm Boy and the second from Willa Cather’s My Antonia.
Mother sliced the hot rye’n’injun bread on the bread-board by her plate. Father’s spoon cut deep into the chicken-pie; he scooped out big pieces of thick crust and turned up their fluffy yellow under-sides on the plate. He poured gravy over them; he dipped up big pieces of tender chicken, dark meat and white meat sliding from the bones. He added a mound of baked beans and topped it with a quivering slice of fat pork. At the edge of the plate he piled dark-red beet pickles. And he handed the plate to Almanzo. Silently Almanzo ate it all. Then he ate a piece of pumpkin pie, and he felt very full inside. But he ate a piece of apple pie with cheese.29 A few hours earlier, before church, the family had consumed a breakfast consisting of pile after pile of pancakes with butter and molasses, sausage cakes, oatmeal, and apple pie.
On Sundays she [Mother] gave us as much chicken as we could eat, and on other days we had ham or bacon or sausage meat. She baked either pies or cake for us every day, unless, for a change, she made my favorite pudding, striped with currents and boiled in a bag.30
This was clearly not the DASH or MED diet; fresh fruits and vegetables and low-fat dairy products are mentioned nowhere. Lest you think I am cherry-picking, check out the menus from popular early 20th century cookbooks, which feature meats three times a day, sometimes including mutton chops or fried chicken for breakfast, lots of fried potatoes and vegetables, and helpings of cake, pie, ice cream, puddings, etc. for dessert at all the noon and evening meals.31
Table 14.1. Changes in American Diet in 20th Century
|
Dietary Component |
1909–19 |
1960–69 |
1990–99 |
|
Total Calories |
3400 |
3100 |
3600 |
|
Fat, g |
120 |
143 |
151 |
|
Saturated, g |
50 |
54 |
48 |
|
Monounsaturated, g |
47 |
56 |
64 |
|
Polyunsaturated, g |
13 |
22 |
31 |
|
Carbohydrate, g |
487 |
383 |
481 |
|
Protein, g |
96 |
93 |
109 |
|
Cholesterol, mg |
440 |
470 |
400 |
|
Fiber, g |
28 |
18 |
24 |
|
Meats, %Cal |
14.7 |
18.9 |
13.7 |
|
Beef/Pork |
13.3 |
16.2 |
8.9 |
|
Poultry |
0.9 |
2.2 |
4.2 |
|
Fish |
0.6 |
0.5 |
0.6 |
|
Dairy, %Cal |
8.5 |
11.6 |
9.6 |
|
Whole Milk |
5.1 |
6.1 |
1.6 |
|
Low-Fat |
0.8 |
0.7 |
2.1 |
|
Cheese |
0.6 |
1.6 |
3.2 |
|
Other |
2.1 |
3.1 |
2.7 |
|
Eggs, %Cal |
1.8 |
2.1 |
1.4 |
|
Fats & Oils, %Cal |
12.6 |
16.8 |
19.4 |
|
Butter |
4.4 |
1.8 |
1.1 |
|
Margarine |
0.6 |
2.8 |
2.4 |
|
Shortening |
3.1 |
5.1 |
6.7 |
|
Lard, Beef Tallow |
3.8 |
2.2 |
0.9 |
|
Vegetable Oils |
0.7 |
4.8 |
8.3 |
|
Grain Products, %Cal |
37.5 |
21.1 |
24.6 |
|
Legumes, nuts, & soy, %Cal |
2.3 |
3.0 |
3.1 |
|
Vegetables, %Cal |
6.5 |
5.6 |
5.2 |
|
Potatoes |
4.0 |
2.7 |
2.5 |
|
Green/Yellow |
0.9 |
0.4 |
0.4 |
|
Tomatoes |
0.4 |
0.6 |
0.6 |
|
Other |
1.3 |
1.8 |
1.6 |
|
Fruits, % of Calories |
2.9 |
2.8 |
3.3 |
|
Sugars & Sweeteners, %Cal |
12.9 |
17.8 |
18.8 |
|
Sodium, mg |
920 |
1270 |
1290 |
Turning to less anecdotal data, Table 14.1 (above) shows U.S. Department of Agriculture data on U.S. consumption of key nutrients in 1909–19, 1959, and 1999 at the early, peak and decline phases of the heart attack pandemic.32 If you study this table (which covers all socioeconomic classes), several important points stand out:
• Mean daily caloric intake did not change very much. Indeed, daily caloric consumption was higher in 1909–19 than in 1960–69. However, daily calorie expenditure fell far more, as jobs required less strenuous physical labor and shorter hours. Then, daily caloric intake rose by 17% between the 1960s and 1990s while jobs became even more deskbound and obesity began to take off (Figure 14.1). Indeed, the popularization of personal computers and email in the 1990s and smart phones in the 2000s made it possible to communicate with co-workers without even leaving one’s chair.
• The mid–20th century diet derived a higher proportion of its calories from fat—particularly saturated fat—and less from carbohydrates than the 1909–19 diet. The rise in fat consumption largely reflects the greater annual consumption of beef, which grew from a steady 40–50 pounds per capita before 1950, peaked as high as 90–95 pounds per capital in the late 1970s, and then fell back to about 60 pounds per capita at the end of the century. Annual pork consumption was relatively stable at 40–50 pounds per capita throughout the century, while annual poultry consumption steadily rose from 10 to 50 pounds per capita.33 Increased consumption of dairy products also contributed to the rising fat content of the American diet. The fall in carbohydrates largely reflects the drop in grain and potato consumption, although this is offset partially by the increased consumption of sugars and sweeteners, which in turn reflects the growing popularity of carbonated soft drinks.
• The cholesterol and sodium content of the diet also increased between early and mid-century. The sodium figures reported by Hiza and Bente reflect the natural salt content of foods and salt added in canning vegetables and does not include salt added at the table or in home-cured meats (ham, sausage, etc.), which were prominent in the early part of the century.34 Therefore, the reported increase in dietary sodium (which reflects mainly increased cheese consumption) may not be real.
• Many of the qualitative dietary changes in the last three decades of the 20th century—the shift from butter, lard and beef tallow to margarine, shortening and vegetable oils; the shift from beef to poultry; the shift from whole to low-fat milk; the fall in egg consumption; the increase in dietary fiber—appear to reflect the influence of the AHA and other medical experts. However, these ostensible improvements came in the context of rapidly increasing caloric intake, insufficient consumption of fresh fruits and vegetables, unhealthy consumption of sugar and corn syrup, in the form of soft drinks, and exploding rates of obesity and type 2 diabetes.
Impact of Changes in Diet, Execrcise, and Obesity on the Rise and Fall of Cardiovascular Diseases
While acknowledging the paucity of hard evidence from randomized controlled trials (or even compelling prospective epidemiologic studies) demonstrating the quantitative relationship of diet, exercise, and obesity to heart attack and other cardiovascular diseases, I believe that the circumstantial evidence strongly supports a major role of these important lifestyle factors in the doubling of heart disease mortality between 1900 and 1960. Clearly, the disconnect between how much we eat and how many calories we burn daily must have been a major factor. Even the rich and abundant meals described by Laura Ingalls Wilder and Willa Cather, must be viewed in the context of the extreme caloric demands of farm work, which far exceeded the demands on modern physical laborers. Qualitative changes in how those calories were distributed among saturated fats, unsaturated fats, and carbohydrate probably contributed to the increase in heart attacks by raising LDL cholesterol levels, but there were no national surveys of cholesterol levels until the first National Health and Nutrition Examination Survey (NHANES) in 1960.35 I am skeptical about the role of salt consumption and BP in this doubling of heart attack mortality, because the prevalence of “malignant hypertension” and incidence of strokes (a frequent consequence of this disease) have been in decline at least since 1900 (see Chapter 4). In any case, other than the rise of cigarette smoking, which may explain about 28% of the rise in heart attacks between 1900 and 1960, there are few other candidates, other perhaps than the increased stress associated with the urbanization of America. But make no mistake, life in 1900 was hardly stress-free.
Might changes in the U.S. lifestyle since 1970 have contributed to the 81% decline in heart attack mortality since the 1960s? Again, I am skeptical—not because I believe that diet and lifestyle are unimportant, but because they have continued to trend mostly in the wrong direction. Indeed, I believe that if Americans were becoming fitter instead of fatter, there would be far less need for the other interventions described in this book. Ford et al. do not include diet explicitly in their IMPACT model of the changes between 1980 and 2000, although favorable changes in the consumption of meat and dairy products and of saturated fat may have contributed to the model’s estimated impact of LDL cholesterol reduction and BP control on the decline in heart attack mortality.36 However, the contributions of these favorable dietary changes to this model were likely far smaller those of cholesterol- and BP-lowering drugs. I am also highly skeptical of the IMPACT model’s attribution of 5% of the decline in mortality to changes in physical activity, given our increasingly sedentary culture.37 I assume that the authors must have been thinking of the increasing popularity of leisure exercise programs (gym memberships, yoga classes, etc.) among the affluent, rather than the increasingly sedentary American workplace and the popularity of video games and online activity among the young. The estimated 7.6% negative impact of changes in BMI in the IMPACT model probably overlaps heavily with the negative impact of the rise in type 2 diabetes (see Chapter 7).38 The prevalence of obesity in the U.S. has only grown since 2000 (see Figure 14.1). Thus, the combined contribution of post–1968 trends in diet, exercise, and obesity on the decline in heart attack deaths has probably been a wash at best; they have been more a continuing part of the problem than part of the solution.
1. W Osler. Lectures on Angina Pectoris and Allied States. New York: D. Appleton and Company, 1897, pp. 22–23.
2. BV Howard, L Van Horn, J Hsia, JE Manson, ML Stefanick, S Wassertheil-Smoller, LH Kuller, AZ LaCroix, RD Langer, NL Lasser, CE Lewis, MC Limacher, KL Margolis, J Mysiw, JK Ockene, LM Parker, MG Perri, L Phillips, RL Prentice, J Robbins, JE Rossouw, GE Sarto, IJ Schatz, LG Snetselaar, VJ Stevens, LF Tinker, M Trevisian, MZ Vitolins, GL Anderson, AR Assaf, T Bassford, SAA Beresford, HR Black, RL Brunner, RG Brzyski, B Caan, RT Chebowski, M Gass, I Granek, P Greenland, J Hays, D Heber, G Heiss, SL Hendrix, FA Hubbell, KC Johnson, JM Kotchen. Low-fat dietary pattern and risk of cardiovascular disease. The Women’s Health Initiative Randomized Dietary Modification Trial. JAMA 2006; 295:655–666.
3. The Look AHEAD Research Group. Cardiovascular effects of intensive lifestyle intervention in type 2 diabetes. N Engl J Med 2013; 369:145–154.
4. J Dorn, J Naughton, D Inamura, M Trevisian, for the NEHDP Project Staff. Results of a multicenter randomized clinical trial or exercise and long-term survival in myocardial infarction patients. The National Exercise and Heart Disease Project (NEHDP). Circulation 1999; 100:1764–1769.
5. GT O’Connor, JE Buring, S Yusuf, SZ Goldhaber, EM Olmstead, RS Paffenberger, CH Hennekens. An overview of randomized trials of rehabilitation with exercise after myocardial infarction. Circulation 1989; 80:234–244.
6. RH Eckel, JM Jacsic, JD Ard, JM de Jesus, NH Miller, VS Hubbard, IM Lee, AH Lichtenstein, CM Loria, BE Millen, CA Nonas, FM Sacks, SC Smith, LP Svetkey, TA Wadden, SZ Yanovski. 2013 AHA/ACC Guideline on Lifestyle Management to Reduce Cardiovascular Risk. A report of the American College of Cardiology/American Heart Association Task Force on Practice Guidelines. Circulation 2014; 129(suppl 2):S76-S99. DOI: 10.1161/01.cir.0000437740.48606.d1.
7. MD Jensen, DH Ryan, CM Apovian, JD Ard, AG Comuzzie, KA Donato, FB Hu, VS Hubbard, JM Jakicic, RF Kushner, CM Loria, BE Millen, CA Nonas, X Pi-Sunyer, J Stevens, VJ Stevens, TA Wadden, BM Wolfe, SZ Yanovski. 2013 AHA/ACC/TOS Guideline for the Management of Overweight and Obesity in Adults. A report the American College of Cardiology/American Heart Association Task Force on Practice Guidelines and the Obesity Society. Circulation 2014; 129(suppl 2):S102-S138. DOI: 10.1161/01.cir.0000437739.71477.ee.
8. A Keys, JT Anderson, F Grande. Serum cholesterol response to changes in the diet. I. Iodine value of dietary fat versus 2S-P; II The effect of cholesterol in the diet; II Differences among individuals; IV Particular fats in the diet. Metabolism 1965; 14:747–787.
DM Hegsted, RB McGandy, ML Myers, FJ Stare. Quantitative effects of dietary fat on serum cholesterol in men. Am J Clin Nutr 1965; 17:281–295.
9. DJ Gordon, KM Salz, KJ Roggenkamp, FA Franklin. Dietary determinants of plasma cholesterol change in the recruitment phase of the Lipid Research Clinics Coronary Primary Prevention Trial. Arteriosclerosis 1982; 2:537–548.
10. FM Sacks, E Obarzanek, MM Windhauser, LP Svetky, WM Vollmer, M McCollough, N Karanja, PH Lin, P Steele, MA Proschan, MA Evans, LJ Appel, GA Bray, TM Vogt, TJ Moore, DASH Investigators. Rationale and design of the Dietary Approaches to Stop Hypertension trial (DASH): a multicenter controlled-feeding study of dietary patterns to lower blood pressure. Ann Epidemiol 1995; 5:108–118.
11. LJ Appel, TJ Moore, E Obarzanek, WM Vollmer, LP Svetky, FM Sacks, GA Bray, TM Vogt, JA Cutler, MM Windhauser, PH Lin, N Karanja, for the DASH Collaborative Research Group. N Engl J Med 1997; 336:1117–1124.
12. E Obarzanek, FM Sacks, WM Vollmer, GA Bray, ER Miller, PH Lin, N Karanja, MM Windhauser, TJ Moore, JF Swain, CW Bales, MA Proschan, on behalf of the DASH Research Group. Effects on blood lipids of a blood pressure-lowering diet: the Dietary Approaches to Stop Hypertension (DASH) Trial. Am J Clin Nutr 2001; 74:80–89.
13. FM Sacks, LP Svetky, WM Vollmer, LJ Appel, GA Bray, D Harisha, E Obarzanek, PR Comlin, ER Miller, DG Simons-Morton, N Karanja, PH Lin, for the DASH-Sodium Collaborative Research Group. Effects on blood pressure of reduced dietary sodium and the Dietary Approaches to Stop Hypertension (DASH) diet. N Engl J Med 2001; 344:3–10.
14. Mayo Clinic Staff. Glycemic index diet: What’s behind the claims. Mayo Clinic Website. Healthy Lifestyle. Nutrition and Healthy Living. Accessed August 1, 2020, at https://www.mayoclinic.org/healthy-lifestyle/nutrition-and-healthy-eating/in-depth/glycemic-index-diet/art-20048478.
15. FM Sacks, VJ Carey, CAM Anderson, ER Miller, T Copeland, J Charleston, BJ Harshfield, N Laranjo, P McCarron, J Swain, K White, K Yee, LJ Appel. Effects of high vs low glycemic index of dietary carbohydrate on cardiovascular disease risk factors and insulin sensitivity. The OmniCarb randomized clinical trial. JAMA 2014; 312:2531–2541. doi:10.1001/jama.2014.16658.
16. American Heart Association. What is the Mediterranean diet? https://www.heart.org/en/healthy-living/healthy-eating/eat-smart/nutrition-basics/mediterranean-diet.
17. R Estruch, E Ros, J Salas-Salvadó, MI Covas, D Corella, F Arós, E Gómez-Gracia, V Ruiz-Gutiérrez, M Fiol, J Lapetra, RM Lamuela-Raventos. Primary prevention of cardiovascular disease with a Mediterranean diet supplemented with extra-virgin olive oil or nuts. N Engl J Med 2018; 378;e34. DOI: 10.1056/NEJMoa1800389.
Harvard School of Public Health. The Nutrition Source. PREDIMED Study Retraction and Republication. What changed, what didn’t, and the big picture. https://www.hsph.harvard.edu/nutritionsource/2018/06/22/predimed-retraction-republication/.
MA Martinez-Gonzalez, A Gea, M Ruiz-Canela. The Mediterranean diet and cardiovascular health. A Critical review. Circ Res 2019; 124:779–798.
18. LJ Appel, JM Clarke, HC Yeh, NY Wang, JW Coughlin, G Daumit, ER Miller, A Dalcin, GJ Jerome, S Geller, G Noronha, T Pozefsky, J Charleston, JB Reynolds, N Durkin, RR Rubin, TA Louis, FL Brancati. Comparative effectiveness of weight loss interventions in clinical practice. N Engl J Med 2011; 365:1959–1968.
19. SK Agarwal. Cardiovascular benefits of exercise. Int J Gen Med 2012; 5:541–545.
JN Morris, JA Heady, PA Raffle, CG Roberts, JW Parks. Coronary heart disease and physical activity of work. Lancet 1953;265(6795):1053–1057; contd.
JN Morris, JA Heady, PA Raffle, CG Roberts, JW Parks. Coronary heart disease and physical activity of work (part 2). Lancet 1953, Nov 28;265(6796):1111–1120; concl.
HL Taylor, E Klepetar, A Keys, W Parlin, H Blackburn, T Puchner. Death rates among physically active and sedentary employees in the railroad industry. Am J Public Health Nations Health 1962, Oct; 52:1697–1707.
20. J Myers. Exercise and cardiovascular health. Circulation 2003; 107:e2-e5.
21. N Pattyn, VA Cornelissen, SRT Eshgbi, L Vanhees. The effect of exercise on the cardiovascular risk factors constituting the metabolic syndrome. Sports Med 2013; 43:121–133.
22. CJ Lavie, RV Milani, HO Ventura. Obesity and cardiovascular disease. Risk factor, paradox, and impact of weight loss. J Am Coll Cardiol 2009; 53:1925–1932.
23. P Poirer, TD Giles, GA Bray, Y Hong, JS Stern, X Pi-Sunyer, RH Eckel. Obesity and cardiovascular disease: Pathophysiology, evaluation, and effect of weight loss. An update of the 1997 American Heart Association Scientific Statement on Obesity and Heart Disease from the Obesity Committee of the Council on Nutrition, Physical Activity, and Metabolism. Circulation 2006; 113:898–918.
24. CD Fryar, MD Carroll, CL Ogden. Prevalence of overweight, obesity, and severe obesity among adults aged 20 and over. United States, 1960–62 through 2015–2016. National Center for Health Statistics. Health E-Stats September 2018. https://stacks.cdc.gov/view/cdc/58670.
25. ZJ Ward, SN Bleich, AL Cradock, JL Barrett, CM Giles, C Flax, MW Long, CL Gortmaker. Projected U.S. state-level prevalence of adult obesity and severe obesity. N Engl J Med 2019; 381:2440–2450. DOI: 10.1056/NEJMsa1909301.
26. CL Beale. A century of population growth and change. Food Review 2000; 23:16–22. https://wayback.archive-it.org/5923/20110903152144/http://ers.usda.gov/publications/foodreview/jan2000/frjan2000c.pdf.
27. Achievements in Public Health, 1900–1999. Healthier Mothers and Babies. MMWR Weekly 1999; 48:849–858. https://www.cdc.gov/mmwr/preview/mmwrhtml/mm4838a2.htm.
28. Life Expectancy in the USA 1900–98, https://u.demog.berkeley.edu/~andrew/1918/figure2.html. Macrotrends, U.S. Life Expectancy 1950–2020, https://www.macrotrends.net/countries/USA/united-states/life-expectancy.
29. LI Wilder. Farmer Boy, Chapter 8. New York: HarperCollins, 1933.
30. W Cather. My Antonia, Chapter 9. Boston: Houghton-Mifflin, 1918.
31. Food Timeline FAQs. Popular 20th Century American Foods. http://www.foodtimeline.org/fooddecades.html#1900s.
32. HAB Hiza, L Bente. Nutrient Content of the U.S. Food Supply, 1909–2004: A Summary Report. (Home Economics Research Report No. 57). 2007. https://fns-prod.azureedge.net/sites/default/files/nutrient_content_of_the_us_food_supply/FoodSupply1909-2004Report.pdf.
33. USDA Economic Research Service. Major trends in U.S. Food Supply, 1909–99. January-April 2000. https://webs.wofford.edu/boppkl/coursefiles/Interim/CookingInterim/Readings.Exercises/MajorTrendsinUSFoodSupply09_99.pdf.
34. Hiza, Bente.
35. National Health and Nutrition Examination Survey website. National Center for Health Statistics, Centers for Disease Control and Prevention. https://www.cdc.gov/nchs/nhanes/about_nhanes.htm.
36. ES Ford, UA Ajani, JB Croft, JA Critchley, DR Labarth, TE Kottke, WH Giles, S Capewell. Explaining the Decrease in U.S. Deaths from Coronary Disease, 1980–2000. N Engl J Med 2007; 356:2388–2398. DOI: 10.1056/NEJMsa053935.
37. ES Ford, et al.
38. Ibid.