
15
In 1932, the U.S. Public Health Service, with the cooperation of the Tuskegee Institute (now Tuskegee University), initiated a natural history study called the Tuskegee Study of Untreated Syphilis in the Negro Male.1 They enrolled 600 poor Black Alabamans, mostly sharecroppers, 399 of whom had latent syphilis, a venereal disease that progresses slowly over decades and if untreated can eventually lead to severe neurological complications, blindness, dementia, and death. They enticed the participants (most of whom had rarely if ever seen a doctor) with the promise of free medical care, but that free care did not include any education about their condition and included only sham or placebo treatments. Although no safe and effective treatments for syphilis existed until well after the study began, the study doctors actively lobbied local physicians and military physicians (for those who enlisted during the war) not to offer Tuskegee study participants the best treatments available at the time. When penicillin was proven to be a safe and effective cure for syphilis in 1947, it was deliberately withheld from study participants, and the study continued unchanged, despite its violation of the Nuremberg Code for human research, which had been newly adopted as a consequence of the horrific human experiments conducted in Nazi concentration camps. Throughout the Civil Rights movement of the 1950s and 1960s—from the historic Brown v Board of Education decision in 1954 to the assassination of Martin Luther King in 1968—the Tuskegee Study continued to deny its hapless participants access to proven efficacious treatment for syphilis. It was not until July 1972, when a whistleblower named Peter Buxton and an enterprising reporter named Jean Heller exposed what had been going on in Tuskegee in the guise of medical research, that an act of Congress finally ended the study. By this time, 128 Tuskegee study participants had died of syphilis or related complications, at least 40 of their spouses had contracted the disease, and 19 of their children had been born with the disease.
Although we have discussed trends in cardiovascular risk factors and mortality in the previous chapters as if all of us equally enjoy the fruits of the advances in biomedical research, this is clearly untrue. While the appalling Tuskegee study represents the nadir and not the norm for medical research, it is but one of many instances in which medical scientists have ignored the rights of Blacks. For example, consider the story of Henrietta Lacks, an indigent Black Virginia mother whose cervical cancer cells were cultured and shared worldwide without her consent while she died of her cancer in the Johns Hopkins paupers’ ward.2 Poor rural southern Blacks are at the intersection of groups who have historically gotten the short end of the stick in healthcare as in other aspects of life in America. Unfortunately, this too has been the case for cardiovascular disease. While cardiovascular health disparities may not rank high among the many hardships and injustices afflicting Blacks in America, the story of the American front in the battle against cardiovascular disease is incomplete without addressing this topic.
Racial Differences in Mortality
Figure 15.1 shows the U.S. trends in age-adjusted mortality for coronary heart disease (CHD)—i.e., heart attacks—from 1968–2017 and for all heart disease (which include rheumatic heart disease, heart failure, etc., as well as heart attacks) from 1950 to 2017.3
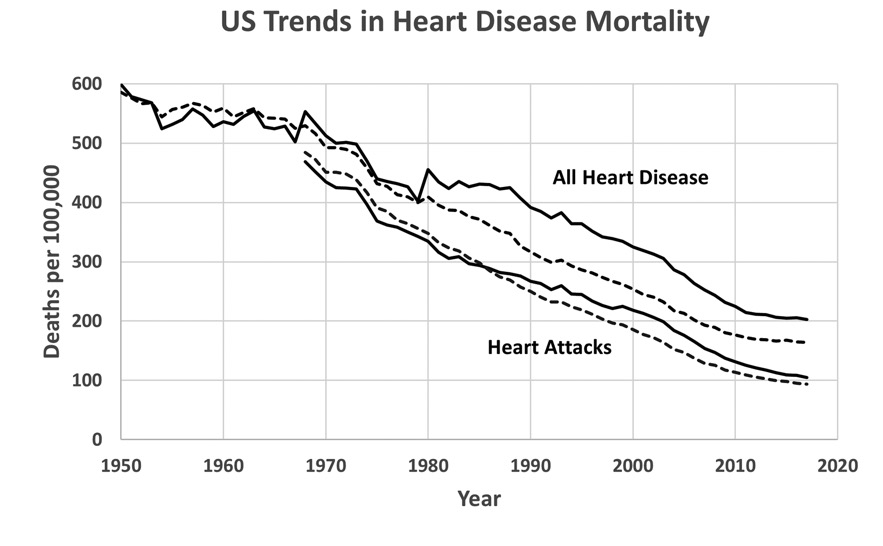
U.S. trends in coronary heart disease (CHD) and all heart disease mortality by race, 1950–2017. From published CDC Vital Statistics compilations. Blacks are represented by solid lines, and Whites by dashed lines. Pre–1968 heart disease mortality rates for Blacks include all non–Whites.
Before we begin discussing these curves, let me point out two technical issues with the heart attack mortality data for Blacks before 1968. First, the mortality rates for Blacks were not separated from other non–White racial groups until 1968; in 1950–67, mortality data were reported only for Whites and non–Whites. Second, when the coding system for classifying heart disease deaths as due to heart attack versus other causes was revised in 1968, some deaths for which hypertensive heart disease and heart failure were contributing causes were newly classified as heart attack deaths.4 This revision affected Blacks more than Whites and led to an abrupt jump in heart attack mortality in non–Whites from 322.6 per 100,000 in 1967 (77% of the rate in Whites) 468.5 per 100,000 in 1968 (97% of the rate in Whites). Neither this coding change nor the separation of Blacks from other non–White racial groups caused a similar discontinuity in the mortality trends for all diseases of the heart or for stroke (see below). Therefore, I have discarded the pre–1968 heart attack mortality data from this analysis but have retained the pre–1968 total heart disease and stroke mortality data. The coding system was revised again in 1979, but this change caused only a small blip in the mortality trends.5
Heart disease mortality was roughly similar among racial groups before 1980, but mortality has been higher in Blacks than Whites from 1980 going forward (Figure 15.1). Similarly, heart attack mortality was slightly lower in Blacks than Whites in 1968 and remained so through 1986, but the curves eventually crossed over in 1986. From 1986 to 2017, mortality rates for heart attack and well as total heart disease have been higher in Blacks than Whites. The Black-White disparity in excess mortality reached as high as 21% for heart attacks and 32% for all heart disease in 2003–04 but has narrowed since then to 12% and 23%, respectively in 2017. Since 1968, mortality rates from heart attacks and all heart diseases have declined steadily in both Blacks and Whites, but more rapidly in Whites. After starting at similar levels in 1968, annual heart disease mortality declined to 164.4 per 100,000 (93.5 due to heart attacks) in Whites versus 202.4 per 100,000 (104.7 due to heart attacks) in Blacks in 2017. Thus, African Americans have not consistently enjoyed the full fruits of the advances we have made toward controlling the heart attack pandemic.
Figure 15.2 shows the U.S. trends in age-adjusted heart attack mortality from 1968 to 2008 broken down by both race and sex.6
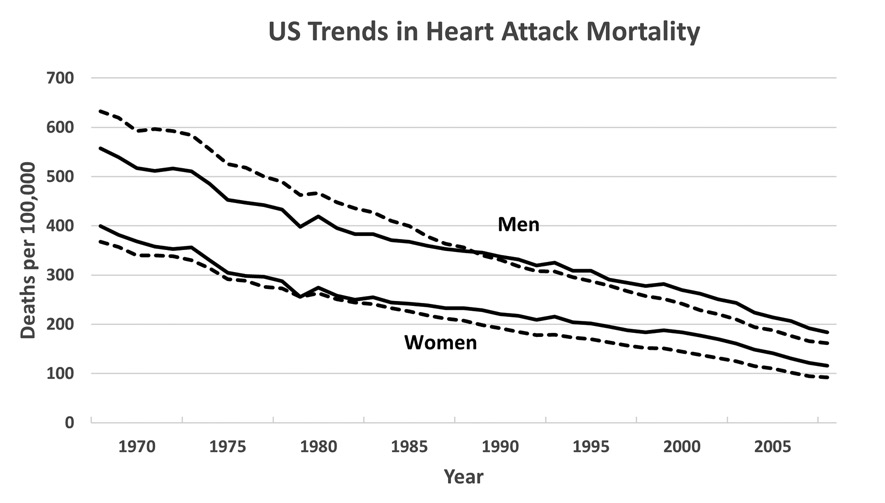
U.S. trends in heart attack mortality by race and sex, 1968–2017. From published CDC Vital Statistics compilations. Blacks are represented by solid lines, and Whites by dashed lines.
In 1968, heart attack mortality was 12.3% lower in Black than White men and 8.6% higher in Black than White women. However, heart attack mortality fell more steeply in White versus Black men (74% versus 67%) and in White versus Black women (75% versus 71%) during the four decades following the 1968 peak. From 1987 to 2008 heart attack mortality was higher in Blacks than Whites of both sexes. By 2008, heart attack mortality was 13.6% higher in Black than White men and 25.8% higher in Black than White women.
Unlike heart disease mortality, stroke mortality rates (Figure 15.3) have always been 35–50% higher in Blacks than Whites—231.3 versus 175.5 per 100,000 in 1950 and 51.2 versus 36.3 per 100,000 in 2017.
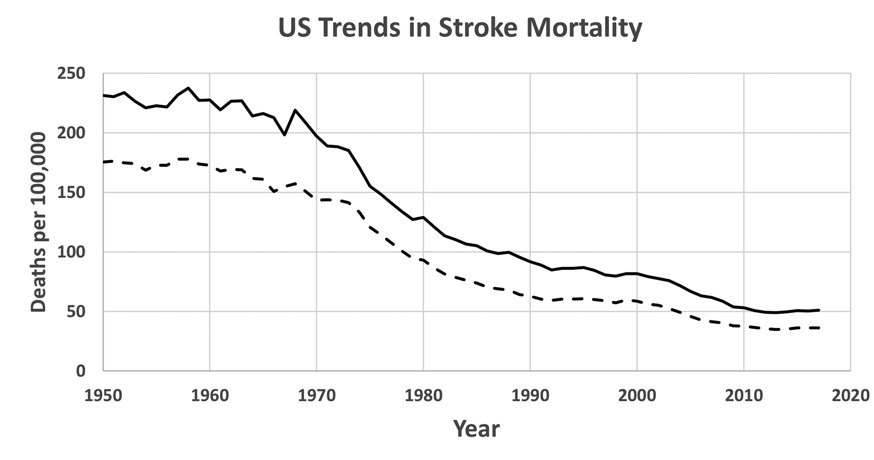
U.S. trends in stroke mortality by race, 1950–2017. From published CDC Vital Statistics compilations. Blacks are represented by solid lines, and Whites by dashed lines. Pre–1968 stroke mortality rates for Blacks include all non–Whites.
This reflects, no doubt, the longstanding Black-White disparity in the prevalence and severity of hypertension. The percent decline in stroke mortality between 1950 and 2017 has been similar (close to 80%) in Blacks and Whites, although the absolute decline in stroke mortality has clearly been higher in Blacks. In the remainder of this chapter, some reasons for the trends in these three figures will be explored. I will draw heavily on an ongoing long-term NIH-funded prospective epidemiologic cohort study called the Reasons for Geographic and Racial Differences in Stroke (REGARDS) study, which was initiated in 2003 to study racial, socioeconomic, cultural, and regional health disparities in the U.S.7
What Is Race?
Let us first stipulate that race in the United States is more of a sociocultural than a biological construct. While most modern-day African Americans are the descendants of people who were brought to the Americas in bondage from sub-Saharan Africa (specifically the present-day countries of Senegal, Gambia, Guinea-Bissou, Mali, Angola, Congo, the Democratic Republic of Congo, Gabon, Ghana, and the Ivory Coast) during the 16th to 19th centuries, some are also the descendants of intermarriages and of White slave masters who sexually misused their female slaves. So many who identify as African Americans today are a biological mixture of Caucasian and African.8 What makes them African American is not their African genes as much as their 400-year shared history of oppression in the United States, including 246 years of slavery in the south and another century of de jure segregation in the rural south and de facto segregation in large U.S. cities like New York, Chicago, Detroit, and Los Angeles, to which many fled between World War I and the 1970s. Even today, the African American community continues to endure discrimination, widespread poverty, high rates of unemployment and incarceration, and permanent underclass status. Obviously, there are general biological distinctions between the Black and White racial groups; however, there is far more biological diversity within than between racial categories. For example, the greater skin content of melanin in African Americans is obviously biological, as is their propensity for sickle cell trait, a genetic hemoglobin mutation which was preserved evolutionarily because of the protection it offers against malaria (which is endemic in their tropical countries of origin). But White persons of Mediterranean descent have more melanin in their skin than those of Nordic descent and also have a propensity for certain genetic hemoglobin disorders like thalassemia. Biological differences among the races loom far larger in the collective imagination than in reality.
To bring this discussion closer to cardiovascular disease, the well-known but poorly understood Black-White disparity in the prevalence of hypertension is probably a complex mixture of biological and sociocultural factors. On the one hand, comparative studies of Black (B) and White (W) Americans showing racial differences in salt retention (B > W), response to diuretics (B > W), and response to ACE inhibitors and beta blockers (W > B) have often been cited as evidence of a biological basis for the higher prevalence of hypertension in Black than White Americans.9 Some have even theorized—with no historical basis—that this may be an evolutionary adaptation to a (non-existent) scarcity of salt in central Africa.10 However, there are also important environmental differences. In the REGARDS study, in which half of the 30,000 participants live in the southeastern “Stroke Belt” states of Georgia, the Carolinas, Alabama, Mississippi, Tennessee, Arkansas, and Louisiana, the leading predictor of hypertension among 12 clinical and social variables examined was their diet; participants with a high “southern diet score”—Black or White—had the highest prevalence of hypertension. Given the high fat and salt content of the traditional southern diet, which southern Blacks carried with them as “soul food” when they migrated northward, this is hardly surprising.11 The fact that hypertension is not especially prevalent in rural sub–Saharan African countries where American slaves originated (but where the diet is quite different) also argues that the high rate of hypertension in African Americans has more to do with diet than biology.12 Another possible environmental source of the Black-White difference in BP is the chronic psychosocial stress associated with poverty and racism, which induces elevated levels of vasoactive hormones like adrenaline.13 The elevated prevalence of hypertension among rural Black migrants to large crowded African cities supports the possible contribution of chronic stress to the high prevalence of hypertension in African Americans.14 A recent genetic analysis of participants in the NHLBI’s SPRINT study showed that West African ancestry was not associated with BP, response to antihypertensive medications, and end organ damage (i.e., heart and kidney failure) after adjustment for behavioral/cultural risk factors like diet and obesity.15 Thus, although the particular causes of the known Black-White differences in BP in America remain somewhat uncertain, environmental factors likely play a more important role than biology.
Socioeconomic Disparities
To a large extent, the health disparities between Black and White Americans reflect the vast socioeconomic gulf between the races in the U.S. Cross-cultural comparisons reinforce this association. Abdel Omran and others have described the “epidemiologic transition” from low-income countries, where life is short and diseases of undernutrition and poor sanitation dominate the leading causes of death, to middle- and high-income countries, where improvements in nutrition and sanitation prolong life-expectancy and where degenerative diseases of overnutrition and underactivity emerge as the leading causes of death (or the cardiovascular disease pandemic, as I have called it).16 The U.S. underwent its epidemiologic transition in the late 19th and early 20th century, before we had systematic surveillance data, but late 20th-century China is a good recent example of this phenomenon. In the 1960s, China suffered several years of widespread famine during Mao’s “Great Leap Forward.”17 As recently as 1983, when I visited China with an American medical group, diseases of undernutrition dominated the leading causes of death, and heart attacks were uncommon. When a man with a myocardial infarction was presented to us on morning rounds in a hospital in Shanghai, he might have been a novelty to the Chinese, but we American doctors had each seen a thousand like him. The average serum cholesterol level in China in the 1980s was only 4.2 mmol/L (162 mg/dL), which corresponds roughly to the bottom decile of American MRFIT screenees a decade earlier.18 Mean cholesterol levels in China would climb to 4.73 mmol/L (183 mg/dL) in 2004—far closer to the U.S. average of 196 mg/dL reported in 2010 by NHANES.19
In the last three decades of the 20th century, America and other affluent countries across the globe have successfully used their science and technology to respond to the epidemiologic transition, as we have recounted in Chapters 4 through 14. But this success was uneven, with the lion’s share of benefit accruing to the highest socioeconomic classes. It is the affluent in the U.S. who have access to the best medical care, to the most healthful food choices, to gym memberships and yoga classes to compensate for their sedentary jobs, and to the education to make the best health-related decisions. So, in the latter decades of the 20th century, the relationship of socioeconomic status to cardiovascular risk factors and deaths became inverted.20 By 1990, as we have seen when comparing Black versus White Americans in Figure 15.1, atherosclerotic coronary heart disease had transitioned from a disease of affluence to just another disease of poverty. Today, coronary heart disease mortality is highest in Russia, the Middle East, northern Africa, and south Asia and lowest in former coronary heart disease epicenters like the U.S., Canada, western Europe, and Australia.21
Racial Disparities in Cardiovascular Risk Factors
The data on racial disparities in risk factors is somewhat scattered; I have been unable to find a comprehensive analysis of changes in risk factors by racial group during a common time frame. However, I have cobbled together Table 15.1, from multiple recent sources. The hypertension figures come from a CDC posting of 2013–16 NHANES data.22 The total and HLD cholesterol figures come from a 2013 NCHS data brief.23 The smoking figures come from a current American Lung Association website.24 The obesity figures come from a 2017 American Heart Association Task Force report.25 The diabetes figures come from the CDS 2020 National Diabetes Statistics Report.26
Table 15.1: Racial Disparities in Cardiovascular Risk Factors in the U.S.
|
Characteristic |
Sex |
Blacks |
Whites |
|
Hypertension, Yes/No |
Men |
42% |
31% |
|
Women |
42% |
27% |
|
|
Cholesterol > 240 mg/dL |
Men |
7% |
12% |
|
Women |
12% |
15% |
|
|
HDL Cholesterol < 40 mg/dL |
Men |
19% |
25% |
|
Women |
8% |
9% |
|
|
Smoking, Yes/No |
Men |
21% |
17% |
|
Women |
14% |
16% |
|
|
BMI > 30 kg/m2 |
Men |
38% |
34% |
|
Women |
58% |
33% |
|
|
Diagnosed Diabetes, Yes/No |
Men |
12% |
8% |
|
Women |
12% |
6% |
*U.S. adults, age >20 years.
Clearly, the cardiovascular risk profiles of Blacks and Whites differ substantially—especially with respect to the higher prevalence of hypertension and diabetes in Blacks of both sexes and the enormous prevalence of obesity in Black women. Rates of awareness and treatment of hypertension among are similar among White and Black men and have improved over time—from 17% to 30% in Black men and from 22% to 39% in White men between 1988–94 and 1999–2004—and are even better among Black women.27 However, the proportion of hypertensive patients whose BP is controlled is significantly lower in Blacks than Whites—a finding that may reflect their lesser responsiveness to ACE inhibitors and beta-blockers. Similarly, in the REGARDS study, awareness and treatment of hypertension were actually higher in Blacks than Whites in all regions, but rates of BP control were lower in Blacks.28 This suggests an issue with finding the right drugs and dosages for Black patients, rather than just a failure to recognize and treat the problem.
The large and growing Black-White disparity in the prevalence of obesity, especially among women, and the resulting disparity in type 2 diabetes is also clearly manifest in Table 15.1. The easy availability of fried foods and fatty snacks from convenience stores and fast-food restaurants and the relative paucity of grocery stores selling fresh produce in urban Black neighborhoods (“food deserts”) have undoubtedly contributed to this disparity.29 Black-White disparities in physical activity may also contribute to the growing disparity in obesity.
Returning to the question raised earlier about the biological underpinning of Black-White racial differences, the data from the international Modeling the Epidemiological Transition Study (METS) are illuminating (Table 15.2).30
Table 15.2: International Differences in Cardiovascular Risk Factors Among Black Populations
|
Characteristic |
Sex |
Ghana |
South Africa |
Jamaica |
Seychelles |
Chicago |
|
UN Human Development Index |
All |
Low-Middle |
Middle |
High |
High |
Very High |
|
BP, mmHg |
Men |
119/68 |
129/80 |
122/71 |
123/75 |
128/81 |
|
Women |
110/66 |
118/76 |
115/72 |
112/73 |
117/80 |
|
|
Hypertension, Yes/No |
Men |
7% |
28% |
12% |
28% |
35% |
|
Women |
7% |
21% |
28% |
17% |
27% |
|
|
LDL Cholesterol, mg/dL |
Men |
92.2 |
82.6 |
94.1 |
112.7 |
112.4 |
|
Women |
103.4 |
98.1 |
105.9 |
109.1 |
107.3 |
|
|
HDL Cholesterol, mg/dL |
Men |
44.7 |
56.7 |
47.1 |
47.4 |
50.1 |
|
Women |
47.2 |
46.2 |
46.1 |
47.9 |
51.7 |
|
|
Smoking, Yes/No |
Men |
4% |
63% |
26% |
25% |
55% |
|
Women |
2% |
33% |
13% |
13% |
42% |
|
|
BMI, kg/m2 |
Men |
22.2 |
22.4 |
23.6 |
26.5 |
29.7 |
|
Women |
25.5 |
31.9 |
29.5 |
27.6 |
34.1 |
|
|
Obesity, Yes/No |
Men |
2% |
6% |
8% |
21% |
35% |
|
Women |
16% |
56% |
46% |
32% |
64% |
|
|
Diabetes, Yes/No |
Men |
1% |
2% |
0% |
7% |
9% |
|
Women |
1% |
3% |
1% |
3% |
13% |
This study compared the cardiovascular risk profiles of Blacks in four countries ranging in wealth on the UN human development index scale from low-middle to high with the U.S. Unfortunately, the METS population was confined to the 25- to 45-year age range and cannot be compared directly to the far broader age range in Table 15.1. However, it is clear that the prevalence of hypertension, obesity, and diabetes among U.S. Blacks is far higher than among the non–American Black populations, particular those from Ghana, one of the countries from which American slaves originated. Indeed, the Black-Black differences between Chicago and Ghana (Table 15.2) are far larger than the Black-White differences among Americans (Table 15.1).
In addition to the Black-White disparities in risk factors, there is also evidence that African Americans who have had a heart attack—especially without electrocardiographic ST segment elevation (non–STEMI)—are less likely than White Americans to receive the recommended treatments.31 Hospitalized Black non–STEMI patients were less likely than their White counterparts to receive aspirin (85% versus 92%), other antiplatelet therapy (45% versus 60%), beta-blockers (85% versus 88%), and cholesterol-lowering medications (68% versus 76%). Blacks were also 29% less likely than Whites to undergo coronary angiography and 45% less likely to undergo revascularization. This racial disparity represents more than just the reduced access to the health care system associated with poverty. After all, nearly all the patients studied had health insurance, and all had made it into the hospital. A recent study of attitudes and beliefs of trained medical personnel about how Blacks and Whites experience pain suggests a more insidious explanation—a tendency of health care providers to downplay the pain of Black patients.32 This would be bad enough if it were manifested only in withholding pain medications, but in the context of non–STEMI, where chest pain is a critical factor in the diagnosis and the efficacy of potentially life-saving treatments depends upon their rapid delivery, it is entirely unacceptable. The denial of proven treatments to the least favored segment of our population echoes the crime of the infamous Tuskegee study, which has left an enduring residue of mistrust of the medical establishment among African Americans. Whatever else is going on around us, medical caregivers must work diligently to restore this trust rather than allow their racial biases to further erode it.
The Impact of Racial Disparities on the Decline in Heart Attack Mortality
The impact of racial disparities is complicated because so many risk factors and because so many racial and ethnic groups are involved. Health disparities affect many groups not discussed here—American Indians, Hispanics, South and East Asians, Appalachian Whites, etc.—each with its own story. Focusing on Black-White health disparities has allowed me to develop some of the driving factors in greater depth, but I have still barely scratched the surface. From 1968 (when heart attack rates were 15% lower in Blacks than Whites) through 2007 we saw a reversal of race-specific heart attack death rates over the rest of the 20th century and into the 21st century (Figure 15.1–2). As of 2017, heart attack mortality is 12% higher in Blacks than Whites, while overall heart disease mortality is 23% higher in Blacks than Whites. Since Black-White differences in BP (favors Whites), HDL and LDL cholesterol (favor Blacks), and cigarette smoking (similar in Blacks and Whites) have not really changed much during this period, the growing prevalence of obesity and type 2 diabetes in Blacks and racial biases in the delivery of effective heart attack treatments that have come on the scene since 1980 are the most likely culprits for the observed Black-White difference in the decline in mortality rates. If we ask simplistically, how many more heart attack deaths could have been prevented if we had achieved the same (73%) mortality reduction in Blacks that we achieved in Whites between 1980 and 2017, the answer is only about an extra 1%, since African Americans comprised only 12–14% of the U.S. population during this period.33 One could perhaps double this estimate by also considering the other racial groups who have lacked equal access to optimal health care, but all this is beside the point. All U.S. taxpayers have invested in the research that has advanced our understanding of cardiovascular disease and led to new and better treatments; all of us own the fruits of this investment. That all should share in its benefits is a matter not of numbers but of simple equity and justice.
1. Centers for Disease Control and Prevention. U.S. Public Health Service Syphilis Study at Tuskegee. Timeline. Accessed August 2020, at https://www.cdc.gov/tuskegee/timeline.htm.
E Nix. Tuskegee Experiment: the infamous syphilis study. History.com. Updated July 29, 2019. https://www.history.com/news/the-infamous-40-year-tuskegee-study/.
2. SO Sodeke, LR Powell. Paying Tribute to Henrietta Lacks at Tuskegee University and at The Virginia Henrietta Lacks Commission, Richmond, Virginia. J Health Care Poor Underserved 2019; 30(4s):1–11.
3. Morbidity and Mortality. 2012 Chartbook on Cardiovascular, Lung and Blood Diseases, NIH-NHLBI. Chart 3–24. https://www.nhlbi.nih.gov/files/docs/research/2012_ChartBook_508.pdf.
Centers for Disease Control. Age-adjusted death rates for 69 selected causes by race and sex using year 2000 standard population: United States, 1950–59. https://www.cdc.gov/nchs/data/dvs/hist293_1950_59.pdf, 1960–67. https://www.cdc.gov/nchs/data/mortab/aadr6067.pdf, 1968–78. https://www.cdc.gov/nchs/data/mortab/aadr6878.pdf.
Centers for Disease Control and Prevention (CDC), National Center of Health Statistics. Mortality Data Finder. Table 5: Age-adjusted death rates for selected causes of death by sex, race and Hispanic origin: United States, selected years 1950–2017, https://www.cdc.gov/nchs/hus/contents2018.htm#Table_005 (Excel spreadsheet link).
4. Proceedings of the Conference on the Decline in Coronary Heart Disease Mortality: National Heart, Lung, and Blood Institute, National Institute of Health, Bethesda, Maryland. NIH publication no. 79–1610, 1978. Bethesda, MD: National Heart, Lung, and Blood Institute, NIH, 1979. Oct 24–25. Chartbook for the Conference on the Decline in Coronary Heart Disease Mortality. Hyattsville, MD: NCHS, 1978. National Center for Health Statistics. Factors Obscuring the Downturn in IHD Mortality (p. 17) and Comparability of Mortality Statistics for Diseases of the Heart (Appendix II).
5. Centers for Disease Control and Prevention. Heart disease death rates among blacks and whites, aged > 35 years—United States, 1968–2015. Morbidity and Mortality Weekly Report. Surveillance Summaries 2018, 30 March; 67(5):1–11. https://www.cdc.gov/mmwr/volumes/67/ss/ss6705a1.htm.
6. Morbidity and Mortality. 2012 Chartbook on Cardiovascular, Lung and Blood Diseases, NIH-NHLBI. Chart 3–26. https://www.nhlbi.nih.gov/files/docs/research/2012_ChartBook_508.pdf.
7. MW Lewis, Y Khodneva, N Redmond, RW Durant, LL Wilkinson, VJ Howard, MM Safford. The impact of the combination of income and education on the incidence of coronary heart disease in the prospective Reasons for Geographic and Racial Differences in Stroke (REGARDS) cohort study. BMC Public Health 2015; 15:1312–1321. DOI 10.1186/s12889–015–2630–4.
8. S Pruitt. What part of Africa did most slaves come from? History.com. Updated June 19, 2019. https://www.history.com/news/what-part-of-africa-did-most-slaves-come-from?.
9. DT Lackland. Racial differences in hypertension: implications for high blood pressure management. Am J Med Sci 2014; 348:135–138. doi:10.1097/MAJ.0000000000000308.
J Lindhorst, N Alexander, J Blignaut, B Rayner. Differences in hypertension between blacks and whites: an overview. Cardiovasc J Afr 2007; 18:241–247.
10. PD Curtin. The slavery hypothesis for hypertension among African Americans: The historical evidence. Am J Publ Health 1992; 82:1681–1686.
11. G Howard, M Cushman, CS Moy, S Oparil, P Muntner, DT Lackland, JJ Manly, ML Flaherty, SE Judd, VG Wadley, DL Long, VJ Howard. Association of clinical and social factors with excess hypertension risk in black compared with white U.S. adults. JAMA 2018; 320:1338–1348. doi:10.1001/jama.2018.13467.
12. J Addo, L Smeeth, DA Leon. Hypertension in sub-Saharan Africa: a systematic review. Hypertension 2007; 50:1012–1018.
13. TM Sprull. Chronic psychosocial stress and hypertension. Curr Hypertens Rep 2010; 12:10–16. doi:10.1007/s11906–009–0084–8.
14. J Addo, et al.
15. S Rao, MW Segar, AP Bress, W Vongpatanasin, V Agusala, UR Essien, A Correa, AA Morris, JA de Lemos, A Pandey. Association of genetic West African ancestry, blood pressure response to therapy, and cardiovascular risk among self-reported black individuals in the Systolic Blood Pressure Reduction Intervention Trial (SPRINT). JAMA Cardiology, published online November 13, 2020. Doi.10.1001/jamacardio.2020.6566. https://jamanetwork.com/journals/jamacardiology/fullarticle/10.1001/jamacardio.2020.6566?guestAccessKey=bef18712-8884-479c-9d99-024845d9c461&utm_source=silverchair&utm_medium=email&utm_campaign=article_alert-jamacardiology &utm_content=olf&utm_term=111320.
16. AR Omran. The epidemiologic transition: a theory of the epidemiology of population change. 1971. Milbank Q 2005; 83(4):731–757. TA Gaziano, A Bitton, S Anand, S Abrahams-Gessel, A Murphy. Growing epidemic of coronary heart disease in low- and middle-income countries. Curr Probl Cardiol 2010; 35:72–115.
World Health Organization 2009. Global Health Risks. Mortality and burden of disease attributable to selected major risks. ISBN 978 92 4 56387 1. https://www.who.int/healthinfo/global_burden_disease/GlobalHealthRisks_report_full.pdf.
17. V Smil. China’s great famine: 40 years later. BMJ 1999; 319:1619–1621.
18. Z Chen, R Peto, R Collins, S MacMahon, J Lu, W Li. Serum cholesterol concentration and coronary heart disease In population with low cholesterol concentrations. BMJ 1991; 303:276–282.
MJ Martin, SB Hulley, WS Browner, LH Kuller, D Wentworth. Serum cholesterol, blood pressure, and mortality: implications from a cohort of 361,662 men. Lancet 1986, Oct; 933–936.
19. J He, D Gu, K Reynolds, X Wu, P Muntner, J Zhao, J Chen, D Liu, J Mo, PK Whelton, InterASIA Collaborative Group. Serum total and lipoprotein cholesterol levels and awareness, treatment, and control of hypercholesterolemia in China. Circulation 2004; 110: 405–411. DOI: 10.1161/01.CIR.0000136583.52681.0D.
MD Carroll, AK Kit, DA Lacher, ST Shero, ME Mussolino. Trends in lipids and lipoproteins of U.S. adults, 1988–2010. JAMA 2012; 308:1545–1554.
20. MA Gonzalez, FR Artalejo, J Calero. Relationship between socioeconomic status and ischaemic heart disease in cohort and case-control studies: 1960–1993. Int J Epidemiol 1998; 27:350–358.
21. World Health Rankings. Live Longer Live Better. https://www.world lifeexpectancy.com/cause-of-death/coro nary-heart-disease/by-country/.
22. Centers for Disease Control. Online Table 22. Hypertension among adults aged 20 and over by selected characteristics. United States, selected years 1988–1994 through 2013–2016. https://www.cdc.gov/nchs/data/hus/2018/022.pdf.
23. MD Carroll, BK Kit, DA Lacher, SS Yoon. Total and high-density lipoprotein cholesterol in adults: National Health and Nutrition Exam Survey 2011–12. Figures 3, 4. https://www.cdc.gov/nchs/data/databriefs/db132.pdf.
24. American Lung Association. Tobacco Use in Racial and Ethnic Populations. https://www.lung.org/quit-smoking/smoking-facts/impact-of-tobacco-use/tobacco-use-racial-and-ethnic.
25. MR Carnethon, J Pu, G Howard, MA Albert, CAM Anderson, AG Bertoni, MS Mujahid, L Palaniappan, HA Taylor, M Willis, CW Yancy, on behalf of the American Heart Association Council on Epidemiology and Prevention; Council on Cardiovascular Disease in the Young, Council on Cardiovascular Nursing, Council on Clinical Cardiology, Council on Functional Genomics and Translational Biology, and Stroke Council. Cardiovascular Health in African Americans. A scientific statement from the American Heart Association. Endorsed by the American College of Cardiology. Circulation 2017; 136:e393-e403. DOI: 10.1161/CIR.0000000000000534.
26. Centers for Disease Control and Prevention. National Diabetes Statistical Report 2020. Figure 2. Estimates of Diabetes and its Burden in the United States. https://www.cdc.gov/diabetes/pdfs/data/statistics/national-diabetes-statistics-report.pdf.
27. Centers for Disease Control and Prevention. A Closer Look at African American Men and High Blood Pressure Control: A Review of Psychosocial Factors and Systems-Level Interventions. Atlanta: U.S. Department of Health and Human Services, 2010.
28. G Howard, R Prineas, C Moy, M Cushman, M Kellum, E Temple, A Graham, V Howard. Racial and geographic differences in awareness treatment, and control of hypertension. Reasons for Geographic and Racial Differences in Stroke study. Stroke 2006; 37:1171–1178.
29. J Crowe, C Lacy, Y Columbus. Barriers to food security and community stress in an urban food desert. Urban Science 2018; 2:45–61. doi:10.3390/urbansci2020046.
30. LR Dugas, TE Forrester, J Plange-Rhule, P Bovet, EV Lambert, RA Durazo-Arvizu, G Cao, RS Cooper, R Khatib, L Tonino, W Riesen, W Korte, S Kliethermes, A Luke. Cardiovascular risk status of Afro-origin populations across the spectrum of economic development: findings from the Modeling the Epidemiologic Transition Study. BMC Public Health 2017; 17(1):438.
31. S Arora, GA Stouffer, A Kucharska-Newton, M Vaduganathan, K Matsuhita, D Kolte, HR Reynolds, S Bangilore, DL Bhatt, MC Caughey. Fifteen-year trends in management and outcomes of non-ST-segment elevation myocardial infarction among black and white patients: the ARIC Community Survey 2000–2014. J Am Heart Assoc 2018; 7:e010203. DOI: 10.1161/JAHA.118.010203.
32. KM Hoffman, S Trawalter, JR Axt, MN Oliver. Racial bias in pain assessment and treatment recommendations, and false beliefs about differences between blacks and whites. Proc Nat Acad Sci 2016; 113: 4296–4301. www.pnas.org/cgi/doi/10.1073/pnas.1516047113.
33. Health, United States. 2012 Updates. https://www.cdc.gov/nchs/data/hus/2012/001.pdf.