
Sector overview
Definition
Here is the GICS® definition by MSCI and Standard & Poor’s:
The Information Technology Sector comprises companies that offer software and information technology services, manufacturers and distributors of technology hardware & equipment such as communications equipment, cellular phones, computers & peripherals, electronic equipment and related instruments and semiconductors.
Companies
This sector contains 65 companies in the S&P 500 and 321 in the Russell 2000. Here is the list of the 10 largest capitalisations at the time of writing, arranged in alphabetical order by ticker:
Table 10.1: Stock examples: S&P 500 Information Technology

S&P 500 strategy
Individually relevant factors
Here are the factors from my working list that are individually relevant for the S&P 500 Information Technology reference set:
Table 10.2: Individually relevant factors: S&P 500 Information Technology

Strategy description
I will use two valuation ratios. One is individually relevant, the other is not.
Table 10.3: Strategy description: S&P 500 Information Technology

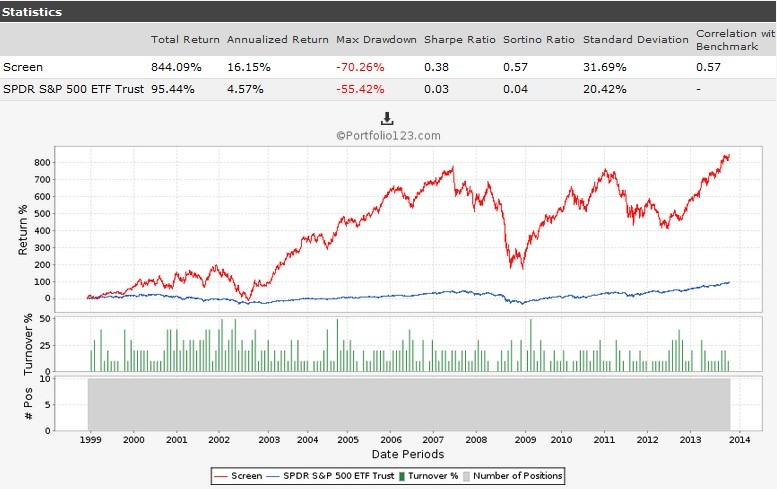
Rationalised interpretation: this strategy selects companies that are cheap regarding first their accounting value and second their earnings.
Basic simulation
Fig 10.1: Simulation data and equity curve: S&P 500 Information Technology
Hedged simulation
Fig 10.2: Simulation data and equity curve: S&P 500 Information Technology, Hedged

Consistency
Annualised returns with hedging by five-year periods:
Table 10.4: Consistency over five-year periods

Comment
Even in its hedged version, this strategy incurs a high risk in terms of drawdowns and volatility. Five-year annualised returns are irregular. Differences are even larger on a yearly basis.
Russell 2000 strategy
Individually relevant factors
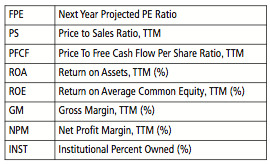
Here are the factors from my working list that are individually relevant for the Russell 2000 Information Technology reference set:
Table 10.5: Individually relevant factors: Russell 2000 Information Technology
Strategy description
I will use a factor on profitability and another one on valuation.
Table 10.6: Strategy description: Russell 2000 Information Technology
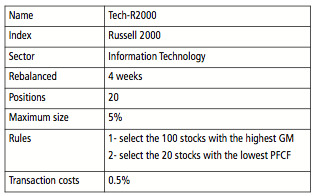
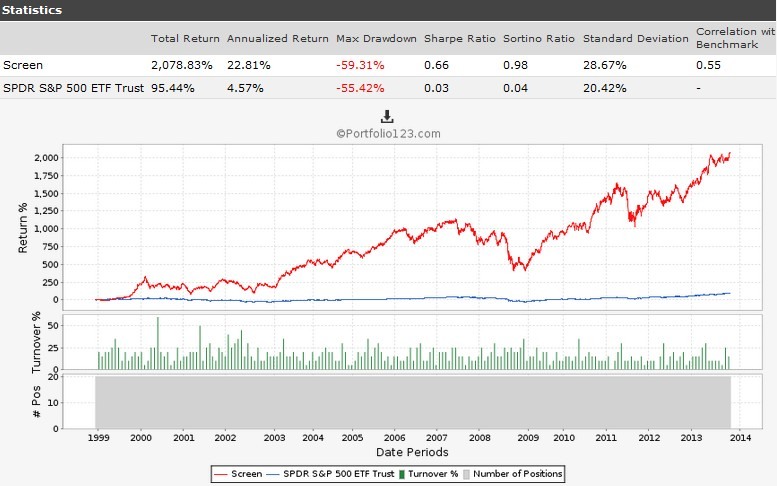
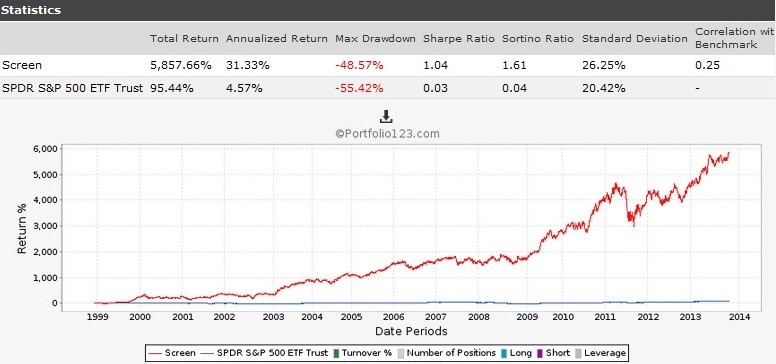
Rationalised interpretation: this strategy selects companies that are cheap relative to their cash flow, among those that have the best gross margin. Because of the reference to margin and cash flow, it excludes pure development-stage companies. In the following simulation, you can see that it would have resisted very well the dot-com crash (2000–2002) by avoiding weak business models. It should also help in case history repeats itself.
Basic simulation
Fig 10.3: Simulation data and equity curve: Russell 2000 Information Technology
Hedged simulation
Fig 10.4: Simulation data and equity curve: Russell 2000 Information Technology, Hedged
Consistency
Annualised returns with hedging by five-year periods:
Table 10.7: Consistency over five-year periods

Comment
Like Financials, in the IT sector small is beautiful. The Russell 2000 portfolio is safer and more rewarding than the S&P 500 portfolio. Like for large caps, it is very irregular in annualised return.