
Sector overview
Definition
Here is the GICS® definition by MSCI and Standard & Poor’s:
The Industrials Sector includes manufacturers and distributors of capital goods such as aerospace & defense, building products, electrical equipment and machinery and companies that offer construction & engineering services. It also includes providers of commercial & professional services including printing, environmental and facilities services, office services & supplies, security & alarm services, human resource & employment services, research & consulting services. It also includes companies that provide transportation services.
Companies
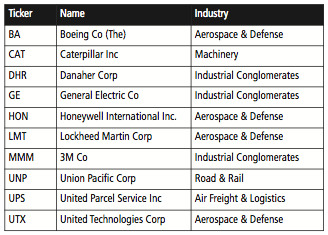
This sector contains 64 companies in the S&P 500 and 251 in the Russell 2000. Here is the list of the 10 largest capitalisations at the time of writing, arranged in alphabetical order by ticker:
Table 9.1: Stock examples: S&P 500 Industrials
S&P 500 strategy
Individually relevant factors
Here are the factors from my working list that are individually relevant for the S&P 500 Industrials reference set:
Table 9.2: Individually relevant factors: S&P 500 Industrials

Strategy description
This strategy uses a single valuation ratio.
Table 9.3: Strategy description: S&P 500 Industrials
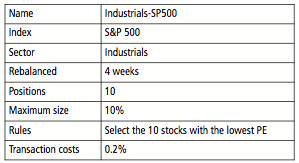
The rationalised interpretation is to select companies that are cheap relative to their earnings.
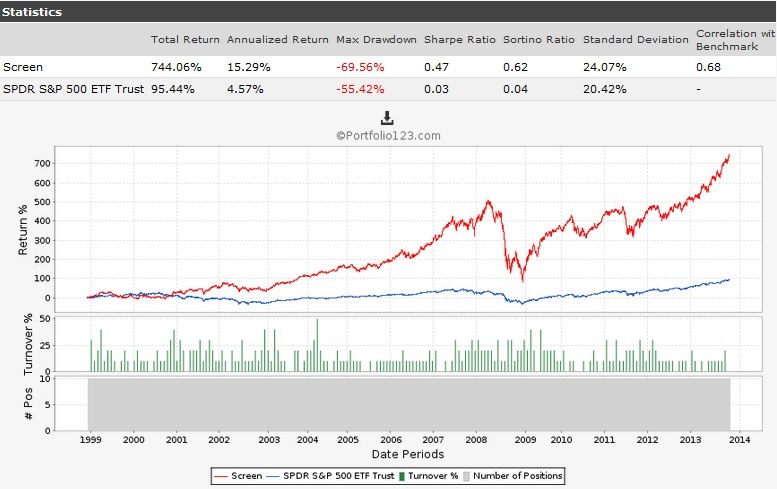
Basic simulation
Fig 9.1: Simulation data and equity curve: S&P 500 Industrials
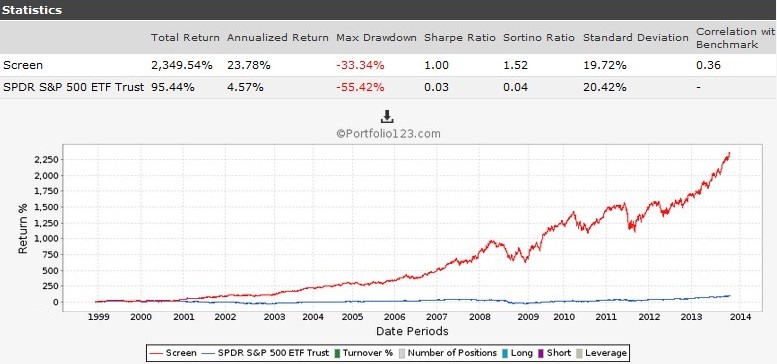
Hedged simulation
Fig 9.2: Simulation data and equity curve: S&P 500 Industrials, Hedged
Consistency
Annualised returns with hedging by five-year periods:
Table 9.4: Consistency over five-year periods

Comment
Hedging brings to Industrials-SP500 good Sharpe and Sortino ratios, especially for a strategy in a cyclical sector. The five-year annualised returns are impressively stable, hiding a bumpy ride in 2008, 2010 and 2011.
Russell 2000 Strategy
Individually relevant factors
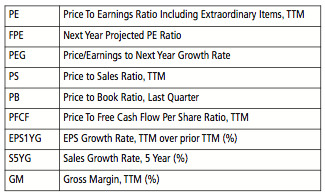
Here are the factors from my working list that are individually relevant for the Russell 2000 Industrials reference set:
Table 9.5: Individually relevant factors: Russell 2000 Industrials
Strategy description
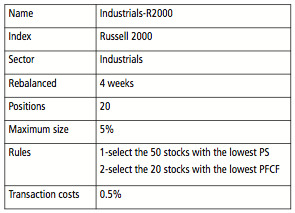
The next strategy uses two valuation ratios. The strategy description is shown in Table 9.6.
The rationalised interpretation is to select companies that are cheap relative to their sales and free cash flow.
Table 9.6: Strategy description: Russell 2000 Industrials
Basic simulation
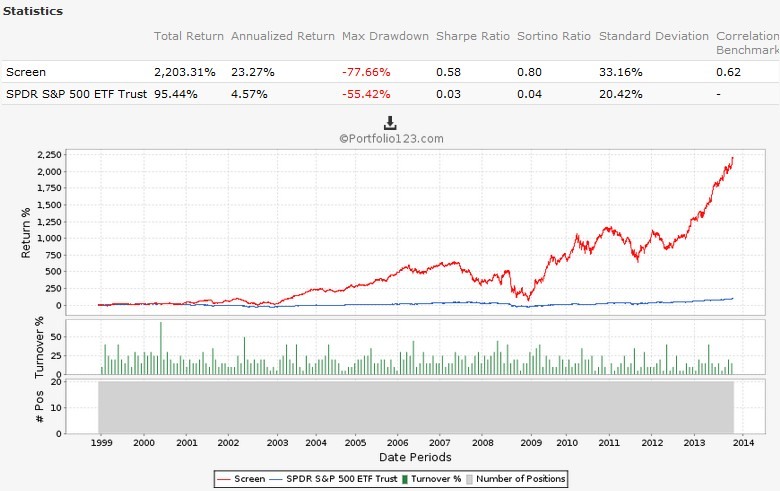
Fig 9.3: Simulation data and equity curve: Russell 2000 Industrials
Hedged simulation
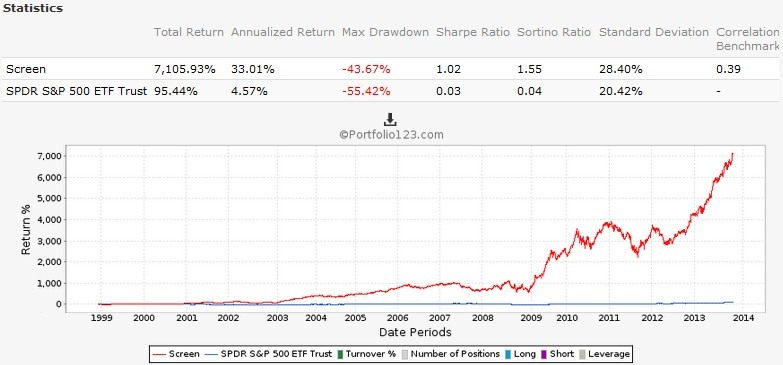
Fig 9.4: Simulation data and equity curve: Russell 2000 Industrials
Consistency
Annualised returns with hedging by five-year periods:
Table 9.7: Consistency over five-year periods

Comment
In Industrials, the small cap strategy gives a significantly better performance than the large caps. It may be worth taking the additional liquidity risk for this better performance. All five-year annualised returns are above 20%, with a surge above 50% on the last period.