
How to protect a stock portfolio from market downturns is not the core of this book. However, I think it would not be complete without addressing the subject. This chapter proposes a protection tactic. In Part II, every strategy will be simulated first unprotected, then adding this tactic.
Market timing
Market timing involves anticipating trends. It is a science and an art in which many indicators may be used: price moving averages, put/call ratios of options, sentiment surveys, etc.
Indicators are used to determine if the market is likely to go up (bullish signal), or down (bearish signal). Some methods are better than others, but there is no perfect one, they all give erroneous signals from time to time. They are supposed to work statistically over the long term. I propose to combine two indicators.
1. EPS Estimate Momentum
My first indicator “EPS Estimate Momentum” is an aggregate fundamental ratio over the S&P 500 Index. It gives a bearish signal when the S&P 500 current year EPS estimate is below its own value three months previously, and a bullish signal when it is above this value. This data is provided in various data feeds and tools, among them Portfolio123. It is generally updated once a week. It is an indicator of what is anticipated for the real economy until the end of the current year.
2. Unemployment Momentum
The second indicator “Unemployment Momentum” is macroeconomic. It gives a bearish signal when the US unemployment rate is above its own value three months ago, and a bullish signal when it is below this value. The US unemployment rate is published once a month, usually in the first half of the month for the previous month. It is widely broadcasted on financial and news websites. Unemployment is a powerful indicator because it is at the same time a barometer of activity in the real economy and an anticipation of overall sentiment.
Combining the two indicators
Table 3.1 compares the performance of a portfolio that is long the S&P 500 Index:
The rest of the time, it is in cash. Timing indicators are checked every four weeks and the period studied is Feb 1999 to Jan 2014. Dividends are included.
Table 3.1: Market timing performances
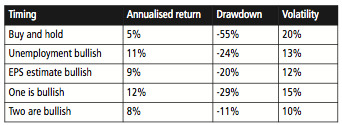
The best return is obtained with the “optimistic” combination (one indicator bullish at least). The lowest risk in terms of volatility and drawdown is the “pessimistic” combination (both indicators bullish). Starting from here, I will always apply the optimistic combination.
From market timing to hedging
The best known use of market timing is to sell a portfolio and go to cash every time a bearish signal occurs, and buy again on the next bullish signal. It has four main drawbacks:
Hedging can be a better alternative. The proposition is to take a short position in the S&P 500 when my two indicators are bearish. This is supposed to offset part, or all, of the loss on the equity portfolio in a market downturn. But there is an inconvenience: buying a hedge needs either to reduce the stock holdings, or to use margin. The first case implies a potential loss in performance, the second one an additional borrowing cost.
Sophisticated investors usually hedge with futures contracts and options. Hedging with futures is not possible for any portfolio size, and managing options needs time and skill. For individual investors, ETFs are the simplest solution. All hedged simulations hereafter use a short position in SPY sized at 100% of the stock holdings value, and a 2% annual carry cost.
You can also consider buying an inverse ETF like SH (ProShares Short S&P 500 ETF). And you may prefer hedging small cap strategies with the Russell 2000. I make the choice of the S&P 500 for all strategies to keep things simple. It also works better over the period of study.
In Appendix 1 you can find additional information on hedging with leveraged ETFs.
Part I summary
The second part will explore the US stock market sector by sector, list for each sector the most relevant fundamental factors, describe strategies and show their simulated performance on 15 years of historical data.