
CHAPTER 10
I don’t know whether, to what extent you can attribute anything to anything….
Alan Greenspan, in a conversation with the author on January 18, 2017
One of the most extraordinary failures of the economics profession in the twenty-first century has been its inability to understand that foreign central banks have played a leading role in destabilizing the US economy by injecting trillions of dollars of central bank credit into the United States during recent decades. By 2007, foreign central banks had financed approximately 8% of all US debt and had injected nearly six times more credit into the United States than the Fed had.
The surge in foreign central bank money into the United States after 1997 was a major contributing factor in the creation of the NASDAQ bubble in 1999. The even larger inflows between 2004 and 2007 caused the Fed to lose control over US interest rates and made it impossible for the US central bank to prevent the property bubble that wreaked havoc around the world when it imploded in 2008. This chapter describes credit creation by foreign central banks and the extraordinary impact that that credit has had on the United States.
The Financial Sector Is Not Alone
The financial sector is not alone in providing credit to American borrowers. The non-financial sector and the “rest of the world” are also credit providers. Chart 10.1 shows that while by 2007 the financial sector had extended $38 trillion of credit, the rest of the world had extended an additional $7.3 trillion (up from just $3 billion in 1945) and the non-financial sector had extended $7.1 trillion (up from only $127 billion in 1945).
Chart 10.2 shows the credit extended by each of these sectors as a percentage of GDP. The surge in the financial sector's credit, which was discussed in the previous chapter, is the most striking. It leapt from 102% of GDP in 1945 to 263% in 2007. The non-financial sector is the least interesting. Relative to GDP, the credit provided by that sector changed little, moving only from 56% of GDP in 1945 to 49% in 2007. The change in the amount of credit provided by the rest of the world is noteworthy, however. It increased from 1% of GDP in 1945 to 50% of GDP by 2007, and accounted for 14% of all credit in the United States that year. The following paragraphs will show that of the $7.3 trillion of credit extended to the United States by the rest of the world, approximately $4.3 trillion or 60% of that credit was extended by foreign central banks.
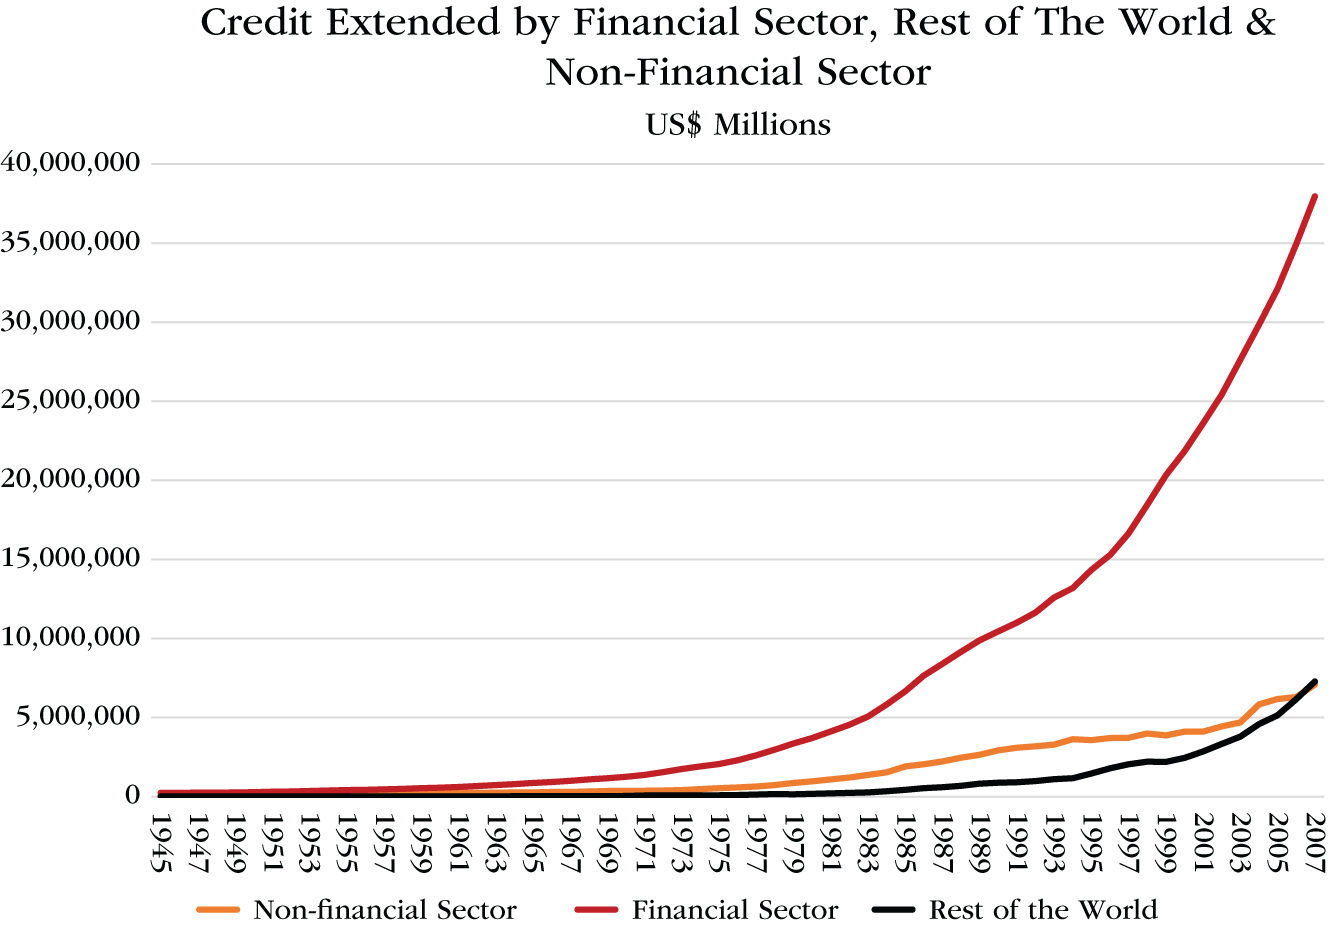
CHART 10.1 Credit Extended by Financial Sector, Rest of the World, & Non-financial Sector, 1945 to 2007
Source: Data from the Financial Accounts of the United States, 1945–2007, The Fed
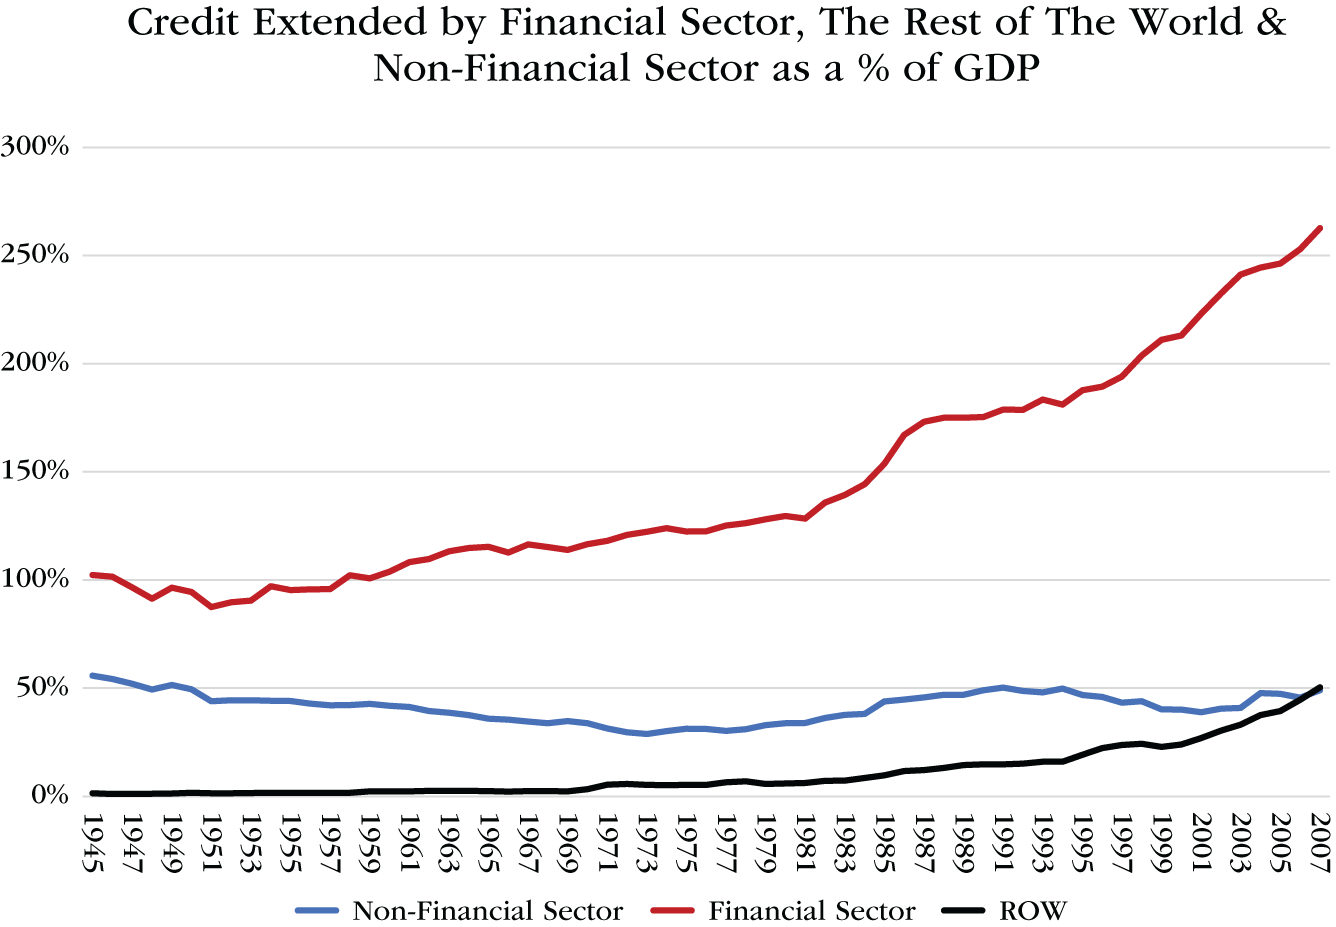
CHART 10.2 Credit Extended by Financial Sector, the Rest of the World, & Non-financial Sector as a Percentage of GDP, 1945 to 2007
Source: Data from the Financial Accounts of the United States, 1945–2007, The Fed
The substantial increase in credit injected into the US economy from abroad had a powerful influence on the US economy and financial markets. That is the subject of this chapter. First, however, let's look quickly at the details of lending by the non-financial sector.
The creditors from the domestic non-financial sector are households, state and local governments, the federal government, non-financial corporations and non-corporate businesses. Chart 10.3 shows the amount of credit they extended relative to GDP between 1945 and 2007. As developments here were not particularly interesting, no more will be written about the credit provided by the non-financial sector.

CHART 10.3 The Non-financial Sector Creditors as a Percentage of GDP, 1945 to 2007
Source: Data from the Financial Accounts of the United States, 1945–2007, The Fed
The Rest of the World
The emergence of “the rest of the world” as a major source of credit to American borrowers, on the other hand, powerfully influenced the evolution of the US economy during the years following the breakdown of the Bretton Woods system. In fact, foreign credit played a leading part in inflating the NASDAQ bubble in the late 1990s and ultimately caused the Fed to lose control over US interest rates and, therefore, over the US economy during the years leading up to the crisis of 2008.
The rest of this chapter will show that the majority of the credit entering the United States from abroad between 1970 and 2007 was created by foreign central banks. It will show that foreign central banks created the equivalent of trillions of dollars, used that new money to acquire US dollars in order to hold down the value of their own currencies and then invested those dollars into dollar-denominated assets. It is impossible to understand the history of the US economy or the global economy during recent decades without understanding the impact produced by the credit created by central banks outside the United States. This story, like so many others in this book, becomes most interesting when money ceased to be backed by gold.
Trade Deficits and Capital Flows
When the Bretton Woods system collapsed in 1971, all currencies ceased to be backed by gold, not only the US dollar. Thereafter, every central bank was free to create as much of its own currency as it pleased, just as the Fed was free to create as many dollars as it pleased. Not surprisingly, inflation rose sharply in the United States and globally during the 1970s. What did come as a surprise, however, is that trade between nations ceased to balance. Most strikingly, the United States, by far the world's largest economy, began running large and persistent trade deficits from the early 1980s. Even more astonishingly, the central banks of the trade surplus countries began creating money and lending it to the United States so that the US could continue buying goods from their countries. The following paragraphs explain how that process worked.
Chart 10.4 shows that the US Current Account was more or less in balance between 1950 up until the breakdown of Bretton Woods system in the early 1970s. Then this began to change. The truly radical break from the past only began during the early 1980s, however, when the US began running very large trade deficits for the first time. By 1987, the US Current Account deficit had reached 3.3% of US GDP. By 2006, it had grown to 6% of US GDP or to more than $800 billion. These were trade deficits on a scale the world had never before encountered.

CHART 10.4 US Current Account Balance, 1950 to 2007
Source: Data from US Current Account Balance 1950–2007, St Louis Fed
The Balance of Payments
Every country's balance of payments must balance, just as every family's accounts must balance. If a family spends more than it earns, it must make up the difference either by borrowing or by selling things to cover the shortfall. Similarly, when a country runs a current account deficit, it must borrow from abroad or sell its assets to foreign investors. Such transactions appear as a surplus on the country's Financial and Capital Accounts.
Chart 10.5 shows that the surplus on the US Financial and Capital Accounts is the mirror image of the US Current Account deficit. In other words, the capital inflows into the United States reflected on the Financial and Capital Accounts finance the country's Current Account deficit.
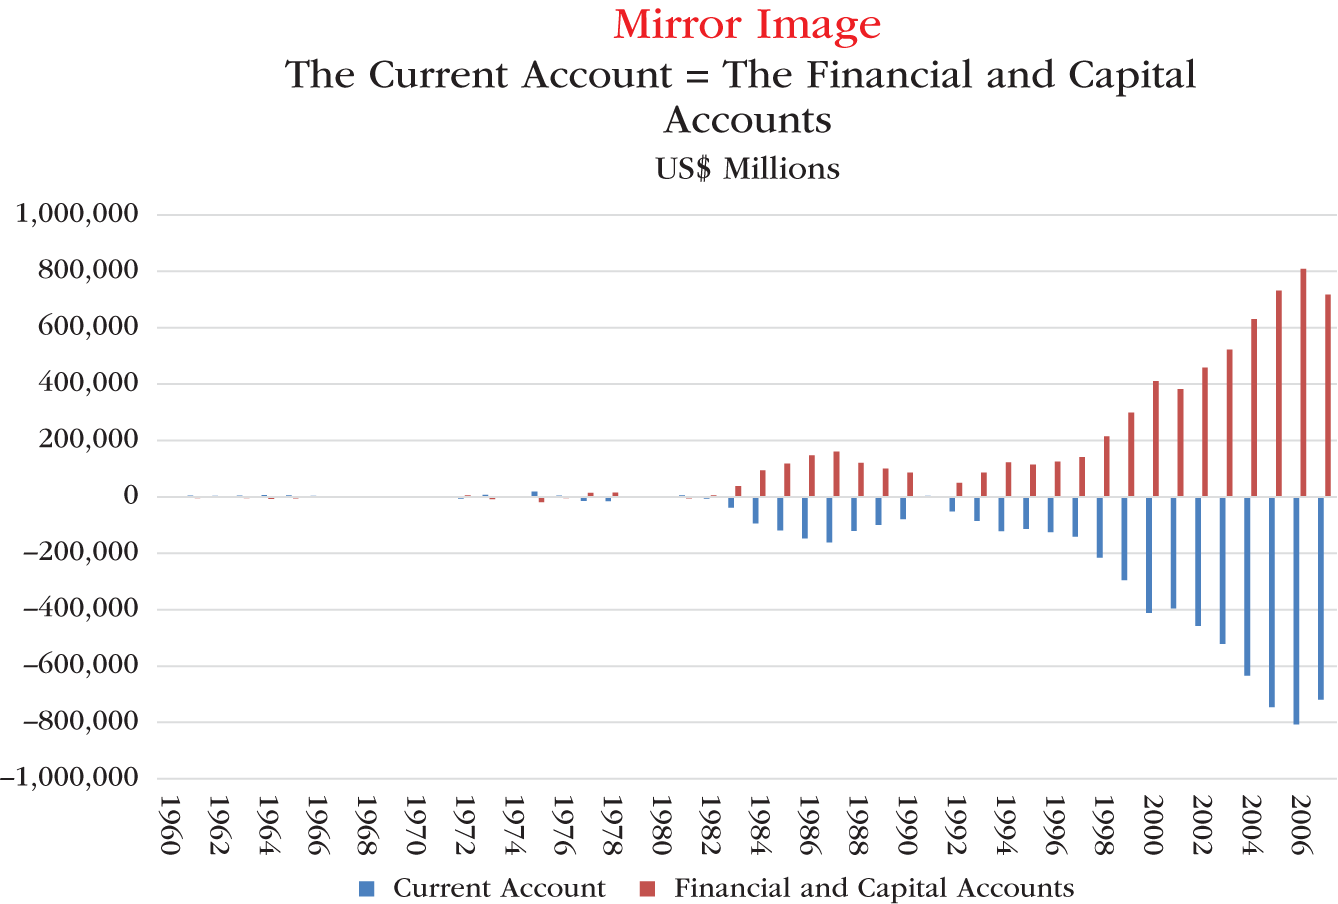
CHART 10.5 Mirror Image: The US Current Account = The Financial Account and the Capital Account, 1960 to 2007
Source: Data from U.S. International Trade in Goods and Service, U.S. Bureau of Economic Analysis
The cumulative Current Account deficit for the United States from 1970 to 2007 amounted to $6.5 trillion, as shown in Chart 10.6. The cumulative surplus on its Financial and Capital Accounts combined also amounted to $6.5 trillion.
Had the Bretton Woods system lasted, it would not have been possible for other countries to provide $6.5 trillion in capital to finance the US Current Account deficit during those years. The rest of the world did not have $6.5 trillion worth of gold, far from it. After only a few years of lending money to the United States, the countries in the rest of the world would have run out of gold. That would have made it impossible for the US Current Account deficit to persist.

CHART 10.6 The Cumulative US Current Account Deficit, 1950 to 2007
Source: Data from Cumulative US Current Account Deficit from 1950 to 2007, U.S.Bureau Of Economic Analysis
But the Bretton Woods system had fallen apart in 1971. Countries and central banks were no longer constrained by the amount of gold they owned. The rules of the game had changed completely. Other countries were able to lend the United States $6.5 trillion between 1970 and 2007 because their central banks were free to create as much money as they desired; and they chose to create enough new money to finance the United States' enormous trade deficit.
This can be seen by the growth in the total foreign exchange reserves of the world, which reflects how much money central banks created for the purpose of acquiring the currencies of other countries. Chart 10.7 shows the total amount of foreign exchange reserves held by all the world's central banks from 1950 to 2007.

CHART 10.7 Total Foreign Exchange Reserves, 1950 to 2007
Source: Data from the International Monetary Fund, Total Foreign Exchange Reserves: 1950 to 2007
When a central bank acquires the currency of another country, it is classified as foreign exchange reserves on the asset side of that central bank's balance sheet. Central banks acquire the currencies of other countries by creating money, just as the Fed acquires US government securities by creating money. Therefore, the total level of foreign exchange reserves in the world reveals how much money has been created for the purpose of acquiring the currencies of other countries. As shown in Chart 10.7, by 2007 central banks had created the equivalent of $6.1 trillion for this purpose, whereas in 1970, the year before the Bretton Woods system broke down, total foreign exchange reserves amounted to only $56 billion. Of course, only the Fed can create dollars. The other central banks can only create their own currencies. But once other central banks have created their own currencies, they can use that currency to buy the currencies of other countries; and the currency they acquire in most cases is the US dollar.1
The US Current Account deficit sends dollars to the countries that have a current account surplus with the United States. That is because the foreign companies that sell their goods in the United States are paid in dollars. Those companies take the dollars they earn back home and convert them into their own currency. This process would push up the value of the currencies of all the trade surplus countries if left to market forces. To prevent that, the central banks of many of the trade surplus countries buy most of the dollars entering their countries. The amounts are very large, in total, roughly the same size as the entire US Current Account deficit. Nevertheless, the central banks of the trade surplus countries can afford to buy all the dollars entering their countries because they can create all the money they need to do so.
Chart 10.8 shows that total foreign exchange reserves have risen more or less in line with the cumulative US Current Account deficit. That is because the central banks of the trade surplus countries financed the US Current Account deficit by creating money, buying US dollars and then investing those dollars into US dollar-denominated assets, preferably US government securities. Had they not financed the US Current Account deficit in this way, that deficit could not have persisted. In that case, the United States would have had to buy less from the rest of the world and the economy of the rest of the world would have grown much more slowly.
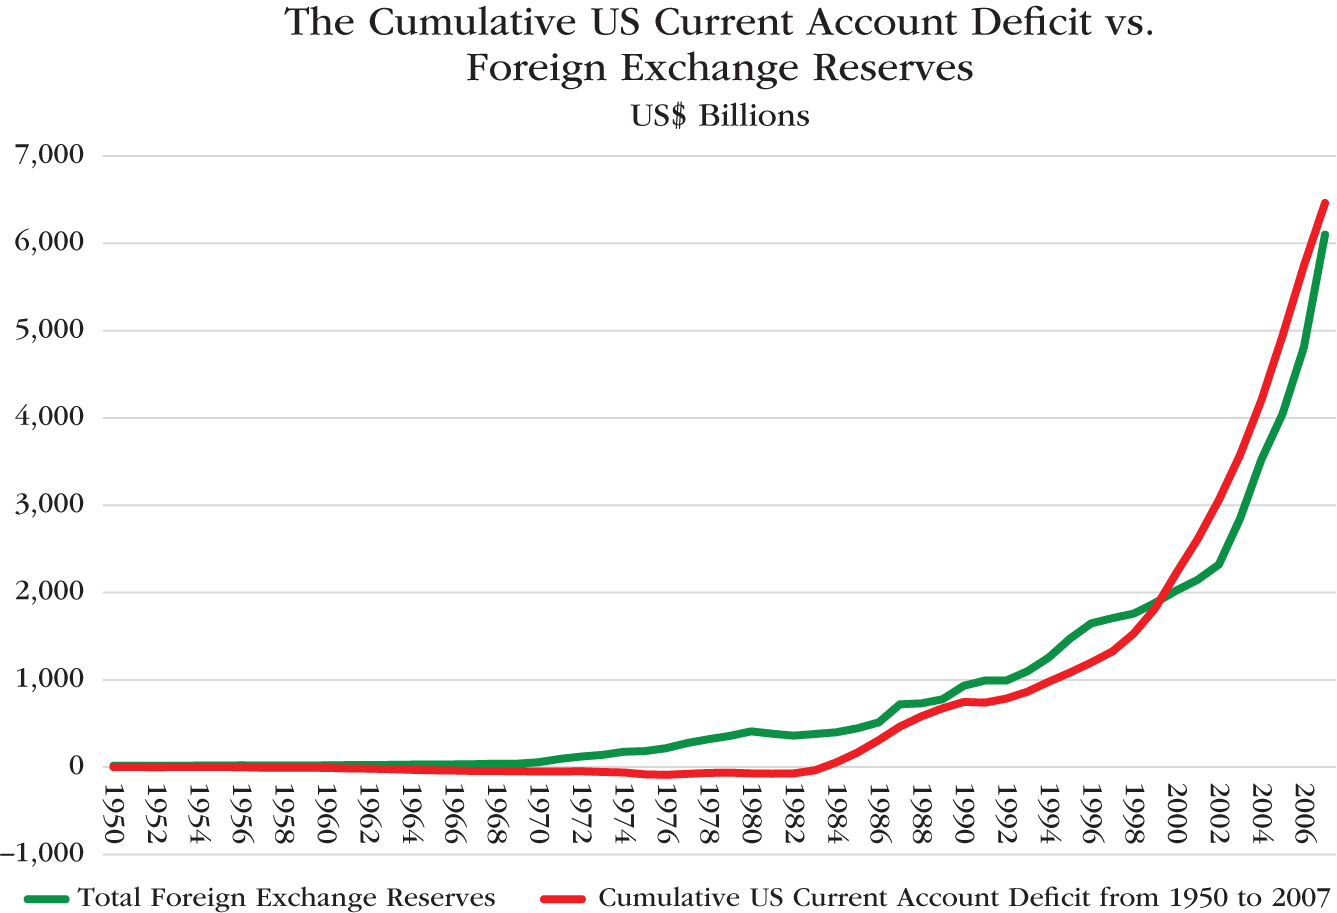
CHART 10.8 The Cumulative US Current Account Deficit vs. Total Foreign Exchange Reserves, 1950 to 2007
Source: Data from the International Monetary Fund, Total Foreign Exchange Reserves: 1950 to 2007
Not all foreign exchange reserves are made up of US dollars. Central banks also acquire euros, pounds, yen, and other currencies. The exact currency breakdown of total foreign exchange reserves is unknown because China, the largest holder of foreign exchange reserves, keeps the composition of its foreign exchange reserves a secret. For all the other countries that do report the composition of their reserves, dollars make up 61% of the total.2
China has run an extraordinarily large trade surplus with the United States for three decades. China's cumulative trade surplus with the US between 1990 and 2007 was $1.7 trillion (with that figure increasing to $5.7 trillion by 2019). Given that Chinese companies are paid in dollars when they sell their products to the United States, it is very likely that the great majority of China's foreign exchange reserves are comprised of dollars. That strongly suggests that the dollar accounts for a larger portion of total foreign exchange reserves in the world than the 61% indicated by the countries that do report the composition of their foreign currency reserves. Therefore, here it will be assumed that dollars make up 70% of all foreign exchange reserves.
At the end of 2007, total foreign exchange reserves amounted to $6.1 trillion. Assuming 70% of those reserves were comprised of dollars, then foreign central banks held 4.3 trillion dollars at that time. Those dollars would have been invested in US dollar-denominated assets. Total US debt outstanding (i.e., the combined debt of all sectors of the US economy) amounted to $52.6 trillion at the end of 2007. Therefore, it is reasonable to conclude that foreign central banks had financed more than 8% of all US debt at that point.
This arrangement, whereby the United States would run very large trade deficits and the central banks of the trade surplus countries would finance those deficits by creating money and buying dollar-denominated assets, was extraordinarily advantageous for both the government of the United States and for the trade surplus countries. The US government was able to run larger budget deficits and have other countries finance them. This allowed the US government to spend more on both the military and on domestic welfare programs than it otherwise could have done. If other countries had been unwilling to finance the government's budget deficits, then either the US government would have had to run smaller budget deficits (by spending less or taxing more) or else the Fed would have had to create even more money to finance the large deficits. If the Fed had created more money than it was already creating, it would have risked causing much higher rates of inflation in the United States. When other central banks created the money that financed the US budget deficits, that avoided the inflationary pressures that would have arisen in the United States if the Fed had had to create more dollars to finance the budget deficits. Chapter 15 will explain this in greater detail.
The trade surplus countries benefited from this arrangement because it allowed them to pursue export-led economic growth strategies that produced very rapid economic growth in their countries. To make this work, the central banks of the trade surplus countries created their own currency and used it to buy dollars in order to depress the value of their currency. Weak currencies allowed those countries to continue running large trade surpluses with the United States by making their manufactured goods more competitive than goods manufactured in the United States. Rapid export growth meant rapid job creation and accelerated economic growth in the countries with a trade surplus.
Not surprisingly, then, numerous central banks around the world created their own currencies and bought dollars. Once they had acquired dollars, it made sense to invest them in order to generate additional income. Dollars must be invested in dollar-denominated assets. US government securities were (and still are) the dollar-denominated asset of choice for risk-adverse central bankers. Buying US government securities with newly created money was seen as a small price to pay in exchange for rapid economic growth and rapid job creation. In fact, the price paid was zero, since the money that was used to buy the US government debt had cost nothing to create.
The world economy was transformed as a direct result of these developments. Much of Asia, in particular, underwent an industrial revolution in the course of only a few decades. Hundreds of millions of people around the world were pulled out of poverty because of the United States trade deficits and the money that the central banks of the trade surplus countries created to finance them.
In practice, this meant that not only was the Fed creating money (Federal Reserve Credit) and using it to finance the US government's budget deficit by acquiring US government securities, but that the central banks of other countries were also creating money and using it to acquire US government securities. By 1977, the “rest of the world” owned more US government securities than the Fed did, as shown in Chart 10.9.
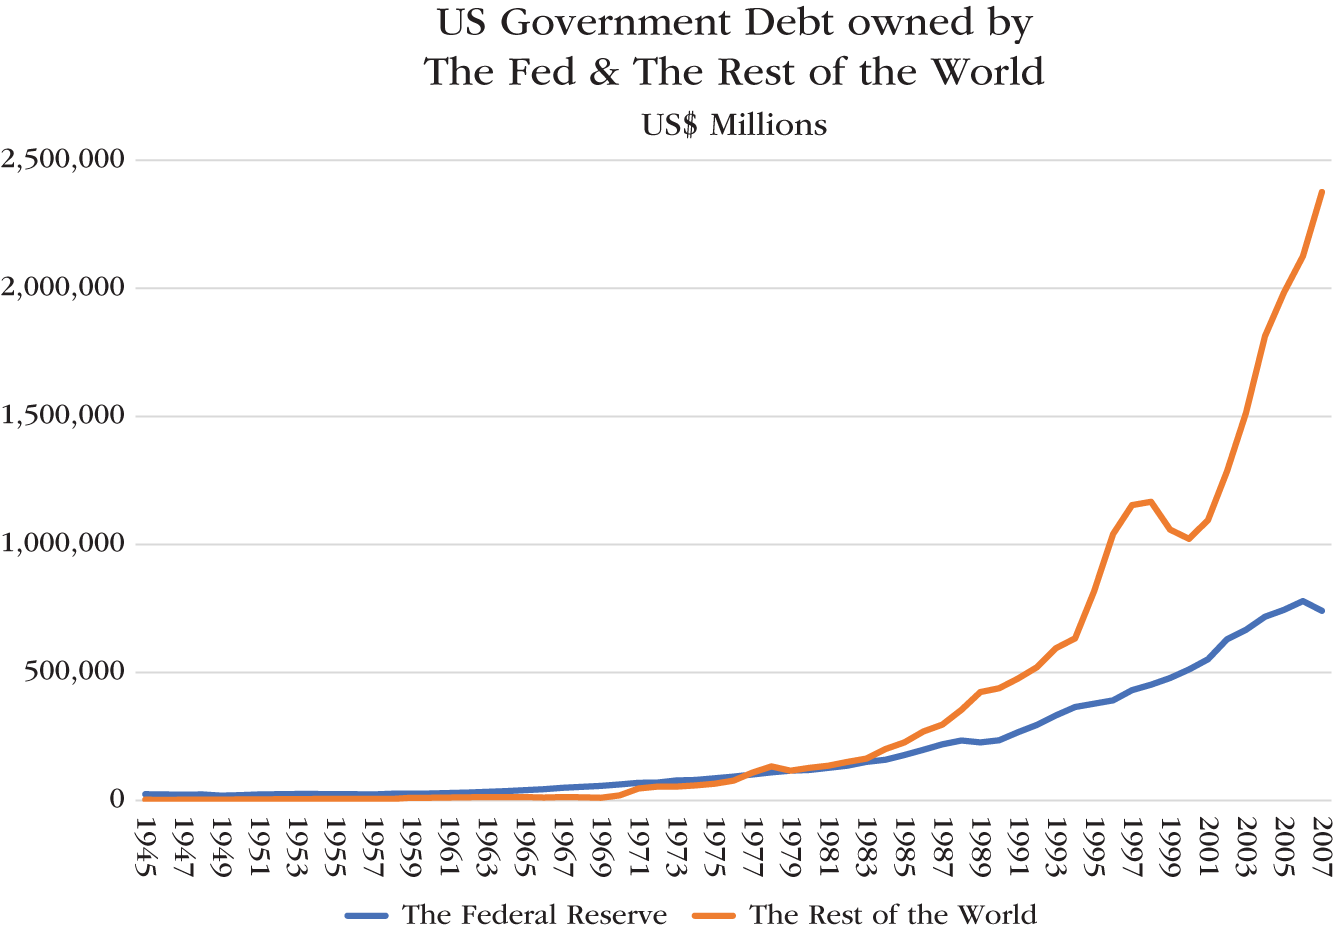
CHART 10.9 US Government Debt Owned by the Fed and the Rest of the World, 1945 to 2007
Source: Data from the Financial Accounts of the United States, 1945–2007, The Fed
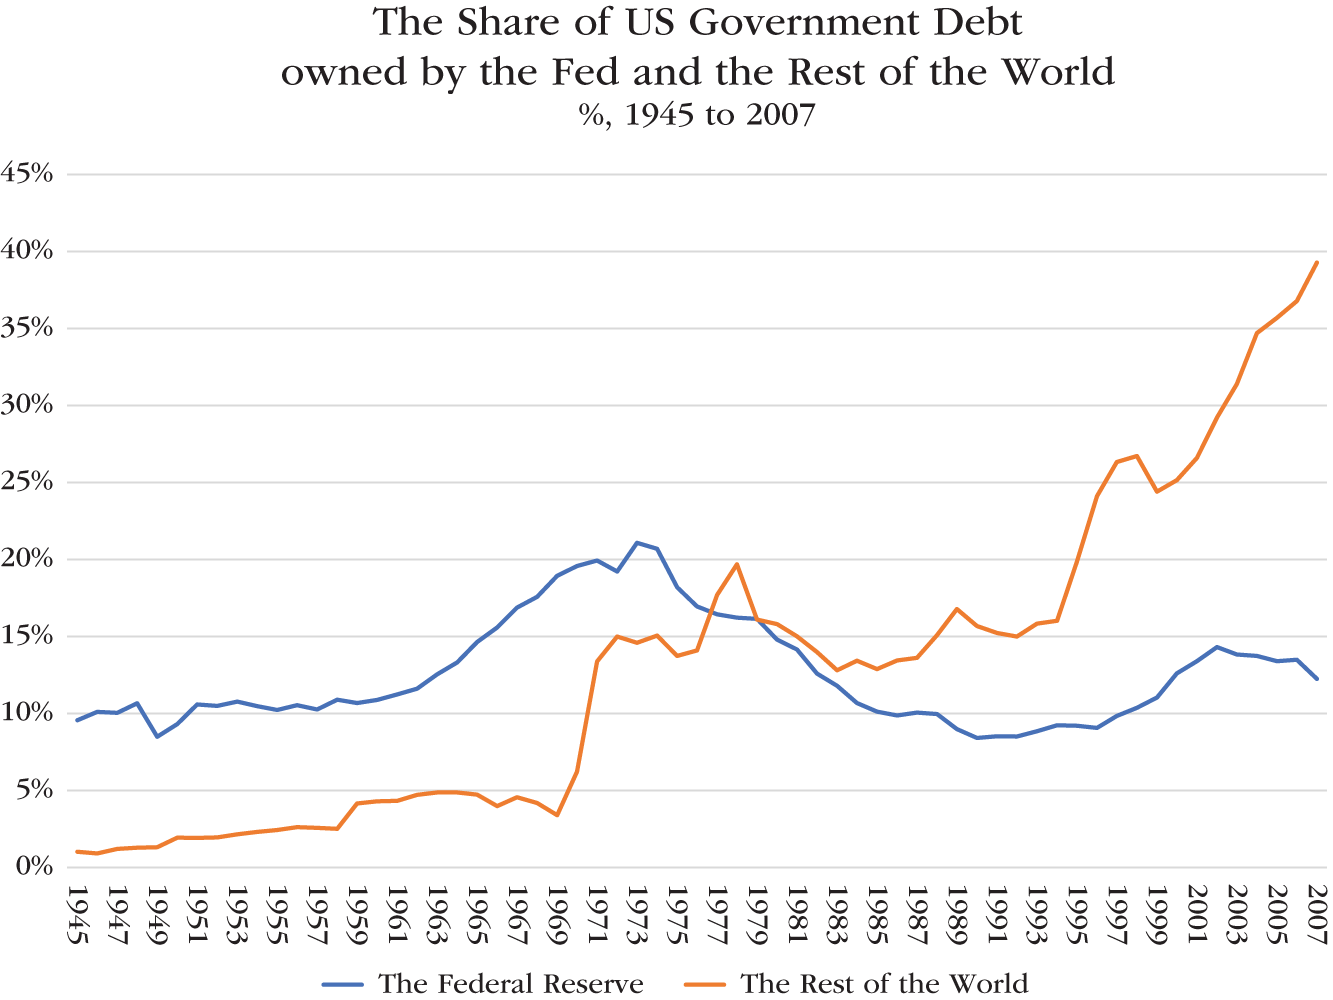
CHART 10.10 The Share of US Government Debt Owned by the Fed and the Rest of the World, 1945 to 2007
Source: Data from the Financial Accounts of the United States, 1945–2007, The Fed
By the end of 2007, the Fed owned 12.2% of all US government debt, while the rest of the world owned 39.3%. This can be seen in Chart 10.10.
So, while the Fed's holdings of US government securities increased very sharply between 1970 and 2007, other central banks' holdings of US government securities increased a great deal more. This development had important consequences. Since other central banks were creating money and buying US government securities (i.e., monetizing US government debt), that enabled the Fed to create less money and to acquire fewer US government securities than it otherwise would have had to do.
Put differently, the central banks of the trade surplus countries were creating central bank credit (in the same way that the Fed creates Federal Reserve Credit, as explained in Chapter 1) and extending it to the United States by first buying dollars and then investing those dollars in US government securities, bonds issued by Fannie Mae and Freddie Mac, and other US dollar-denominated debt instruments.
The Liquidity Gauge
This arrangement worked out very well for almost everyone concerned – up until the time that the US Current Account deficit grew so huge that the matching capital inflows became too large to be absorbed in the US economy without blowing it into an economic bubble. Remember, the capital inflows (recorded in the Financial and Capital Accounts) are the mirror image of the US Current Account deficit. So, as the Current Account deficit expanded so did the capital inflows into the United States that financed that deficit.
Everything worked smoothly so long as the US government budget deficit was larger than the capital inflow, or, to say the same thing in a different way, so long as the US budget deficits were larger than the US Current Account deficits. The government would sell government securities to finance its budget deficit and the central banks of the trade surplus countries could simply invest the dollars they had acquired into those new government securities.
The trouble began, however, when the annual capital inflows grew larger than the US government's annual budget deficits, starting in 1997, as shown in Chart 10.11.
For 11 years in a row, from 1997 to 2007, the capital inflows (i.e., the surplus on the Financial and Capital Account) were larger than net government borrowing (which is quite similar to, but not exactly the same size as, the US government's budget deficit). That meant that the US government was not selling enough new bonds to absorb all the dollars that the central banks of the trade surplus countries had acquired and needed to invest during those years. Therefore, those central banks had to find some other dollar-denominated assets in which to invest those dollars. Their options were relatively limited. They could buy US corporate bonds, the bonds issued by Fannie Mae and Freddie Mac, US equities, US property or other real assets in the United States, or they could buy existing US government securities that the government had sold in earlier years. They did some of all these things. The result was that US asset prices rose and US interest rates fell. When there is heavy demand for bonds, bond prices rise and that causes bond yields (i.e., interest rates) to fall.
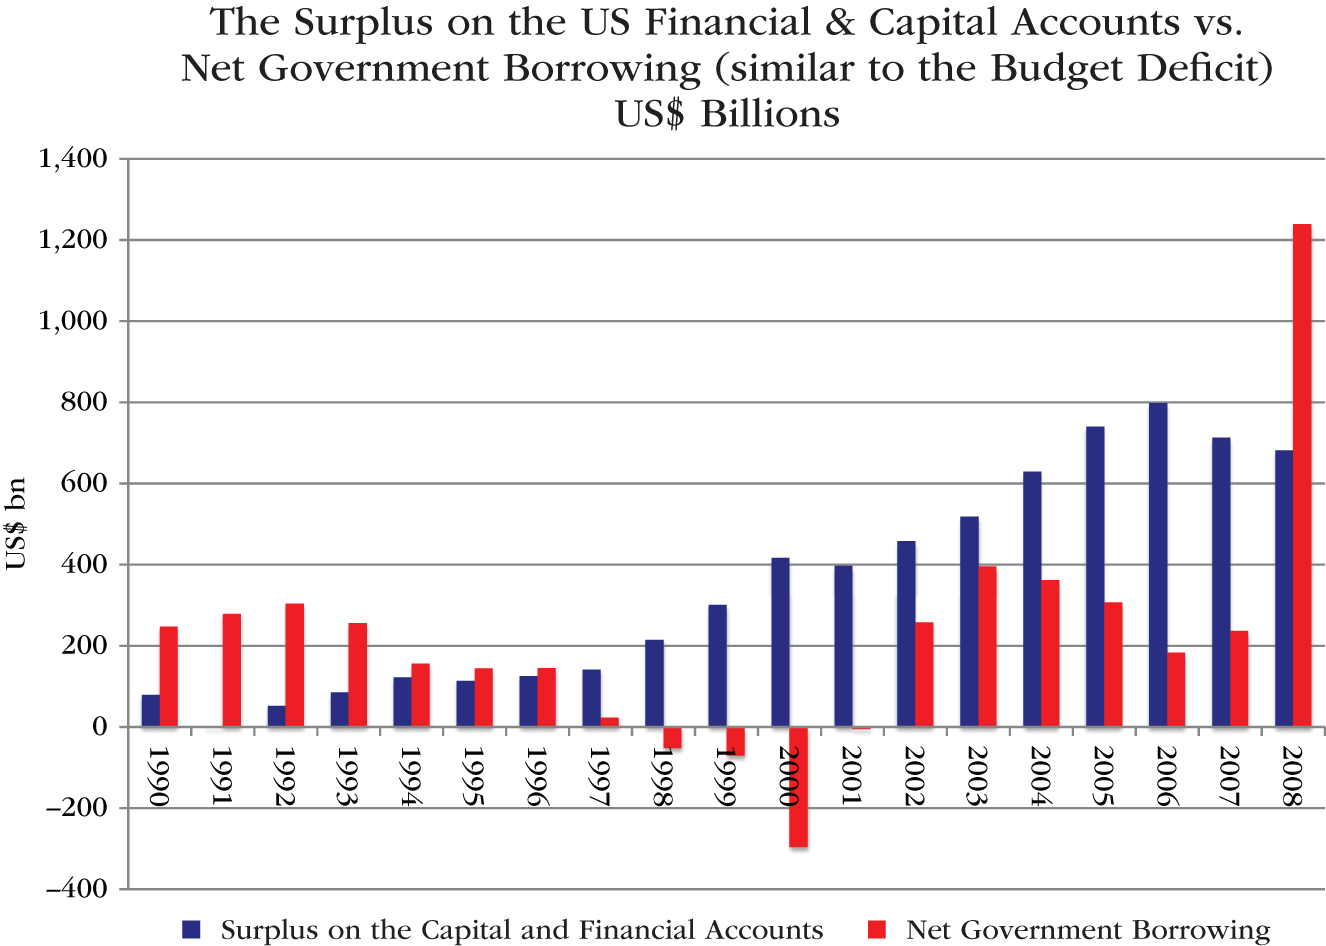
CHART 10.11 The Surplus on the US Financial Account and Capital Account vs. Net Government Borrowing, 1990 to 2008
Source: Data from the Financial Accounts of the United States, The Fed; U.S.Bureau of Economic Analysis
To better illustrate this point, I have created what I call the Liquidity Gauge, which is simply the difference between the surplus on the Financial and Capital Accounts (which is the mirror image of the Current Account deficit) and net government borrowing. When the Liquidity Gauge shows a positive number there is excess liquidity and asset prices tend to rise. When the Liquidity Gauge indicates a negative number, there is a liquidity shortage and asset prices tend to fall. Chart 10.12 shows the Liquidity Gauge from 1990 to 2008.
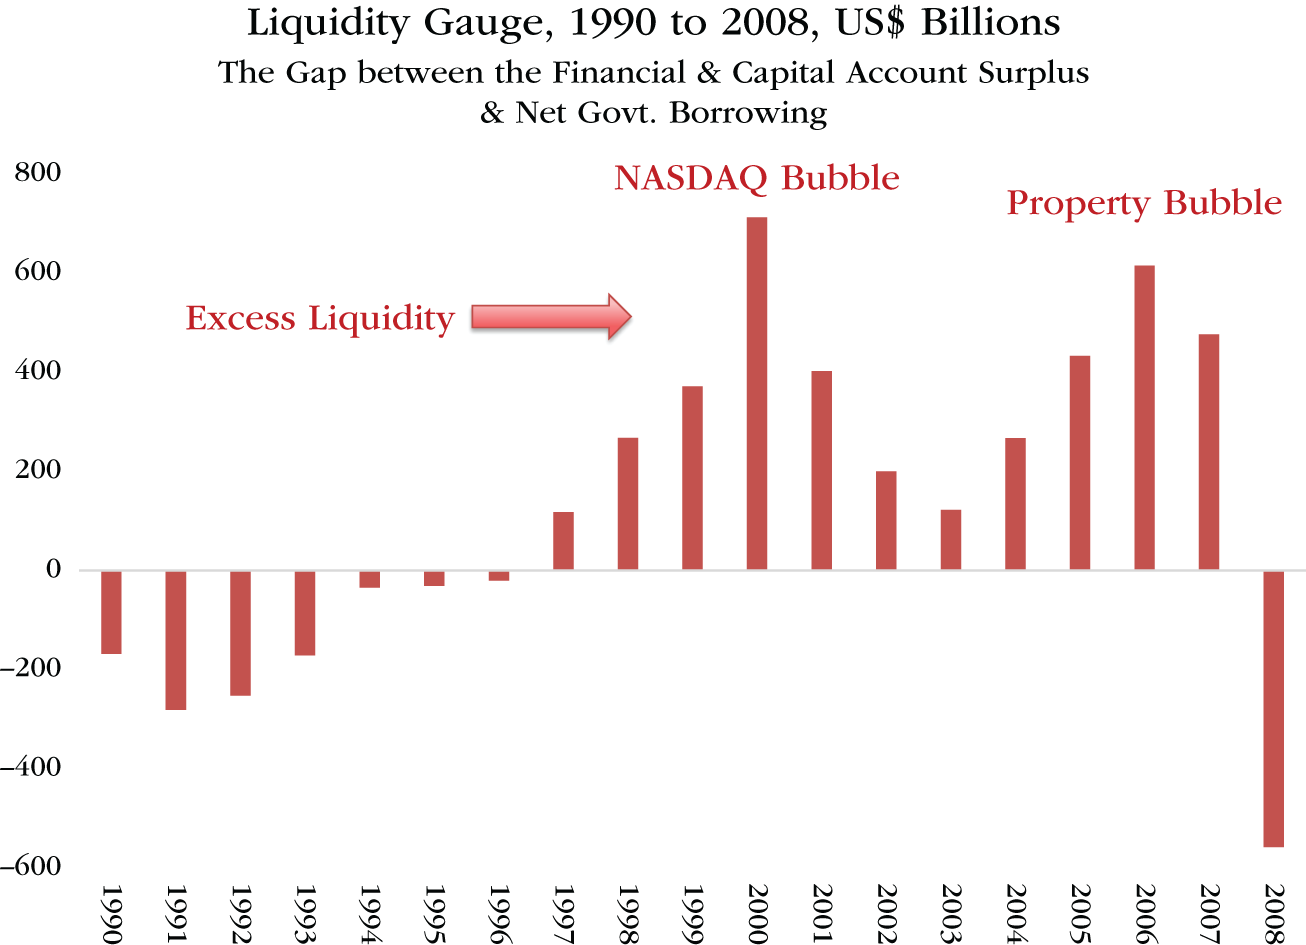
CHART 10.12 Liquidity Gauge, 1990 to 2008
Source: Data from the Financial Accounts of the United States, The Fed; U.S.Bureau Of Economic Analysis
The huge amounts of money that the central banks of the trade surplus countries created and invested in the United States played a significant role in blowing the US economy into a bubble. Notice in Chart 10.12 the years 1998 to 2001. During those years, the Clinton administration ran rare government budget surpluses. That meant the government sold no new government securities. Instead, it repaid some of the government securities that had financed the budget deficits in earlier years, thereby retiring government securities and compounding the problem the foreign central banks faced in finding suitable investments for the money they had created. The NASDAQ bubble was the result. This was similar to the 1920s, when the US government paid down its debt, forcing money out of government bonds and into stocks. That reduction in government debt outstanding contributed to the stock market bubble of the late 1920s and the crash in 1929.
Money is fungible. That means regardless of where the foreign central banks invested their money in the United States, it affected the price of every asset class. For instance, if they bought government bonds that had been issued in earlier years, whomever they bought those bonds from had cash that they had to invest somewhere else – somewhere else like NASDAQ.
Next, consider the period beginning 2004. That year, the Fed, concerned that the property market was running out of control, began hiking the federal funds rate. Between June 2004 and July 2006, the Fed hiked the federal funds rate 17 times, pushing up short-term interest rates. Long-term interest rates, which matter much more for the economy than short-term rates, barely budged, however. The Fed pushed up the federal funds rate by 425 basis points, but the yield on 10-year government bonds was only 36 basis points higher in July 2006 than it was when the Fed began hiking nearly two years earlier. Chart 10.13 shows the movement in the federal funds rate and the 10-year bond yield during this period.
Normally when the Fed pushes up short-term interest rates, long-term interest rates move up as well. That did not happen in the mid-2000s because the central banks of the trade surplus countries were creating so much money and buying so many long-term US government securities, thereby supporting the price of those bonds, that the yield on those securities would not rise. Bond yields rise when bond prices fall. In short, the central banks of the trade surplus countries were monetizing so much US government debt that the Fed lost control over US interest rates and, therefore, lost control over the US economy. Unable to make long-term interest rates rise, the Fed was powerless to stop the property bubble from inflating. In 2008, that bubble popped and nearly dragged the world into a new Great Depression.
I asked Alan Greenspan about this in January 2017.
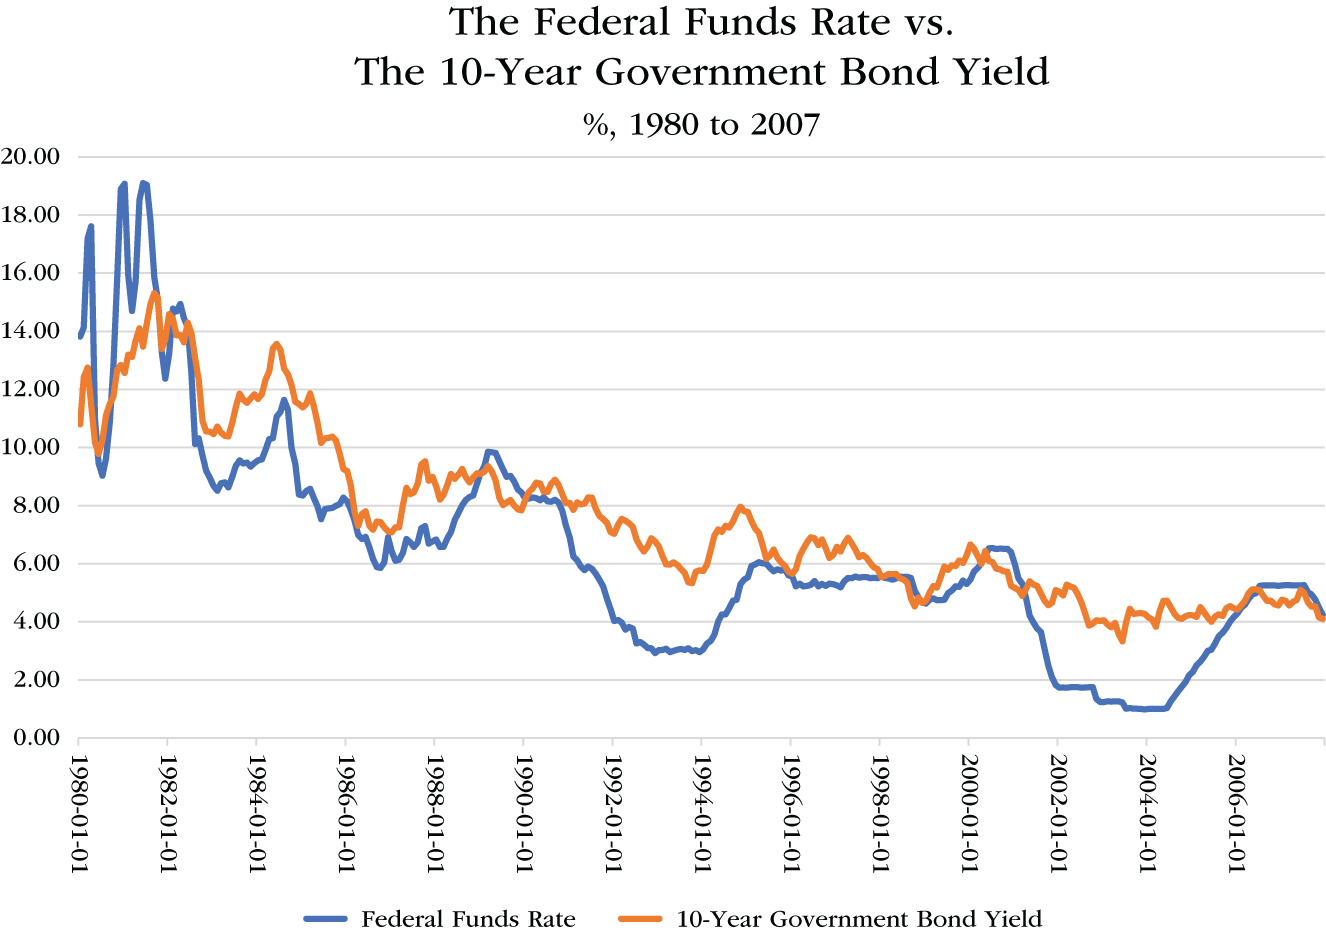
CHART 10.13 The Federal Funds Rate vs. the 10-Year Government Bond Yield, 1980 to 2007
Source: Data from the Federal Reserve Bank of St. Louis
Thanks to Bill Bonner, founder of Agora Inc. and The Daily Reckoning, I had the opportunity to meet former Fed Chairman Alan Greenspan on January 18, 2017, at the Agora Economics Roundtable 2017 in Baltimore. Below is the transcript of the questions I asked him and his replies. Please keep in mind that this was a discussion. We only had one hour with Dr. Greenspan. Roughly 15 to 20 questions were put to him by a dozen participants. Time was short. I had only a very limited time to ask my question and to get a meaningful response. I believe the question I asked is of historic importance. I was determined to get an answer. I did.
Please note that I have added a few comments in bold type to help clarify points that may not be obvious to those who have not followed this subject closely.
A Transcript of My Q&A with Alan Greenspan
Richard Duncan: Dr. Greenspan, we know almost everything about the crisis of 2008 by this point, but there is one very important thing that we don't know, in my opinion, and that is what was your thinking about the fiat money creation that was being carried out by the central banks of the trade surplus countries? They created trillions of dollars between 2000 and 2007 and they invested 70% of those into US dollar-denominated assets, mostly treasury bonds.
For instance, during the “conundrum years”, mid-2004 to mid-2006, foreign exchange reserves went up by one and a quarter trillion dollars; and $900 billion of those reserves were held in US dollars. Those dollars were invested in US dollar-denominated assets, mostly treasury bonds. That was enough to finance the entire US government budget deficit for those two years, with $200 billion left over. Doesn't that explain “the conundrum”? And how did you think of that at the time?
The Conundrum: Between mid-2004 and mid-2006, the Fed increased the federal funds rate by 425 basis points, but longer-term interest rates (such as the yield on 10-year US government bonds) did not go up as they normally do when the Fed hikes short-term interest rates. In reference to this development, Chairman Greenspan said in Congressional testimony, “For the moment, the broadly unanticipated behavior of world bond markets remains a conundrum.” 3
Alan Greenspan: I don't think it does. If you look at double-entry bookkeeping in the national accounts, the type of transactions you're talking about don't directly affect that. That is, if you get a central bank, let's say the case in which is the most general way, in 2008 the federal reserve, because everyone wanted to hold dollars, which I found very fascinating as it was as late as … Remember, we were a fiat currency, we were a weak fiat currency, but stronger than everybody else so through that crisis reserves were US dollars and the federal reserve made a large number of swaps, which were temporary exchange of dollars for lira, for euros, any foreign currencies of other central banks.
They were unwound shortly thereafter so it's not … The basic problems are, you get bubbles because human nature is what it is. People get euphoric. We know by experience that fear is a far more formidable force in human activity than euphoria and as a result, for example, recessions go down far more sharply than recoveries and the stock market behaves exactly the same way so that you've got these very odd patterns. Without getting into too much detail, most economic models that work try to integrate human nature into the asymmetries that we're seeing. What I've seen at the moment is that you would not have gotten a crisis in 2008 if we took, say, eliminated Dodd–Frank completely and merely substituted a significant increase in equity capital requirements in the commercial banking industry for everything else.
The reason I say that is we have data going back in the United States to 1869 since the beginning of the control of the currency and that shows that income, net income of commercial banks to equity assets has been a remarkably stable five …
Richard Duncan: I'm sorry, could I interrupt? This wasn't a swap, this was a central bank, the PBOC, printing money, buying dollars and buying treasury bonds, pushing up their price and pushing down their yield.
Alan Greenspan: Everybody does that but you can't push the yield down if the market's running against you.
Richard Duncan: You were trying to push them up by hiking the federal funds rate by 425 basis points …
Alan Greenspan: I wasn't there.
Richard Duncan: This was when you were hiking rates in 2004, 2005 and 2006, but the 10-year bond yield didn't go up …
Chairman Greenspan retired from the Fed in January 2006.
Alan Greenspan: No, what happened then is what I call “the conundrum.”
Richard Duncan: Yes.
Alan Greenspan: We thought, what we thought was that we had to tighten the markets and as we did the only tool that we had was the federal funds rate and historically we did not trade in the long end of the market.
Richard Duncan: My question is, the long end didn't go up because the PBOC was printing RMB, buying dollars, and buying treasury bonds.
Alan Greenspan: No, that's not the reason. The reason was that the cold war came to an end and the Berlin wall came down and you have a huge increase in the number, it was something like a billion people came out from behind the iron curtain and tried to integrate with the remainder of the world's economy and obviously the economic ruin behind the iron curtain that was exposed when that wall came down was a great shock to everybody. You had all of these semi-skilled people moving into the west and there was enough of a downward pressure on wages because big new supply occurred that you've got interest rates going down.
For example, I remember extraordinarily well that Mexico was able to issue a 20-year peso-backed bond at a reasonable interest rate, not terribly much above the United States. This is within a relatively few years. Remember in 19 … I'm trying to think, it was when Mexico was about to go bankrupt, which was 1984 and it had tesobonos, which were basically not backed by anything and we bailed them out, the United States bailed out Mexico at that particular point. They were able to come back very few years later with a 20-year issue in pesos and they couldn't … For decades, I don't think they ever were able to issue a 20-year peso-denominated anything.
Richard Duncan: The creation of the equivalent of 10 trillion dollars by the foreign central banks between 2000 and 2014 had no impact on the global savings glut?
The event organizers were signaling (and had already signaled a few times) that my time was up… .
Global Savings Glut: Both Ben Bernanke and Alan Greenspan explained that the Fed was unable to prevent the property bubble in the United States (and, consequently, the global economic crisis) because there was a “global savings glut”. By that they meant that people in the developing economies had a very high savings rate and they chose to invest their savings in US dollar-denominated assets, instead of investing at home. Their investments caused US bond prices to rise and US bond yields (i.e., interest rates) to fall. And, consequently, there was nothing the Fed could do about it, at least, according to Bernanke and Greenspan.
Alan Greenspan: We don't know because you can't tell. There were so many forces at play at that time it was difficult to separate them. We were confronted with the fact that with this huge increase in savings, because remember, the income of the previously behind the iron curtain countries was not spent, they saved a good part of it because there were no institutions for savings. That drove down the long-term rates in the market of both the US dollar and all other rates. In that type of condition, you've got a very difficult problem on the part of the federal reserve who was trying to raise rates but the flood, the savings glut, was coming from the movement of funds from behind the iron curtain, basically.
These were people who were literally blocked off until you got a huge increase and the rates kept going down for a number of years.
I don't know whether, to what extent you can attribute anything to anything, but that was critically the major factor in retrospect.
I find his final remark especially fascinating: “I don't know whether, to what extent you can attribute anything to anything… .”
Also, I am not sure how much money the people behind the iron curtain had saved up, but I am sure it was nowhere near $10 trillion dollars. I would be surprised if as much as $100 billion of savings moved from Eastern Europe to the United States. The iron curtain fell in 1989. The conundrum occurred between mid-2004 and mid-2006.
If Chairman Greenspan did not know why longer-term interest rates were not moving higher, he should have. Government bond yield did not move higher because a number of central banks from other countries were buying hundreds of billions of dollars' worth of US government bonds, pushing up their price and holding down their yields.
I find it difficult to believe that Chairman Greenspan did not understand that. The data was publicly available. Central bankers communicate with each other daily, as do monetary officials in the world's treasury departments. The main function of central banks is to create money and credit. It is inconceivable that the thousands of economists employed by the Federal Reserve System would have simply overlooked the fact that central banks outside the United States were creating the equivalent of trillions of dollars, using that money to buy dollars and then investing those dollars into US dollar-denominated assets – and that those economists would have failed to understand the impact those investments were having on US interest rates, asset prices, and the entire economy. If they did fail to understand what was happening, they were grossly incompetent.
On the other hand, if Chairman Greenspan and his colleagues at the Fed did, in fact, understand what was happening, it is fascinating to consider why he denied knowing that he did. Is this a topic that central bankers are simply not permitted to discuss? Are they not allowed to acknowledge that US government officials had entered into an arrangement with foreign governments whereby the United States agreed to run large trade deficits so long as foreign central banks would finance them? Is it too sensitive because this arrangement benefits the profits of US corporations and banks and financed US government spending at low interest rates, but at the cost of the loss of millions of jobs in the US manufacturing sector and downward pressure on US wages in general? I believe that may be the reason.
Chairman Greenspan may be right in saying, “I don't know whether, to what extent you can attribute anything to anything… .” However, I would prefer to attribute the deindustrialization of the United States and the economic crisis that followed in 2008 as the largely unintended outcome of the arrangement described above than to the possibility that the Central Bank and Treasury Department of the United States were too dim-witted to understand what was happening right in front of them.
In any case, there can be no doubt that the injection of $4.3 trillion of foreign central bank credit into the United States by 2007 – an amount that financed 8% of all the outstanding debt in the United States that year – had a profound impact on the US economy. That money drove up asset prices and helped inflate the economic bubble that imploded in 2008.4
Notes
1. Japan is an exception. Japan's foreign exchange reserves are held by the Ministry of Finance rather than by the Japanese Central Bank, the Bank of Japan.
2. IMF Currency Composition of Official Foreign Exchange Reserves, COFER. https://data.imf.org/?sk=E6A5F467-C14B-4AA8-9F6D-5A09EC4E62A4
3. Testimony of Chairman Alan Greenspan, Federal Reserve Board's semiannual Monetary Policy Report to the Congress, Before the Committee on Banking, Housing, and Urban Affairs, U.S. Senate, February 16, 2005. https://www.federalreserve.gov/boarddocs/hh/2005/february/testimony.htm
4. $4.3 trillion assumes that 70% of all foreign exchange reserves were dollars in 2007.