
CHAPTER 9
When the music stops, in terms of liquidity, things will be complicated. But as long as the music is playing, you’ve got to get up and dance. We’re still dancing.
Charles Prince, Citigroup CEO, July 9, 20071
The previous chapter described the surge in credit creation by the commercial banks, the corresponding sharp increase in leverage of the banking sector and the regulatory and technical changes that allowed those developments to occur.
This chapter describes the much larger surge in credit extension by the broader financial sector, of which the commercial banks comprise only one part. It documents the rapid rise of the non-bank creditors in the financial sector from the early 1970s and discusses the profound impact their lending had on the US economy as it drove the leverage of the entire economy much higher.
The chapter also addresses the important question concerning the source of the funds that allowed those non-bank lenders to extend so much credit. We will see that the entire financial sector finances the credit it extends in essentially the same way the commercial banks do; that is, when non-bank creditors extend credit, they too create the funds that finance additional credit creation. Just as banks create money (deposits) in a system of fractional reserve banking when they make loans, non-bank creditors in the financial sector create bank deposits and other types of financial sector liabilities that serve to provide the funding for the next round of credit extension.
Creditopia
Between 1970 and 2007, the stock of outstanding credit extended by the financial sector surged by more than 50 times, from $714 billion in 1970 to $38 trillion in 2007. Of the $38 trillion total in 2007, the private depository institutions (comprised primarily of US commercial banks, but also of foreign banking offices in the United States, banks in US-affiliated areas and credit unions) accounted for only $11 trillion, or 29%. The remaining $27 trillion was extended by non-bank creditors (see Chart 9.1).
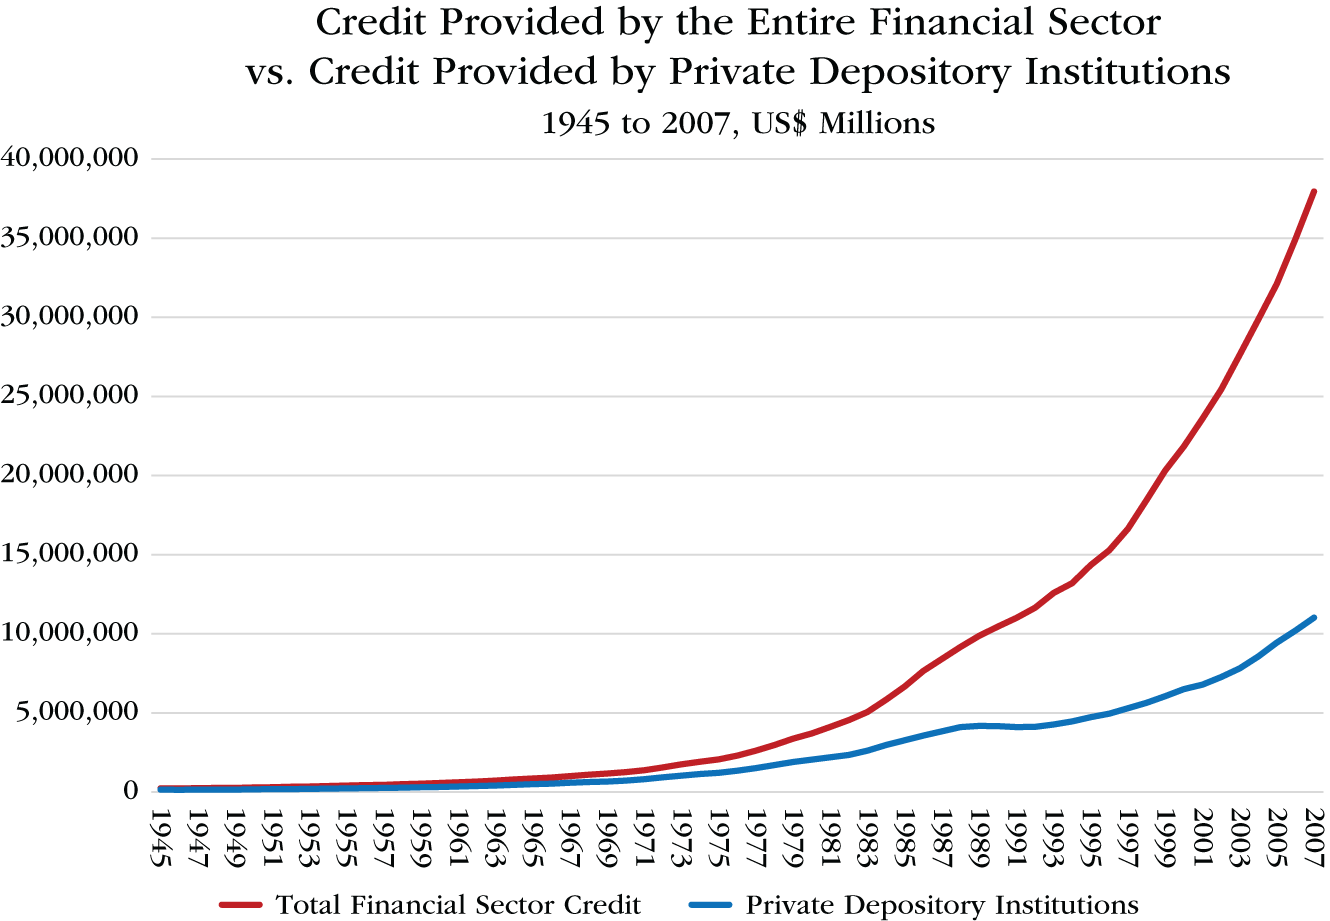
CHART 9.1 Credit Provided by the Entire Financial Sector vs. Credit Provided by Private Depository Institutions, 1945 to 2007
Source: Data from the Financial Accounts of the United States 1945–2007, The Fed
Not only did the credit extended by the financial sector grow extraordinarily rapidly, it also expanded relative to the size of the US economy. Total credit provided by the financial sector was 102% of GDP in 1945. It rose to 117% in 1970 and to 130% in 1980. From that point, there was a marked acceleration. By 1990, financial sector credit to GDP hit 175%. In 2000, the ratio was 213% and by 2007, it had jumped to 263% of GDP (see Chart 9.2).
This sharp surge in financial sector credit fueled economic growth in the United States. Therefore, this rise in the ratio of financial sector credit to GDP is even more striking than it appears at first glance. That is because the credit growth made the economy grow faster than it otherwise would have. In other words, the denominator in this ratio (GDP) was made larger by the increase in the numerator (financial sector credit). Had financial sector credit growth not made the economy expand, the increase in this ratio would have been far larger.
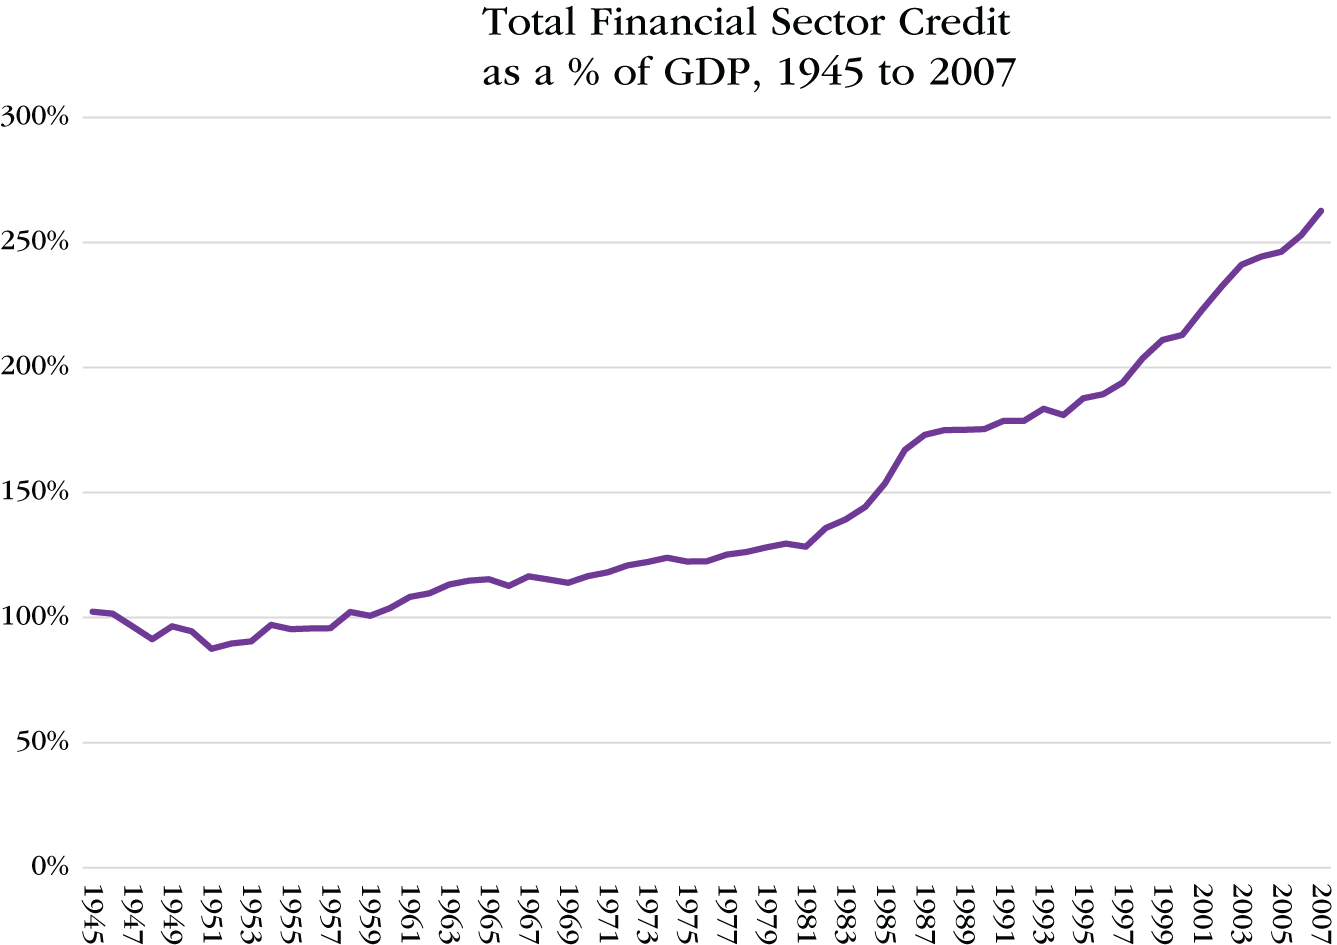
CHART 9.2 Total Financial Sector Credit as a Percentage of GDP, 1945 to 2007
Source: Data from the Financial Accounts of the United States, 1945–2007, The Fed
The growth in the annual amount of credit extended by the financial sector each year has been truly astonishing. Total credit provided by the financial sector increased by $92 billion in 1970. By 1986, the annual increase had climbed to nearly $1 trillion. It topped $2 trillion in 2003. And, in 2007, it hit $3 trillion. That surge in financial sector credit played a leading role in blowing the US economy into the economic bubble that popped in 2008. See Chart 9.3.
As great as the increase in private depository institutions lending was (as described in the previous chapter), it was lending by non-bank creditors within the financial sector, rather than lending by the private depository institutions, that was primarily responsible for the explosion of total financial sector credit.
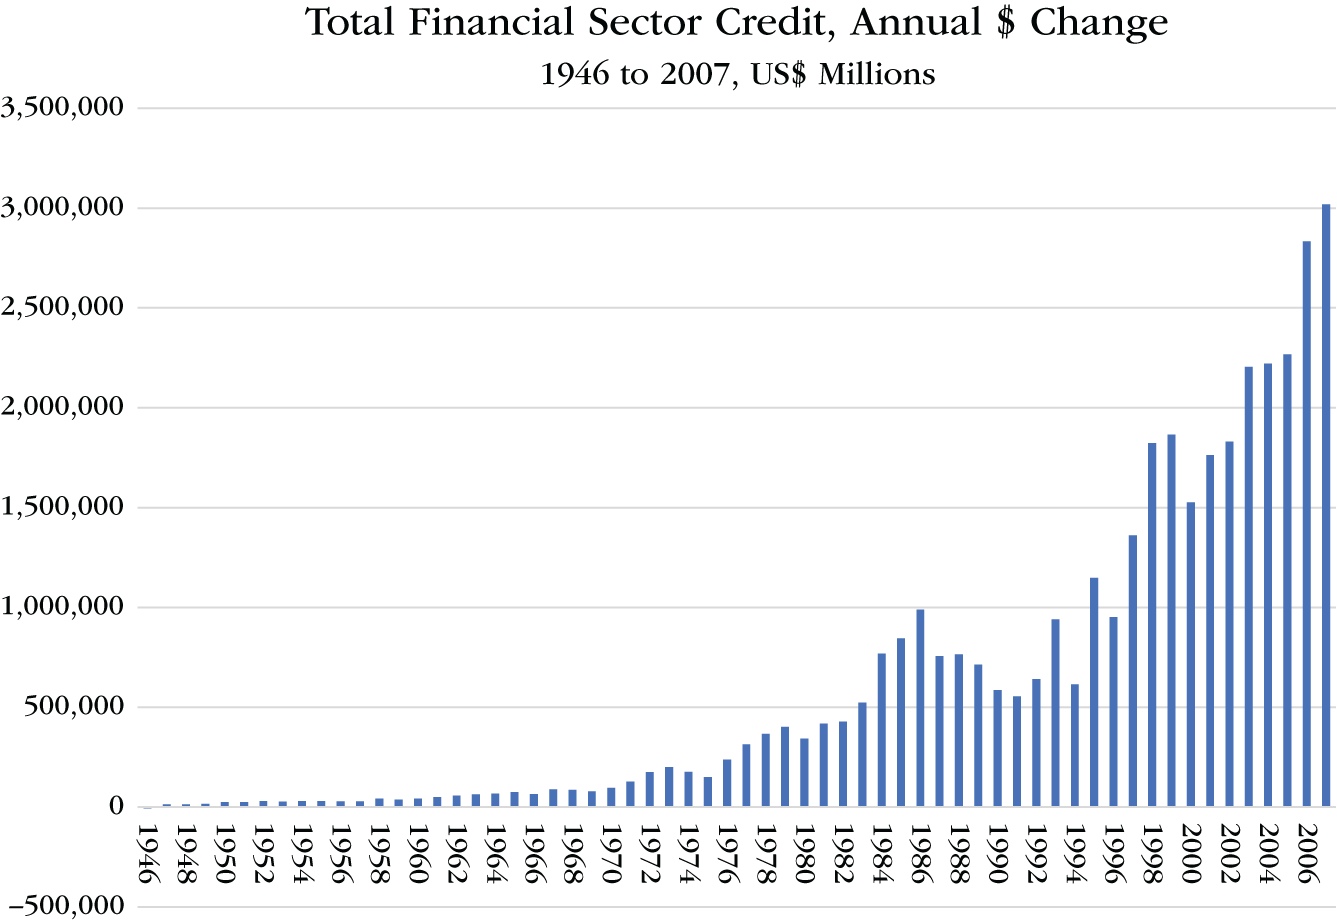
CHART 9.3 Total Financial Sector Credit, Annual $ Change, 1946 to 2007
Source: Data from the Financial Accounts of the United States, 1945–2007, The Fed
Chart 9.4 shows that the ratio of credit provided by the private depository institutions to GDP changed relatively little between 1945 to 2007, ranging between 51% and 79%. The credit provided by the rest of the financial sector, on the other hand, rose steadily from 39% of GDP in 1945 to 54% of GDP in 1975, from which point it then accelerated dramatically, reaching 186% of GDP in 2007.
In 1970, private depository institutions provided $55 billion of new credit out of the $92 billion of new credit the financial sector provided in total that year, whereas in 2007, they provided just $809 billion of new credit out of a total of $3 trillion. This can be seen in Chart 9.5, which shows the annual increase in credit provided by the private depository institutions compared with the annual increase in credit provided by the entire financial sector. That chart clearly illustrates the diminishing role played by the private depository institutions in providing credit in comparison with the non-bank lenders. Succeeding paragraphs will show that the extraordinary growth of non-bank lenders transformed the nature of the US financial system.

CHART 9.4 Credit Provided by Private Depository Institutions vs. the Rest of the Financial Sector as a Percentage of GDP, 1945 to 2007
Source: Data from the Financial Accounts of the United States, 1945–2007, The Fed
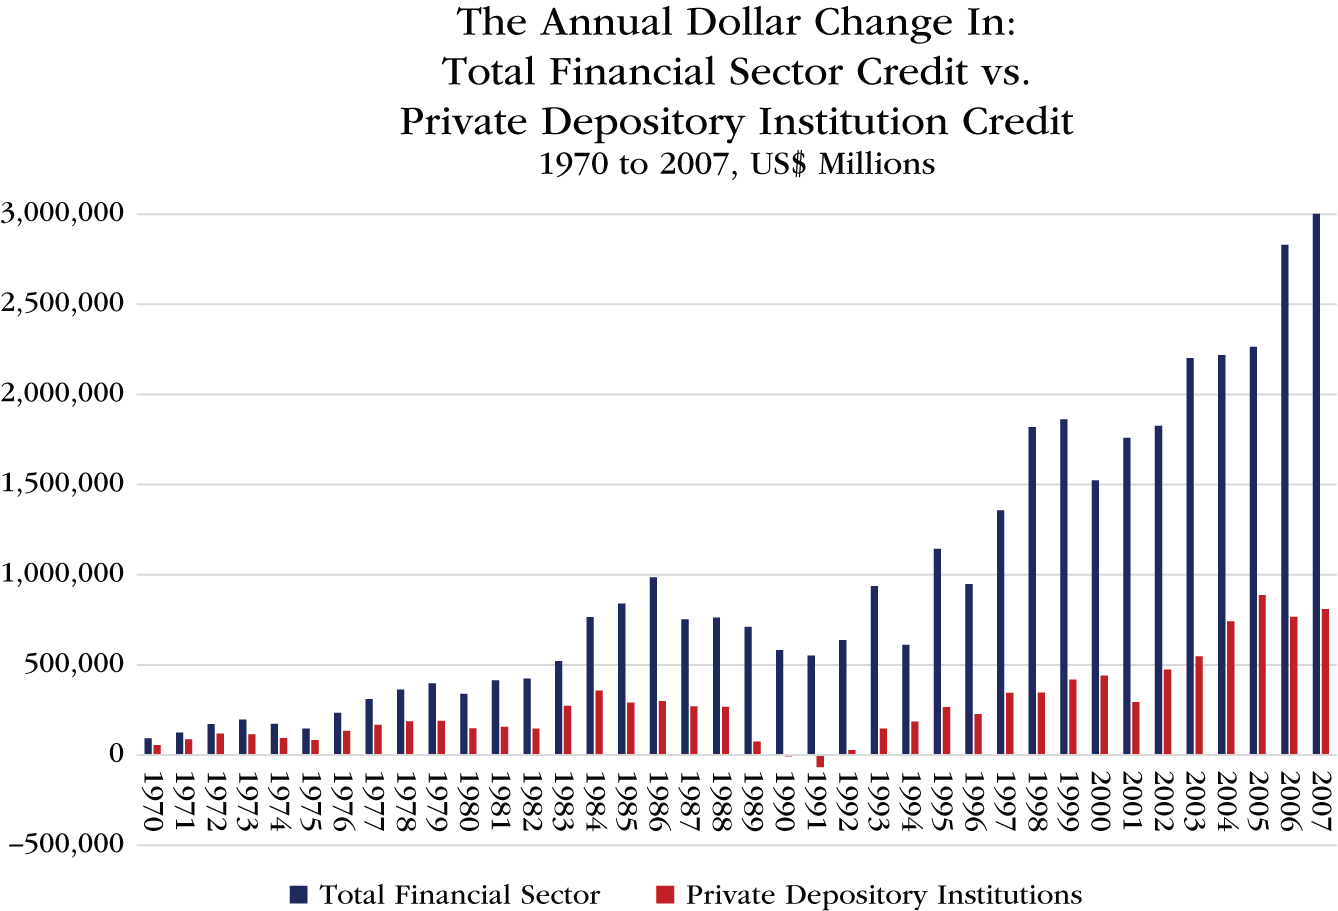
CHART 9.5 The Annual Dollar Change in Total Financial Sector Credit vs. Private Depository Institution Credit, 1970 to 2007
Source: Data from the Financial Accounts of the United States, 1970–2007, The Fed
The private depository institutions' market share of total financial credit had ranged between 56% and 62% from the end of World War II to 1970. However, after 1972, it began to decline steadily, falling to just 29% by 2007. The market share of the rest of the financial sector, the non-bank creditors, surged from 40% in 1972 to 71% in 2007, as shown in Chart 9.6.
The Non-Bank Financial Sector Creditors
So, what are the non-bank institutions that make up the financial sector along with the private depository institutions?

CHART 9.6 Market Share of Credit Extended by the Financial Sector: Private Depository Institutions vs. the Rest of the Financial Sector, Percentage of Total, 1945 to 2007
Source: Data from the Financial Accounts of the United States, 1945–2007, The Fed
The financial sector is comprised of 18 types of lenders. They are shown in Table 9.1, listed according to the amount of credit provided by each in 2007.
Private depository institutions are the largest type of lender in the financial sector. They accounted for $11 trillion of the $38 trillion of credit that had been extended by the financial sector in 2007.
The government-sponsored enterprises and GSE-backed mortgage pools came next with $7.3 trillion of credit extended, followed by asset-backed securities issuers with $4.4 trillion and life insurance companies with $2.9 trillion.
The growth in these four largest financial sector creditors from 1945 to 2007 is shown in Chart 9.7 and Chart 9.8. Those charts also include two other lines: the first shows the increase in the amount of credit extended by the Fed; the second the increase in the amount of credit extended by all the rest of the financial sector (i.e., the 13 other types of financial sector creditors, combined).
TABLE 9.1 The Financial Sector: 2007
Source: Data from the Financial Accounts of the United States, The Fed
|
Credit Provided by the Financial Sector: 2007 |
|
|
US$ Millions |
|
|
Private Depository Institutions |
11,012,462 |
|
GSEs & GSE-Backed Mortgage Pools |
7,293,959 |
|
ABS Issuers |
4,394,258 |
|
Life insurance companies |
2,864,421 |
|
Mutual funds |
2,100,121 |
|
Money market funds |
1,992,717 |
|
Finance companies |
1,822,058 |
|
Security brokers and dealers |
1,128,635 |
|
Federal government retirement funds |
1,058,184 |
|
Property–casualty insurance companies |
903,235 |
|
State & local Govt. employee defined benefit retirement funds |
869,657 |
|
Private pension funds |
767,985 |
|
The Fed |
740,611 |
|
Funding corporations |
495,690 |
|
REITS |
246,474 |
|
Closed-end funds |
167,173 |
|
Holding companies |
59,894 |
|
Exchange-traded funds |
34,692 |
|
Total |
37,952,226 |

CHART 9.7 A Breakdown of the Market Share of Financial Sector Creditors
Source: Data from the Financial Accounts of the United States, 1945–2007, The Fed
The Culprits
The US economy was profoundly impacted by the credit extended by the government-sponsored enterprises (GSEs) from the early 1970s and by the credit extended by the issuers of asset-backed securities from the mid-1980s.
The credit provided by the GSEs, primarily Fannie Mae and Freddie Mac, rose from only 3% of total financial sector credit in 1969 to 22% in 2002. At its peak, in 2007, GSE credit expanded by $862 billion in that one year alone. By the end of 2007, total GSE-related credit outstanding reached $7.3 trillion. See Charts 9.7 and 9.8, which show the breakdown of the market share of the financial sector creditors in dollars and percent terms.
The credit that Fannie and Freddie pumped into the economy by acquiring or guaranteeing mortgages drove up property prices and was instrumental in creating the US property bubble that blew apart in 2008.
The issuers of asset-backed securities were equally culpable. Asset-backed securities are made up of a pool of assets such as mortgages, credit cards, auto loans, equipment leases, corporate loans, and trade receivables. This segment of the financial sector only began extending credit on a meaningful scale in 1983. By 2007, they had provided $4.4 trillion of credit or 12% of all the credit extended by the financial sector. Their annual credit growth peaked at roughly $750 billion in both 2005 and 2006. The money they lent played a leading role in inflating the credit bubble that developed in the United States in the years leading up to 2008.

CHART 9.8 A Breakdown of the Market Share of Financial Sector Creditors: Percentage of Financial Sector Credit, 1945 to 2007
Source: Data from the Financial Accounts of the United States, 1945–2007, The Fed
Chart 9.9 compares the annual credit growth of the private depository institutions, the GSEs and the issuers of asset-backed securities (ABS) each year between 1970 to 2007. It clearly illustrates the rapid rise of the GSEs and the ABS issuers as credit providers, particularly after the mid-1980s.
Most strikingly, the growth in credit extended by the GSEs exceeded that of the private depository institutions during 12 out of the 19 years between 1989 and 2007. By 2007, the GSEs and the issuers of asset-backed securities, combined, had extended $11.7 trillion of credit in total, compared with only $11.0 trillion for the commercial banks.
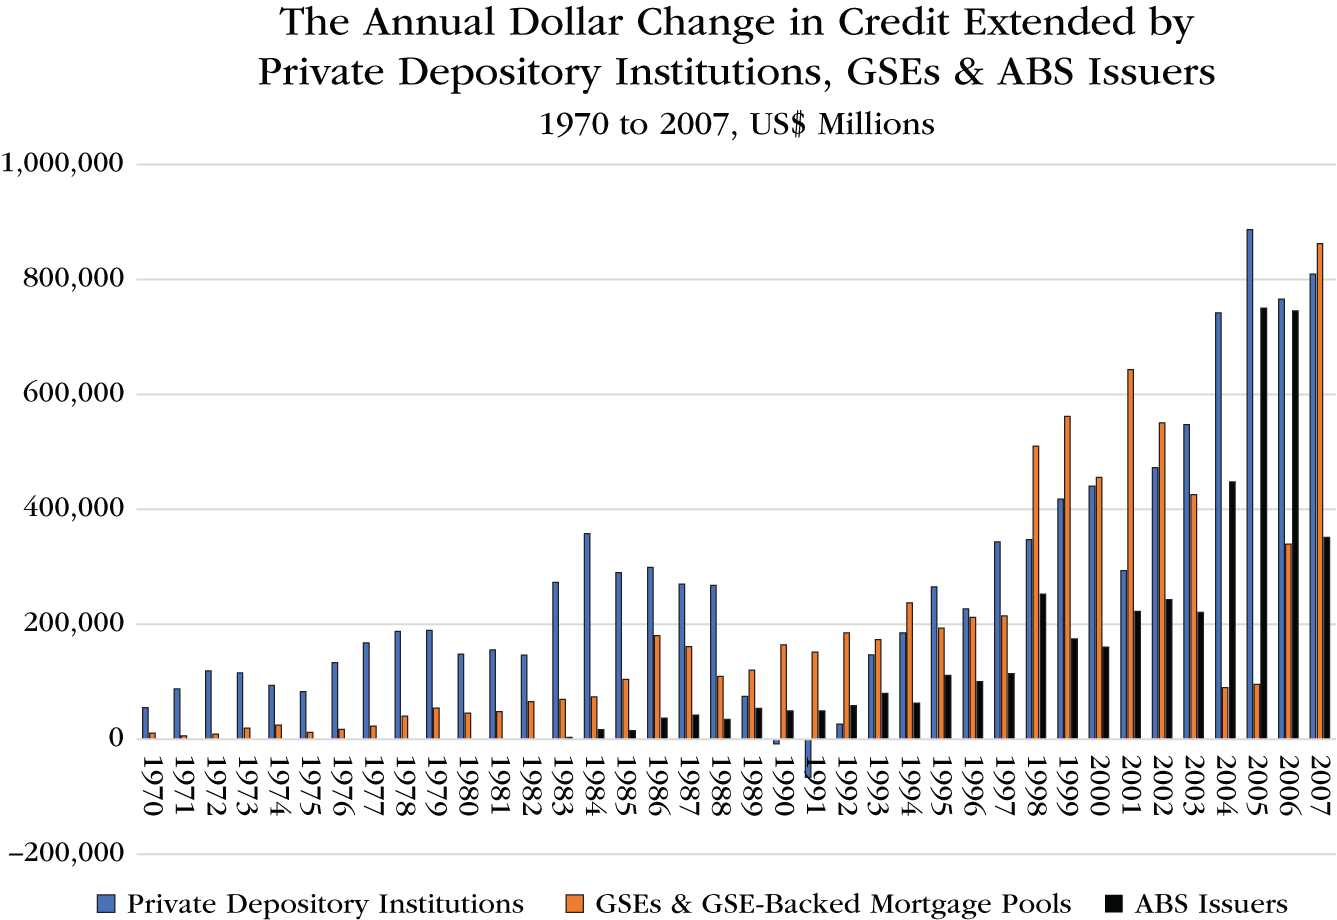
CHART 9.9 The Annual Dollar Change in Credit Extended by Private Depository Institutions, GSEs & ABS Issuers, 1970 to 2007
Source: Data from the Financial Accounts of the United States, 1970–2007, The Fed
Finally, the rest of the financial sector combined (the financial sector excluding the private depository institutions, the GSEs, ABS-issuers, life insurance companies, and the Fed) had $11.6 trillion in total credit outstanding in 2007. That amounted to 31% of all financial sector credit, up from only 9% in 1945.
The three largest among these in 2007 were mutual funds, money market funds and finance companies with $2.1 trillion, $2.0 trillion, and $1.8 of credit extended, respectively. See Chart 9.10.

CHART 9.10 The Largest of the Remaining Financial Sector Creditors (those with more than $750 billion credit extended in 2007), 1945 to 2007
These non-bank credit providers injected credit into the financial markets helping to further inflate the asset price bubbles there.
Funding Through Credit Creation
The extension of $27 trillion of credit by non-bank financial sector lenders fueled US economic growth and ultimately blew the economy into a bubble. This process will be described in greater detail in Chapter 11.
The sum of $27 trillion is an extraordinarily large amount of money. It is not possible to fully understand the growth and evolution of the US economy during recent decades without understanding where the money came from that financed the extension of so much credit.
The appendix to this chapter explains in detail (perhaps too much detail for the general reader) how the non-bank financial sector creditors financed the credit they extended. In short, it shows that the non-bank creditors in the financial sector create credit when they extend loans, just as the banks do.
Credit Without Reserves
As the non-bank creditors came to dominate the financial sector, debt rather than deposits began to supply the majority of funding that financed financial sector lending. Chart 9.11 shows that debt surpassed deposits as the largest source of financial sector funding in 1994. By 2007, financial sector debt was twice as large as the level of deposits it held.

CHART 9.11 The Financial Sector Funding: Deposits vs. Debt, 1945 to 2007
Source: Data from the Financial Accounts of the United States, 1945–2007, The Fed
The commercial banks, which relied on deposits, were required to hold liquidity reserves at the Fed. Institutions that financed themselves by issuing debt instruments were not. Therefore, as the financial sector grew less and less dependent on deposits, the overall level of liquidity reserves it held relative to the amount of credit it extended shrank. Chart 9.12 shows that whereas the ratio of reserves held at the Fed as a percentage of total financial sector credit was above 8% in the late 1940s; by 2007 it had declined to just 0.04%.
As the crisis of 2008 approached, just as there was no gold to back the money the Fed created, there were effectively no liquidity reserves to back the credit that the financial sector had created.
Given that liquidity reserve requirements had for all intents and purposes been abolished, the only constraint on how much credit the financial sector could create was the ability of the debtors to pay interest on the money they had borrowed; and that was a constraint that the chief executives of America's financial institutions chose to ignore.

CHART 9.12 Bank Reserves at the Fed as a Percentage of Total Financial Sector Credit, 1945 to 2007
Source: Data from the Financial Accounts of the United States 1945–2007, The Fed; and the Federal Reserve’s Annual Report for 2017
Appendix
Where Does the Money Come From?
Only the private depository institutions can accept deposits. The non-bank financial sector creditors cannot. The credit extended by the financial sector far exceeds the amount of deposits held by the private depository institutions, however. Chart 9.13 shows that by 2007 the financial sector had extended $38 trillion of credit, but that the private depository institutions held only $8.5 trillion of deposits.

CHART 9.13 Total Credit Provided by the Financial Sector vs. Total Deposits of Private Depository Institutions, 1945 to 2007
Source: Data from the Financial Accounts of the United States, 1945–2007, The Fed
Where, then, does the financial sector obtain the rest of the money it extends as credit? The answer is that it creates that money through the process of extending credit, just as the commercial banks create money (i.e., deposits) and credit when they make loans. The process is very similar to money creation by banks in a system of fractional reserve banking, but it is more complex due to the greater number of financial intermediaries involved.
The next few pages show how bank deposits were transformed into other types of financial sector liabilities as the US financial system grew and evolved from World War II to 2007. They also illustrate how those new liabilities funded the creation of still more credit.
Just Like the Banks
As explained in the previous chapter, when commercial banks extend credit, either by making a loan or by acquiring a debt security, they create deposits. Loans and investments appear as assets on the banks' balance sheets, while deposits are recorded as liabilities.
Those deposits are considered to be one type of money and they are counted as part of the money supply. Bank deposits make up by far the largest part of the monetary aggregate, M2.
When non-bank creditors within the financial sector extend credit by making a loan or an investment that also sets off a process that results, not only in credit creation, but also in the creation of liabilities that finance additional credit creation. The extension of credit creates new assets and new liabilities within the broader financial sector. If the credit is extended as a loan, that loan is recorded as an asset on the balance sheet of the entity that extended the loan. Similarly, if the credit is extended through the acquisition of a bond, then the bond is recorded as an asset on that institution's balance sheet.
What the recipient of the loan or the seller of the bond ultimately does with the money they receive determines the kind of liability that is created within the financial sector. If they deposit the money into a commercial bank and leave it there, it becomes a deposit liability of a commercial bank and, consequently, part of the money supply. On the other hand, if they use the money to buy a new bond issued by Fannie Mae2, for instance, that money makes it possible for Fannie to obtain additional financing; and that financing is recorded as a debt liability on the balance sheet of Fannie Mae. It adds to the total liabilities of the financial sector, but it does not increase the money supply, since, unlike commercial bank deposits, the liabilities of the GSEs are not considered to be “money” and are not included as part of the monetary aggregates. Nevertheless, the liability that has been created on Fannie Mae's balance sheet enables Fannie Mae to extend more credit.
Therefore, the key to understanding how the broader financial sector creates credit, just as commercial banks do, is to look at the liabilities of the non-bank creditors in the same way that we look at bank deposits. Both allow the creation of more credit. The only difference is that bank deposits are considered to be money and part of the money supply, whereas the liabilities of non-bank entities within the broader financial sector are not considered to be money or part of the money supply.
The Deposits Escaped from the Banks
Until the early 1970s, most individuals and businesses held the greatest part of their savings as deposits in banks or credit unions. There were few other alternatives. After 1970, however, the financial sector began offering individuals and businesses alternative investment vehicles, such as mutual funds and money market funds. From that point, money began leaking out of commercial bank deposit accounts and moving into other kinds of products, often in search of higher returns.
Afterwards, what had been a relatively straightforward process in which the private depository institutions created money and credit through the system of fractional reserve banking became more complicated.
Bank deposits gradually ceased to be the most important source of funding for the financial sector because depositors took their money out of banks and invested it in the other investment products that non-bank financial institutions began to offer them.
The Creation of Non-deposit Liabilities by Commercial Banks
The way the financial sector created money and credit evolved during the second half of the twentieth century. To understand this evolution, let's first look at the commercial banks and the other private depository institutions to see how their pattern of extending credit changed. We will find that over this period the financial sector began lending relatively less to non-financial sector end users of the funds, such as the federal government and state and local governments, and relatively more to other entities within the financial sector, thereby providing them with funds they could use to extend credit themselves.
At the end of World War II, investments in US government bonds accounted for a full 72% of all the credit extended by the private depository institutions. Loans made up only 22% of their total portfolio of loans and investments. The composition of these institutions' portfolios changed very rapidly after the war, however. By the early 1960s, the relative proportion of government bonds and loans in the private depository institutions' portfolios had been reversed, with the former falling to below 20% of the total and the latter rising above 70%.
Between the mid-1960s and 2007, loans continued to account for 70% to 80% of these institutions' total assets. Their holdings of government securities continued to decline, however. Meanwhile, their investments in municipal securities, GSE debt and corporate bonds grew. These changes are shown in Chart 9.14.
The changes in the composition of the private depository institutions' investment portfolio can be seen much more clearly in Chart 9.15, which presents the breakdown of the debt securities they owned between 1945 and 2007.
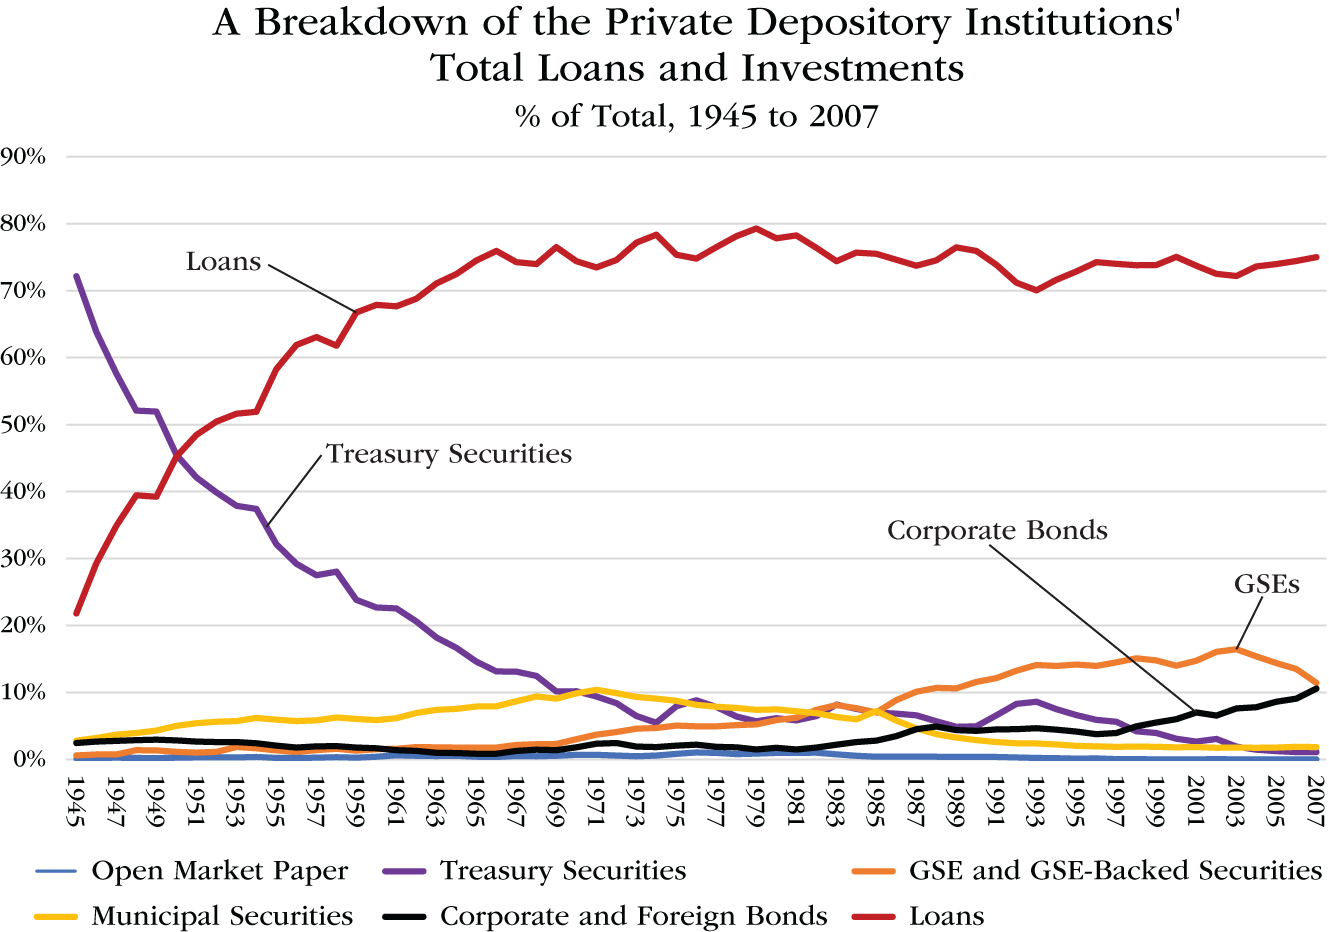
CHART 9.14 A Breakdown of the Private Depository Institutions' Total Loans and Investments, Percentage of Total, 1945 to 2007
Source: Data from the Financial Accounts of the United States, 1945–2007, The Fed
There it can be seen that Treasury securities, which accounted for 92% of all the debt securities owned by these institutions in 1945, had fallen to just 4% of the total by 2007. From the end of the war to the mid-1970s, the private depository institutions' holdings of municipal securities (bonds sold by state and local governments) rose rapidly and partially offset the decline in the holdings of Treasury securities. During the first half of the 1970s, these institutions held more municipal securities than any of the other types of debt securities.
After the mid-1970s, however, investments in municipal securities declined significantly relative to the size of the entire portfolio of debt securities. The private depository institutions' investments in GSE debt accelerated from the late 1960s and became the largest type of debt security held by private depository institutions from the mid-1980s. Next, the private depository institutions' investments in corporate bonds grew rapidly beginning in the early 1980s.

CHART 9.15 A Breakdown of the Debt Securities Owned by the Private Depository Institutions, Percentage of Total, 1945 to 2007
Source: Data from the Financial Accounts of the United States, 1945–2007, The Fed
By 2007, GSE securities plus corporate bonds accounted for 88% of all the debt securities held by the private depository institutions, whereas federal government and municipal securities, combined, made up only 11% of the total.
That year the private depository institutions held $1.3 trillion of GSE-related debt and $1.2 trillion of corporate bonds, versus just $200 billion of municipal securities and $120 billion of Treasury securities, as shown in Chart 9.16.
This shift in the composition of the private depository institutions' investment portfolio away from federal and state and local government debt and into debt issued by the GSEs and by corporations is significant because it brought about a fundamental change in the way the financial sector financed the credit it created.

CHART 9.16 A Breakdown of the Debt Securities Owned by the Private Depository Institutions, 1945 to 2007
Source: Data from the Financial Accounts of the United States, 1945–2007, The Fed
When the federal government or state and local governments borrowed from the private depository institutions by issuing bonds, that borrowing served only to finance government expenditure. On the other hand, when the GSEs issued bonds, their borrowing served to finance new lending by the GSEs themselves, which allowed credit creation to occur outside the commercial banks and within the broader financial sector.
The same is also true for much of the private depository institutions' holdings of corporate bonds, because a large portion of those corporate bonds were bonds that had been issued by borrowers from within the financial sector, including bonds issued by the issuers of asset-backed securities. At the end of 2007, the total amount of domestic corporate bonds outstanding amounted to $9.4 trillion. Of that amount, $5.9 trillion (or 63%) had been issued by financial sector entities, including $3.6 trillion of corporate bonds that had been issued by the issuers of asset-backed securities.
When the private depository institutions invested in corporate bonds issued by other financial sector institutions, that provided funds that allowed those institutions themselves to extend credit, permitting credit creation to occur outside the private depository institutions and within the broader financial sector.
Stepping back, then, and reconsidering the process of money and credit creation by the commercial banks and other private depository institutions through the system of fractional reserve banking, we can see that the commercial banks invested some of the money (deposits) they created into debt instruments issued by the GSEs, the issuers of asset-backed securities and other non-bank financial sector institutions. That investment provided funding that allowed those entities to extend additional credit. In other words, from the late 1960s, a significant amount of the deposits that were being created by the commercial banks began to be invested by the commercial banks into debt securities issued by non-bank financial sector institutions rather than being extended as traditional bank loans.
The commercial banks were not required to hold liquidity reserves against the debt securities they bought, whereas they were required to hold reserves against their customers' deposits. Moreover, the GSEs, the ABS issuers, and the other non-bank financial sector institutions were not required to hold any liquidity reserves against the liabilities on their balance sheets. The net result was more credit creation and fewer liquidity reserves throughout the entire financial sector and throughout the economy more broadly.
The Creation of Financial Sector Liabilities (and Credit) by the Non-bank Financial Sector Creditors
The section above focused on the evolution of the composition of the private depository institutions' investment portfolio and the impact that change had on the way the financial sector creates credit. It explained that as the private depository institutions increased their holdings of bonds issued by the GSEs, the issuers of asset-backed securities and other non-bank financial sector institutions, they supplied funds that allowed those entities to extend additional credit. However, the private depository institutions provided only a portion of the funding the broader financial sector required.
In 2007, private depository institutions provided less than 20% of the GSEs' total funding and less than 30% of the funding of the ABS issuers. The rest of the financing came from other sources. Some of that funding came from abroad, as will be explained in the next chapter. The majority, however, was derived from credit that the broader financial sector actually created itself.
Up through the late 1960s, most Americans kept the greatest part of their savings in bank deposits. The financial sector was tightly regulated, and few other investment vehicles were widely accessible to the general public.
From the early 1970s, however, new investment channels such as mutual funds and money market funds emerged that offered different ways for the public to save and invest. Money that would have traditionally stayed in commercial banks as deposits began to flow out of the banks and onto the balance sheets of other credit providers within the financial sector.
Expressed differently, deposits that had been created by commercial banks did not all remain as deposits within the banks or even as other kinds of non-deposit liabilities at the banks. Instead, those deposits began to be withdrawn from the banks and placed with other financial sector institutions where they were recorded on the balance sheet not as deposits, but as debt securities or mutual fund shares. Although the deposits of the financial sector continued to grow, the non-deposit liabilities grew much more.
First consider the role of mutual funds. When banks extended loans, those loans still created deposits when the recipients of the loans deposited the money they had borrowed into their bank accounts. That money did not necessarily stay in the banking system as deposits for long, however. For instance, some of the deposits were withdrawn from the banks and invested in mutual funds instead.
At that point, the mutual funds had the money that the banking system had created by extending credit; and the mutual funds were free to invest that money in the stock market, in government bonds, in corporate bonds, in bonds issued by Fannie Mae and Freddie Mac3 or elsewhere. In other words, when deposits left the banks to be invested in mutual funds, the money the commercial banks had created ceased to be bank deposits. Instead, it was transformed into other kinds of liabilities, both equities and debt securities.
Next, look at the role played by the GSEs. The GSEs became important creditors from the early 1970s, and, in the process, they began to create credit. In most instances, the GSEs did not originate mortgage loans themselves. Instead, commercial banks or mortgage companies, like Countrywide, would extend a mortgage loan to a home buyer. The mortgage originator would keep an origination fee and then either sell the mortgage to Fannie Mae or Freddie Mac, or, more often, obtain a guarantee for that loan from Fannie or Freddie (which the GSEs provided for a fee) and then sell the GSE-guaranteed mortgage to some other investor.
The credit instrument created by the bank, i.e., the mortgage, would move from the bank's balance sheet to the balance sheet of the investor that had acquired the mortgage, thereby reducing the size of the bank's assets and, consequently, the amount of capital the bank was required to hold against its assets. This permitted an expansion of leverage throughout the financial system since the GSEs and the other non-bank investors were not required to hold any liquidity reserves against the bonds they issued to finance their mortgage purchases, and also because the GSEs had much lower capital adequacy requirements than the banks.
Meanwhile, when the individual who took out the mortgage deposited the money he received from the mortgage into his bank account (and later transferred it to the bank account of the person from whom he would acquire his new home) that deposit enabled the banking system to extend still more loans or to invest in additional debt securities. The process of money and credit creation through the banking system not only continued, but it was also facilitated and accelerated by the intermediation of Fannie Mae, which could raise funds by selling bonds (carrying an implicit government guarantee) without having to maintain any liquidity reserves against those bonds.
Some of the deposits that were created in this process were withdrawn from the banks and used to buy the bonds that Fannie and Freddie sold to finance their rapidly growing investment portfolio which was made up of mortgages and of the mortgage pools that they had guaranteed.
As Fannie and Freddie grew by selling ever larger amounts of bonds, they acquired or guaranteed an ever-larger portfolio of mortgages. The effect was to push up property prices and to increase the overall leverage of the financial sector and the economy in general.
Later, the issuers of asset-backed securities followed a similar strategy as the GSEs, producing a similar effect. Many, and probably the majority, of the issuers of asset-backed securities, were in reality special purpose vehicles (SPVs) created by the largest commercial banks and the large investment banks, such as Citigroup and Lehman Brothers. The banks and investment banks originated mortgages and consumer credit and then repackaged that debt into securities with various degrees of risk, which they sold to their own SPVs and other investors, after keeping an origination fee. Even though in most cases the banks and investment banks remained the true owners of the SPVs, they were not required to hold liquidity reserves against those SPVs' liabilities.
Moreover, in many cases, the banks took their customers' deposits and invested them in the SPVs they controlled, reducing the overall level of deposits in the banking system, and minimizing the level of liquidity reserves the banks were required to hold against such deposits. The SPVs then used the funds received in this way to extend still more credit.
Again, the original extension of credit by the banks set off the process of money and credit creation, with the ABS issuers acting as intermediaries to make it appear that the risky assets were not on the books of the banks. The more credit that was extended in this way, the more deposits (money) flooded back into the banks, financing still more lending. In this way, leverage increased throughout the economy and drove asset prices higher.
Notes
1. David Wighton, “What we have learned 10 years after Chuck Prince told Wall St to keep dancing,” Financial News. https://www.fnlondon.com/articles/chuck-princes-dancing-quote-what-we-have-learned-10-years-on-20170714
2. The Federal National Mortgage Association, a US government-sponsored enterprise, is commonly known as Fannie Mae.
3. The Federal Home Loan Mortgage Corporation is a US government-sponsored enterprise commonly known as Freddie Mac.