
PART II
Introduction
After dollars ceased to be backed by gold five decades ago, a radical acceleration of credit growth occurred that fundamentally altered the way economic growth is generated. Part Two describes the proliferation of credit in the United States since 1971. It details the impact that very rapid credit growth has had on the US economy. It explains how the economy became dependent on credit growth, and it discusses what these developments mean for the US economy during the years ahead. In this way, this part of the book completes the description of the Money Revolution that Part One began.
Total credit in the United States exceeded $1 trillion for the first time in 1964. By 2007, it had expanded 50-fold to $50 trillion. That phenomenal growth in credit set off a worldwide economic boom that pulled hundreds of millions of people around the world out of poverty.
However, at the same time, economic growth became dependent on credit growth. When the heavily indebted US private sector began to default on its debt in 2008, credit began to contract and the US – and the global – economy began to spiral into depression.
Fortunately, US policymakers had learned from the policy errors of the early 1930s. Between 1930 and 1933, credit had been allowed to contract, and the economy collapsed. That mistake would not be repeated. Between 2007 and 2014, the government nearly doubled its debt, from $9.2 trillion to $18.1 trillion, while the Fed concurrently created $3.5 trillion to help finance that expansion of government debt at low interest rates. Consequently, credit growth resumed, and the economy recovered.
Most surprisingly, this extraordinarily aggressive combination of fiscal and monetary stimulus did not cause inflation. Milton Friedman taught that “Inflation is always and everywhere a monetary phenomenon.” Events following the financial crisis of 2008 have demonstrated that Friedman was mistaken.
There are three lessons to be learned from the decades-long surge in credit that led to the crisis of 2008 and from the policy response that successfully resolved that crisis. First, following the Money Revolution described in the first two parts of this book, our economic system requires credit growth to generate economic growth. Without credit growth there will be a depression. Second, there are limits as to how much the private sector can borrow. Third, it is possible for the US government to borrow many trillions of dollars and for the Fed to create trillions of dollars to help finance that debt over a short space of time, without causing high rates of inflation.
The inescapable conclusion that must be drawn from these lessons – lessons that were strongly reinforced by the results of the government's aggressive economic policy response to the COVID-19 pandemic - is that the US government will have to continue to borrow heavily during the years ahead to keep the economy from collapsing into a new depression. This begs the question: How should the government spend the money it will be forced to borrow?
The first three chapters of Part Two describe the sharp surge in credit creation by the US banking sector, by the broader US financial system, and by foreign central banks, particularly during the years after dollars ceased to be backed by gold. Chapter 11 then shows how credit growth became the principal driver of economic growth. Chapter 12 discusses the financial crisis of 2008 and the forceful policy response that successfully resolved it. Chapter 13 examines how, and to what ends, the Fed conducted monetary policy between the crisis of 2008 and 2019, while Chapter 14 describes the extraordinary measures the Fed implemented to help carry the economy through the COVID-19 pandemic during 2020 and the first half of 2021. Chapter 15 surveys the differing causes of inflation each decade from the 1920s to the present.
Part Three will show that rather than threatening US prosperity, the circumstances brought about by the Money Revolution have opened up extraordinary opportunities that the United States must grasp and fully realize.
CHAPTER 8
Only commercial banks and trust companies can lend money that they manufacture by lending it.
Irving Fisher1
The Fed's power over the economy stems from its ability to create or destroy credit. When the Board of Governors of the Federal Reserve System decides economic growth should accelerate, the Fed takes actions that cause credit to expand more rapidly. When it feels the economy is at risk of overheating, it adopts policies that cause credit growth to slow, or, if necessary, to contract. Monetary policy involves nothing more than implementing actions that determine the rate of credit expansion.
Part One demonstrated how the Fed creates credit directly, Federal Reserve Credit, when it makes deposits into the reserve accounts that commercial banks hold at the Fed.
This chapter will show that the Fed also controls the amount of credit that the banking system can create. This power is of crucial importance to the conduct of monetary policy and to the economy because, under normal circumstances, the banking system creates a great deal more credit than the Fed does. For that reason, the Fed generally achieves its policy objectives by influencing the volume of bank credit.
This chapter begins by explaining how the banking system creates credit. Next it describes the tools and methods the Fed employs to control the amount of credit the banking system creates. Finally, it shows that over time the Fed steadily revised its regulations to enable the banking system to create ever larger amounts of credit in order to stimulate economic growth. Eventually, these changes facilitated the creation of so much credit that credit growth became the most important driver of economic growth, fundamentally transforming the nature of our economic system.
Subsequent chapters will show that economic growth became dependent on credit growth, which explains why the Fed is so desperate to ensure that credit continues to expand. The Fed understands that credit growth drives the economy and that if credit contracts there will be a depression.
Commercial Banks Create Money, Too
Part One described how the Fed creates money. But, the Fed is not alone in its ability to create money. The commercial banking system also creates money by extending loans and creating deposits. The deposits that individuals, businesses, and other entities hold in commercial banks are considered to be a second kind of money because deposits can be withdrawn as cash and spent, or they can be spent simply by writing a check on a deposit in a checking account.
The money that a central bank creates is called base money or the monetary base. As explained in Part One, the US monetary base is comprised of the reserves that commercial banks hold in their reserve accounts at the Fed, and currency.
“M1” and “M2” are broader measures of money that include money that the banking system creates.
M1 is defined as the sum of currency held by the public and transaction deposits at depository institutions (i.e., checking account deposits).
M2 is defined as M1 plus savings deposits, small-denomination time deposits and retail money market mutual fund shares.
Chart 8.1 shows the monetary base, M1 and M2 for the United States from 1959 to 2007.
M2 is far larger than the monetary base, meaning that commercial banks in the US create far more money than the Fed does.
This chapter will show how the commercial banking system creates money (i.e., bank deposits) when it extends loans. It will also show that the money created in this way allows the banking system to extend still more credit and to create still more money in a circular process that ultimately results in the creation of an amount of credit and money that is a multiple of the initial loan.

CHART 8.1 The Monetary Base, M1 & M2, 1959 to 2007
Source: Data from FRED Graph Observations, 1959–2007, Federal Reserve Economic Data
The maximum amount of money and credit that can be created through this process is determined by regulations governing the banks. We will see that the amount of money and credit created by the US banking system became extraordinarily large as bank regulations governing this process were relaxed.
How the Process Works
When a bank accepts a deposit, it is legally required to set aside part of that deposit as “reserves” to ensure that it will have enough liquid assets to meet its customers' requests to withdraw their deposits at any time.2 Every bank must hold its reserves either in its account at the Fed or else as vault cash, which is physical cash at the bank's place of business.
Since the depositors are generally content to leave their money in their bank accounts for long periods of time and generally don't all withdraw their money at the same time, banks are only required to hold a fraction of their total deposits as reserves. The Fed decides the amount of reserves that banks must hold as a percentage of their deposits. This ratio is called the required reserve ratio. For example, if the required reserve ratio is 20%, banks must hold $20 of reserves at the central bank (or as vault cash) for every $100 of deposits the banks accept from their customers.
Table 8.1 demonstrates how the process works, assuming an initial deposit of $100 and a required reserve ratio of 20%.
When the initial deposit of $100 is made, the bank that receives that deposit sets aside a reserve of $20 and then lends out the remaining $80 in order to earn interest income. Regardless of how the recipient of that loan uses the money, before long it will be deposited somewhere back in the banking system. It makes no difference if the $80 is deposited into one bank or several banks. Either way, $16 (20% of $80) will be set aside by the banking system as reserves and the remaining $64 will be lent out again. The process will be repeated again and again until ultimately, the banking system will have set aside $100 of reserves and extended $400 of loans. In the process, the amount of deposits in the banking system grows to $500.
TABLE 8.1 Money Creation Through Fractional Reserve Banking
|
Money Creation through Fractional Reserve Banking |
|||
|
Assuming: |
The “Money Multiplier” is: |
||
|
1: As initial deposit of $100 by the Fed |
1 ÷ the Required Reserve Ratio |
||
|
2: A Required Reserve Ratio of |
1 ÷ 20% = 5 times |
||
|
20% |
$100 × 5 = $500 |
||
|
Deposit |
Reserves |
Loan |
|
|
Round 1 |
100 |
20 |
80 |
|
Round 2 |
80 |
16 |
64 |
|
Round 3 |
64 |
13 |
51 |
|
Round 4 |
51 |
10 |
41 |
|
Round 5 |
41 |
8 |
33 |
|
Round 6 |
33 |
7 |
26 |
|
Round 7 |
26 |
5 |
21 |
|
Round 8 |
21 |
4 |
17 |
|
Round 9 |
17 |
3 |
13 |
|
Round 10 |
13 |
3 |
11 |
|
Round 11 |
11 |
2 |
9 |
|
Round 12 |
9 |
2 |
7 |
|
Round 30 |
0.2 |
0.0 |
0.1 |
|
Round 31 |
0.1 |
0.0 |
0.1 |
|
Total |
500 |
100 |
400 |
Since bank deposits are considered to be a kind of money, by extending credit, the banking system can create an amount of money that is a multiple of the initial deposit. The multiple, known as the money multiplier, can be calculated as follows:
The money multiplier = 1 ÷ the required reserve ratio
Therefore, if the required reserve ratio is 20%, as in the example above, the money multiplier is 5 times (1 ÷ 20%) and the banking system can create an amount of money that is five times the initial deposit: $100 X 5 = $500.
If the required reserve ratio is 10%, the money multiplier is 10 times (1 ÷ 10%) and the banking system can create an amount of money 10 times the size of the initial deposit.
The lower the required reserve ratio, the more credit the banking system can create.
Two Factors Determine How Much Credit Banks Can Create
Two main factors determine the amount of credit that the banking system can create. Both are controlled by the Fed. The first is the required reserve ratio. The second is the level of Bank Reserves, also known as Reserve Balances. Over time, the Fed adjusted the regulations affecting these factors in a way that allowed an explosion of credit creation by the banking system. The Fed made these changes with the express purpose of allowing credit to expand in order to fuel additional economic growth.
The next section of this chapter shows how the Fed can control credit creation by the commercial banks by adjusting either the required reserve ratio or the level of Reserve Balances in the banking system. Subsequent sections then discuss the growth of the commercial banks' reserves, customer deposits and total loans and investments over three time periods (1914 to 1945, 1945 to 1970 and 1970 to 2007) in order to show the evolution of credit creation by the banking system over time and to highlight the extraordinary extent to which credit expanded relative to reserves after dollars ceased to be backed by gold five decades ago. Finally, the chapter concludes by discussing the regulatory changes that permitted credit creation by the banking system to expand so radically.
The Required Reserve Ratio
The Fed can tighten monetary conditions by raising the required reserve ratio. Typically, the banking system maintains only just enough reserves to meet the required reserve ratio. Therefore, when the Fed increases the required reserve ratio, the banking system is forced to contract its deposit base. To do that, it is forced to reduce its outstanding loans. As a result, credit then becomes less available, interest rates tend to rise and the economy tends to slow.
Conversely, the Fed can loosen monetary conditions by lowering the required reserve ratio, thereby allowing the banking system to extend more credit and, as a byproduct, create more deposits without breaching the new, lower required reserve ratio. As liquidity becomes more plentiful, interest rates tend to fall and economic growth tends to accelerate.
Expressed differently, increasing the required reserve ratio lowers the money multiplier, while lowering the required reserve ratio increases the money multiplier.
Bank Reserves
Next, consider how the Fed traditionally influenced the amount of credit the banking system could create by adding or deducting Bank Reserves through open market operations.
Before 2008, when reserves in the banking system were still scarce,3 if the Fed wanted the banking system to extend more bank loans, it would acquire a government bond and pay for that acquisition by making a deposit into the reserve account of the bank from which it bought the bond. For example, if the Fed acquired $1 billion worth of government bonds from a bank, it would deposit $1 billion into that bank's reserve account at the Fed. That deposit would directly increase the level of Reserve Balances of that bank, and, therefore, of the entire banking system, by $1 billion.
A higher level of Reserve Balances would allow the banking system to make additional loans while still satisfying the required reserve ratio. The additional credit creation by the banking system would stimulate the economy and generate more growth and employment.
On the other hand, if the Fed were concerned that the economy was overheating and threatened by rising inflation, it could force the banking system to contract the amount of money it had lent by draining reserves from the banking system.
For example, the Fed could sell some of the government bonds that it had acquired in the past. If the Fed sold $1 billion worth of bonds to a bank, it would hand the bonds over to the bank and, at the same time, debit that bank's reserve account at the Fed by $1 billion, thereby reducing the level of Reserve Balances in the banking system by $1 billion.
Assuming that there were no excess reserves in the banking system at the time of this transaction (and, typically, before 2008 there were not), the banking system would no longer have sufficient reserves to meet the statutory required reserve ratio. Therefore, it would be forced to reduce the size of its deposit base by calling in loans and contracting credit.
The contraction of bank credit would cause the economy to slow, putting an end to the inflationary pressures that had concerned the Fed.
In sum, then, by adjusting the level of Bank Reserves or the required reserve ratio, the Fed controlled the amount of credit the banking system could create, which, in turn, gave the Fed the power to speed up or slow down the growth rate of the US economy.
Credit Creation by Commercial Banks: 1914 to 2007
Credit creation by commercial banks has played a leading role in shaping the economic history of the United States and it will continue to do so in the future. This section briefly describes the developments that determined the amount of credit that commercial banks created between the establishment of the Federal Reserve System in 1914 and the economic crisis of 2008.
This history is divided into three parts in order to more clearly explain the most important events that affected the banks' ability to create credit. The first period, 1914 to 1945, covers World War I, the Great Depression, and World War II. The second period considers the period between the end of World War II and 1970, the year roughly corresponding to the time when dollars ceased to be backed by gold. The third period covers the years from 1970 to 2007, when credit “slipped its leash,” as the regulatory constraints that had earlier held credit creation in check were removed one after the other.
1914 to 1945
Today, gold movements into and out of the United States have no impact on the level of Bank Reserves or on the ability of the banking sector to extend credit. But the role of gold was very different up until the late 1960s. For instance, between 1914 and 1945, two large waves of gold inflows into the United States resulted in a surge in Bank Reserves, which, in turn, permitted a surge in credit creation.
US gold holdings nearly doubled between 1914, when World War I began, and 1917, when the United States entered the war. As that gold entered the US it was deposited in US banks and, as a result of increased deposits, those banks were required to set aside a higher level of reserves at the Fed. The next wave of gold inflows entered the US between 1933 and 1940. US gold holdings increased by 440% during those seven years.
Chart 8.2 shows those gold inflows into the United States. It also shows that Bank Reserves expanded as gold entered the country.
The growth in Bank Reserves permitted the commercial banks to extend more credit and, thereby, to create more deposits while remaining within the limits set by the required reserve ratio. Chart 8.3 compares the level of Bank Reserves to bank deposits and to the total loans and investments made by the banks between 1914 and 1945.

CHART 8.2 US Gold & Bank Reserves, 1914 to 1945
Source: Data from Banking And Monetary Statistics 1914 to 1941 and 1941 to 1970, and the Federal Reserve’s Annual Report for 2017
The surge in Bank Reserves between 1914 and 1920 (more easily seen in Chart 8.2) permitted a rapid expansion of bank credit (both loans and investments) and deposits. Reserves peaked in 1919 and then contracted by 7% by 1921. Credit and deposits also both contracted in 1921, causing a severe, but short-lived, economic depression that year.
Bank Reserves expanded by 48% between 1921 and 1928, while bank credit and bank deposits increased by 45% and 60%, respectively. The credit expansion during those seven years is the principal reason the Roaring Twenties roared.
When the boom of the 1920s turned to bust, creditors defaulted, banks failed and individuals withdrew their savings from banks. The sharp contraction of credit between 1929 and 1933 produced the Great Depression.
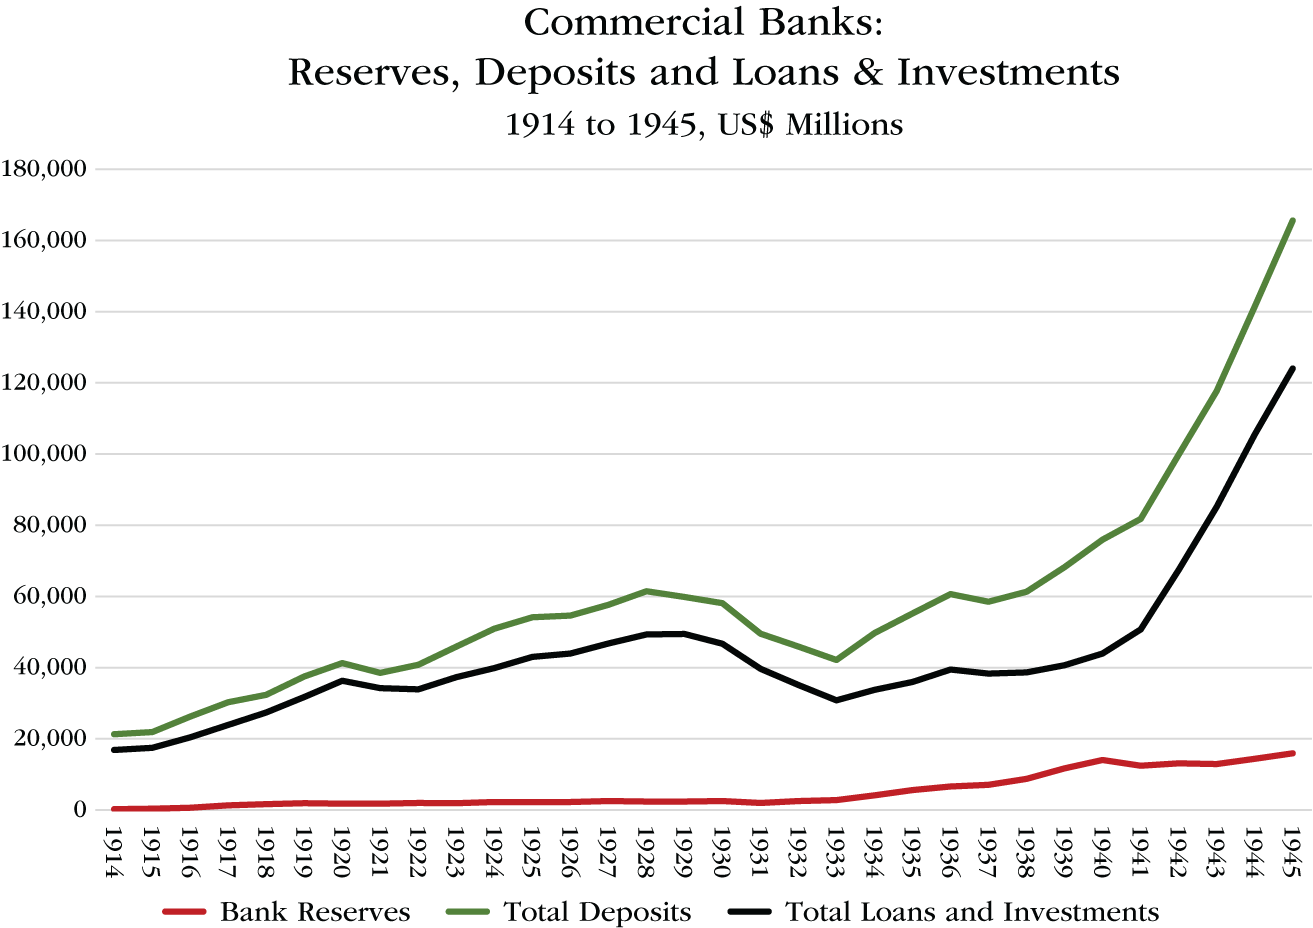
CHART 8.3 Commercial Banks: Reserves, Deposits, and Loans and Investments, 1914 to 1945
Source: Data from Friedman and Schwartz, “A Monetary History Of The United States,” Table A-2, p. 737; and the Federal Reserve’s Annual Report for 2017
When World War II began, credit surged as banks acquired government bonds to help finance the war. It is interesting to note that by the end of the war, government securities made up nearly 73% of the commercial banks' total loans and investments, up from 11% in 1930 and 40% in 1940. In other words, by 1945, nearly three-quarters of all bank credit outstanding was extended to the government (see Chart 8.4).
The surge in bank credit between 1940 and 1945 enabled the government to spend vast sums fighting the war. Credit-financed government spending during the war ended the Great Depression. It also produced a very large increase in deposits as a byproduct. Recall that when banks extend credit, they also create deposits through the money multiplier effect inherent to the system of fractional reserve banking.

CHART 8.4 Commercial Banks: Government Securities Held as a Percentage of Total Loans and Investments 1914 to 1945
Source: Data from Board of Governors of the Federal Reserve System (U.S.), 1935-. Banking and Monetary Statistics, 1914–1941; Board of Governors of the Federal Reserve System (U.S.), 1935-. Banking and Monetary Statistics, 1941–1970.
Chart 8.5 shows the ratio of Bank Reserves to bank deposits between 1917 and 1945. This chart does not represent the required reserve ratio set by the Fed. It depicts the actual ratio of reserves to deposits, reflecting numerous factors including the willingness of savers to hold their savings in banks as deposits, the willingness of banks to lend and the inflow of gold into the United States. It fluctuated in a narrow range between 4% and 5% from 1917 to 1931 because reserves increased nearly as much as deposits at commercial banks during those years. After 1931, however, the ratio began to move up very rapidly, first as bank deposits contracted during the Depression and then as Bank Reserves soared with the surge of gold inflows into the US beginning in 1934. The ratio peaked at 18.5% in 1940. These ample reserves made it possible for the commercial banks to extend vast amounts of credit by acquiring government bonds during World War II while still satisfying the statutory required reserve ratio. By the end of the war the ratio of reserves to deposits had fallen to 9.6%.

CHART 8.5 The Ratio of Bank Reserves to Bank Deposits, 1917 to 1945
Source: Data from Friedman and Schwartz, “A Monetary History Of The United States,” Table A-2, p. 737; and the Federal Reserve’s Annual Report for 2017
The ratio of deposits to Bank Reserves is the exact inverse of the ratio of reserves to deposits; and it is a good measure of leverage within the banking system. Chart 8.6 shows that the ratio of bank deposits to Bank Reserves fell from 25 times in 1931 to only 5 times in 1940, but then expanded again to 10 times in 1945.

CHART 8.6 The Ratio of Bank Deposits to Bank Reserves, 1917 to 1945
Source: Data from Friedman and Schwartz, “A Monetary History Of The United States,” Table A-2, p. 737; and the Federal Reserve’s Annual Report for 2017
Between 1914 and 1945, bank credit (total loans and investments) contracted three times: in 1920 and 1921, between 1930 and 1933 and in 1937, as shown in Chart 8.7. The first two contractions caused economic depressions. The third caused a recession within a depression.
On the other hand, during periods of rapid credit growth, as during World War I, most of the 1920s and, especially, during World War II, the economy boomed.
This pattern was recognized not only by economists, but by policymakers as well. During the years that have followed, the Fed has worked diligently in the effort to prevent credit from ever contracting again.

CHART 8.7 Total Loans and Investments: Annual Dollar Change, 1915 to 1945
Source: Data from Board of Governors of the Federal Reserve System (U.S.), 1935-. “Part I” in Banking and Monetary Statistics, 1914–1941; Board of Governors of the Federal Reserve System (U.S.), 1935-. Banking and Monetary Statistics, 1941–1970.
1945 to 1970
Bank credit did not contract during any year between 1945 and 1970. In fact, it grew very rapidly. Bank credit expanded more in 1958 than at the peak of World War II. And after 1961, it did so nearly every year, as shown in Chart 8.8.
The growth in Bank Reserves was pedestrian in comparison. Gold inflows, which had inflated Bank Reserves before World War II, peaked in 1949 and then turned into outflows, particularly after 1957. Consequently, the growth in Bank Reserves was unimpressive during this period; and the growth in reserves that did occur after 1963 was the result of open market operations by the Fed (see Chart 8.9).

CHART 8.8 Total Loans and Investments: Annual Dollar Change, 1915 to 1970
Source: Data from Board of Governors of the Federal Reserve System (U.S.), 1935-. “Part I” in Banking and Monetary Statistics, 1914–1941; Board of Governors of the Federal Reserve System (U.S.), 1935-. Banking and Monetary Statistics, 1941–1970.
The large extension of bank credit produced a similar rise in bank deposits, in another example of money creation by the banking sector. Chart 8.10 shows the growth in the reserves, deposits, and loans and investments of the commercial banks between 1914 and 1970.
Notice that during the postwar years, the commercial banks' loans and investments became larger than their deposit base. This occurred because the banks began to borrow some of their funds from the credit markets, rather than relying solely on deposits as they traditionally had done. This important development will be discussed in greater detail in Chapter 9.
Next, bank deposits grew much more rapidly than Bank Reserves. Chart 8.11 shows very clearly that that was the case.

CHART 8.9 US Gold & Bank Reserves, 1914 to 1970
Source: Data from Friedman and Schwartz, “A Monetary History Of The United States,” Table A-2, p. 737; and the Federal Reserve’s Annual Report for 2017
By 1970, the ratio of Bank Reserves to bank deposits had fallen from 18.5% in 1945 to just 3.7%, roughly on par with, and slightly below, where it had stood throughout the 1920s.
Inverting that ratio shows that in 1970 the commercial banks' deposits were 27 times as large as their reserves at the Fed, up from 10 times in 1945 and 5 times in 1940 (see Chart 8.12).
Consequently, by 1970, the leverage of the commercial banks (as measured by the ratio of deposits to reserves) exceeded the point reached at the peak of the Roaring Twenties. What would come next, however, would make that level of leverage appear highly conservative.
1970 to 2007
US gold reserves peaked in 1949, held fairly steady though 1957, and then began to fall rapidly afterwards as the US balance of payments deteriorated. In 1965, Congress eliminated the requirement that the Fed hold gold to back the reserves that commercial banks held at the Fed. Three years later, Congress freed the Fed from the obligation of holding gold to back the currency it issued. And, in 1971, with the breakdown of the Bretton Woods system, gold ceased to have any relevance whatsoever for the conduct of US monetary policy.

CHART 8.10 Commercial Banks: Reserves, Deposits, and Loans and Investments, 1914 to 1970
Source: Data from Friedman and Schwartz, “A Monetary History Of The United States,” Table A-2, p. 737; and the Federal Reserve’s Annual Report for 2017
Chart 8.13 shows that Bank Reserves continued to expand until 1986 even as the stock of US gold contracted. Reserves expanded due to open market operations (purchases) by the Fed.
However, what is most striking about this chart is how little Bank Reserves grew. In fact, they peaked in 1986 at just $46 billion and then fell sharply to a postwar low of only $8 billion in 2001. In 2007, Bank Reserves were $14 billion, which was $2 billion less than in 1945.

CHART 8.11 The Ratio of Bank Reserves to Bank Deposits, 1917 to 1970
Source: Data from Friedman and Schwartz, “A Monetary History Of The United States,” Table A-2, p. 737; and the Federal Reserve’s Annual Report for 2017
Given that bank deposits and bank credit are limited by the level of Bank Reserves and by the required reserve ratio, they, too, would have contracted in line with Bank Reserves after 1986 had the ratio of reserves the banks were required to hold relative to deposits remained unchanged.
Chart 8.14 dramatically illustrates that bank deposits and bank credit were not constrained by the depressed level of Bank Reserves, however. Both leapt phenomenally.
Bank deposits surged from $660 billion in 1945 to $8.5 trillion in 2007, while the credit extended by the banks as loans and investments rose even more from $720 billion to $11.4 trillion.

CHART 8.12 The Ratio of Bank Deposits to Bank Reserves, 1917 to 1970
Source: Data from Board of Governors of the Federal Reserve System (U.S.), 1935-. "Part I" in Banking and Monetary Statistics, 1914–1941; Board of Governors of the Federal Reserve System (U.S.), 1935-. Banking and Monetary Statistics, 1941–1970.
After 1970, credit growth by the commercial banks became so large each year that by comparison, the credit extended to finance World War II appears as only a very small blip in Chart 8.15, which shows the growth in credit extended by the commercial banks each year between 1915 and 2007.
Note that bank credit did contract once between 1970 and 2007, during 1990 and 1991. The United States experienced a recession as a result.
The ratio of Bank Reserves to bank deposits, sank from 10% in 1945 to only 0.16% in 2007.
The ratio of bank deposits to Bank Reserves shot up from 10 times in 1945 to 607 times in 2007 (having peaked at 681 times in 2005), reflecting a mind-boggling expansion of leverage in the banking system.
These ratios are shown in charts Chart 8.16 and Chart 8.17.

CHART 8.13 US Gold and Bank Reserves, 1914 to 2007
Source: Data from Friedman and Schwartz, “A Monetary History Of The United States,” Table A-2, p. 737; and the Federal Reserve’s Annual Report for 2017
Why Bank Credit Grew Much Faster than Bank Reserves
So, how was it possible that bank deposits and bank credit grew so much relative to Bank Reserves?
The level of Reserve Balances ceased to increase in line with the level of deposits in the banking system for five main reasons. First, in 1959 the Fed began to permit member banks to use their vault cash, i.e., the physical cash the banks held in their offices, as part of their reserves.
Up until then, only the deposits that member banks held in their reserve accounts at the Fed could be counted as Bank Reserves. After this change, both deposits at the Fed and vault cash were counted as reserves. Allowing banks to use vault cash as reserves reduced the level of deposits, i.e., Reserve Balances, that banks were required to hold at the Fed.

CHART 8.14 Commercial Banks: Reserves, Deposits, and Loans and Investments, 1914 to 2007
Source: Data from Friedman and Schwartz, “A Monetary History Of The United States,” Table A-2, p. 737; and the Federal Reserve’s Annual Report for 2017
This change only explains a small part of the surge in the leverage of the banking system, however. Even after vault cash was added to Bank Reserves held at the Fed, the ratio of total reserves to bank deposits still fell very sharply. By 2007, it had fallen to only 0.9%, as shown in Chart 8.18. With the effective reserve ratio at 0.9%, the money multiplier was 111 times just before the economic crisis struck in 2008.
The second factor that reduced Reserve Balances was that banks began to raise a growing portion of their funds by borrowing money through the credit markets rather than obtaining their funding solely from customers' deposits. This maneuver began in the late 1950s and accelerated thereafter. Banks were not required to hold any reserves against borrowed funds, so this too reduced the level of Reserve Balances held by the banking system.4

CHART 8.15 Total Loans and Investments, Annual Dollar Change, 1915 to 2007
Source: Data from Board of Governors of the Federal Reserve System (U.S.), 1935-, "Part I" in Banking and Monetary Statistics, 1914–1945; Board of Governors of the Federal Reserve System (U.S.), 1935-. Banking and Monetary Statistics, 1941–1970.
Third, the banks developed and put in place techniques that reduced the level of reserve they were required to hold. The Fed had always set the required reserve ratio much higher on demand deposits than on time deposits. Since the banks' customers can withdraw their money from demand deposits (such as checking deposits) without suffering any penalty, demand deposits are more likely to be withdrawn suddenly than are time deposits. Consequently, banks were traditionally required to set aside a higher level of reserves for such deposits. Over time, banks found ways to persuade their customers to shift their deposits out of normal demand deposit accounts into new kinds of deposit accounts that required lower levels of reserves.

CHART 8.16 The Ratio of Bank Reserves to Bank Deposits, 1917 to 2007
Source: Data from Friedman and Schwartz, “A Monetary History Of The United States,” Table A-2, p. 737; and the Federal Reserve’s Annual Report for 2017
The establishment of sweep account programs beginning in the mid-1990s was particularly effective in lowering Bank Reserves. The programs involved the banks implementing automated computer programs that analyzed their customers' use of demand deposits and “sweeping” unused demand deposits into savings deposit accounts with lower reserve requirements.5
Fourth, Congress enacted laws that reduced the level of reserves banks were required to hold. For instance, the Monetary Control Act of 1980 established a “low reserve tranche” whereby the amount of net transaction accounts subject to a reserve requirement ratio of 3% was established, while net transaction accounts in excess of the low reserve tranche were reservable at 10%. Similarly, the Garn-St. Germain Act of 1982 exempted the first $2 million of reservable liabilities from reserve requirements.

CHART 8.17 The Ratio of Bank Deposits to Bank Reserves, 1917 to 2007
Source: Data from Friedman and Schwartz, “A Monetary History Of The United States,” Table A-2, p. 737; and the Federal Reserve’s Annual Report for 2017
These laws also specified that the low reserve tranche amount and the exemption amount would be adjusted each year. By 2007, the former had been increased to $43.9 million and the latter to $9.3 million. By 2019, they had moved up to $124 million and $16 million, respectively.
Finally, the Fed itself steadily reduced the required reserve ratio. In 1948, the required reserve ratio peaked at 26% on net demand deposits and 7.5% on time deposits. It was reduced time and again thereafter. For instance, in 1990, the required reserve ratio on non-transactions accounts was cut from 3% to zero, while in 1992, the requirement on transaction deposits was reduced from 12% to 10%. Finally, in March 2020, the Fed reduced the required reserve ratio to 0%, thereby entirely eliminating the requirement for banks to hold any reserves against their deposits.

CHART 8.18 The Ratio of Bank Reserves at the Fed plus Vault Cash as a Percentage of Bank Deposits, 1945 to 2007
Source: Data from Fed, Flow of Funds, US-Chartered Depository Institutions 1945–2007
Table 8.2 shows every adjustment to the required reserve ratio between 1913 and 2020.
By the 1990s, the Fed had come to view reserves as largely pointless. It explained that forcing banks to hold reserves at the Fed was like a tax on the banking system – a tax that was no longer necessary. The banks concurred wholeheartedly, and lobbied vigorously for the “reserve tax” to be reduced or eliminated altogether.
The Fed pointed out that the government guaranteed bank deposits up to $100,000 per account through the Federal Deposit Insurance Corporation (FDIC); and it argued that these guarantees made old-fashioned bank runs, where frightened depositors all demanded the return of their deposits at once, very unlikely. Moreover, the Fed also emphasized that, in the unlikely event that a liquidity crisis did arise, the Fed itself could provide as much liquidity as necessary to resolve the crisis through discounting operations and/or open market operations. Consequently, the Fed posited, there was no longer any justification for imposing a “reserve tax” on the banking system.
TABLE 8.2 Changes in the Required Reserve Ratio from 1913 to the Present
Source: “Reserve Requirements: History, Current Practice, and Potential Reform” pp. 587-589. Board of Governors of the Federal Reserve System 1935- and Federal Reserve Board, 1914-1935, “June 1993,” Federal Reserve Bulletin (June 1993), Public Domain
|
A.1. Reserve requirements based on geographic distinction among member banks, 1913–66 |
||||
|
Percent of deposits |
||||
|
Effective date |
Net demand deposits |
Time deposits (all classes of banks) |
||
|
Central reserve city banks |
Reserve city banks |
Country banks |
||
|
1913–December 23 |
18 |
15 |
12 |
5 |
|
1917–June 21 |
13 |
10 |
7 |
3 |
|
1936–August 16 |
19.5 |
15 |
10.5 |
4.5 |
|
1937–March 1 |
22.75 |
17.5 |
12.25 |
5.25 |
|
May 1 |
26 |
20 |
14 |
6 |
|
1938–April 16 |
22.75 |
17.5 |
12 |
5 |
|
1941–November 1 |
26 |
20 |
14 |
6 |
|
1942–August 20 |
24 |
↕ |
↕ |
↕ |
|
September 14 |
22 |
|||
|
October 3 |
20 |
|||
|
1948–February 27 |
22 |
|||
|
June 11 |
24 |
|||
|
September 24, 16 |
26 |
22 |
16 |
7.5 |
|
1949–May 5, 1 |
24 |
21 |
15 |
7 |
|
June 30, July 1 |
↕ |
20 |
14 |
6 |
|
August 1 |
20 |
13 |
6 |
|
|
August 11, 16 |
23.5 |
19.5 |
12 |
5 |
|
August 18 |
23 |
19 |
↕ |
↕ |
|
August 25 |
22.5 |
18.5 |
||
|
September 1 |
22 |
18 |
||
|
1951–January 11, 16 |
23 |
29 |
13 |
6 |
|
January 25, February 1 |
24 |
20 |
14 |
↕ |
|
1953–July 9, 1 |
22 |
19 |
13 |
|
|
1954–June 24, 16 |
21 |
19 |
13 |
5 |
|
July 29, August 1 |
20 |
18 |
12 |
↕ |
|
1958–February 27, March 1 |
19.5 |
17.5 |
11.5 |
|
|
March 20, April 1 |
19 |
17 |
11 |
|
|
April 17 |
18.5 |
17 |
↕ |
|
|
April 24 |
18 |
16.5 |
||
|
1960–September 1 |
17.5 |
↕ |
||
|
November 24 |
17.5 |
12 |
||
|
December 1 |
16.5 |
↕ |
||
|
1962–July 28 |
↕ |
|||
|
October 25, November 1 |
4 |
|||
|
A.2. Reserve requirements based on geographic distinction among member banks and on the level of deposits, 1966–72 |
|||||||
|
Percent of deposits |
|||||||
|
Effective date |
Net demand deposits |
Time deposits (all classes of banks) |
|||||
|
Reserve city banks (deposit intervals in millions of dollars) |
Country banks (deposit intervals in millions of dollars) |
Savings |
Other time (deposit intervals in millions of dollars) |
||||
|
0–5 |
More than 5 |
0–5 |
More than 5 |
0–5 |
More than 5 |
||
|
1966–July 14, 21 |
16.5 |
16.5 |
12 |
12 |
4 |
4 |
5 |
|
September 8, 11 |
↕ |
↕ |
↕ |
↕ |
4 |
4 |
6 |
|
1967–March 2 |
3.5 |
3.5 |
↕ |
||||
|
March 16 |
3 |
3 |
|||||
|
1968–January 11, 18 |
17 |
12.5 |
↕ |
↕ |
|||
|
1969–April 17 |
17 |
17.5 |
12.5 |
13 |
|||
|
1970–October 1 |
17 |
17.5 |
12.5 |
13 |
5 |
||
|
A.3. A graduated reserve requirement schedule for member banks, 1972–80 |
||||||||||||
|
Percent of deposits |
||||||||||||
|
Effective date |
Net demand deposits (deposit intervals in millions of dollars) |
Time and savings deposits |
||||||||||
|
Savings |
Time (deposit intervals in millions of dollars) |
|||||||||||
|
0–2 |
2–10 |
10–100 |
100–400 |
More than 400 |
0–5, by maturity |
More than 5, by maturity |
||||||
|
30–179 days |
180 days to 4 years |
4 years or more |
30–179 days |
180 days to 4 years |
4 years or more |
|||||||
|
1972–November 9 |
8 |
10 |
12 |
16.5 |
17.5 |
3 |
3 |
3 |
3 |
5 |
5 |
5 |
|
November 16 |
↕ |
10 |
12 |
13 |
17.5 |
↕ |
↕ |
↕ |
↕ |
↕ |
↕ |
↕ |
|
1973–July 19 |
10.5 |
12.5 |
13.5 |
18 |
||||||||
|
1974–December 12 |
10.5 |
12.5 |
13.5 |
17.5 |
6 |
3 |
3 |
|||||
|
1975–February 13 |
7.5 |
10 |
12 |
13 |
16.5 |
↕ |
↕ |
3 |
||||
|
October 30 |
↕ |
↕ |
↕ |
↕ |
↕ |
1 |
1 |
|||||
|
1976–January 8 |
2.5 |
↕ |
2.5 |
↕ |
||||||||
|
December 30 |
7 |
9.5 |
11.75 |
12.75 |
16.25 |
2.5 |
2.5 |
|||||
|
A.4. Reserve requirements since passage of the Monetary Control Act of 1980 |
||
|
Percent |
||
|
Effective date |
Net transaction accounts |
Non-transaction accounts |
|
1980–November 13 |
12 |
3 |
|
1990–December 26 |
12 |
0 |
|
1992–April 2 |
10 |
0 |
|
2020–March 26 |
0 |
0 |
These developments, taken together, allowed the commercial banking sector to create credit and to grow its deposit base vastly more than the reserves it set aside as Reserve Balances at the Fed.
Consequently, the effective required reserve ratio declined to such a low level that for all intents and purposes it ceased to limit how much money the banking system could create. Therefore, long before the crisis of 2008 struck, neither the Fed nor the banking sector was constrained in the amount of money it could create.
When the crisis began, Bank Reserves, including vault cash, amounted to only $74 billion, compared with $8.5 trillion of deposits and $11.4 trillion of loans and investments. They may as well have been nonexistent.
Of course, had the banking sector acted prudently, it would have been careful to only create as much credit through extending loans as their customers could realistically afford to repay. The bankers did not act prudently, however. Up through 2007, the banking system created credit on an extraordinary scale with little to no concern for the ability of their customers to repay even the interest on the credit that the banks provided to them so freely.
Notes
1. Irving Fisher, 100% Money, chapter 3. http://fisher-100money.blogspot.com
2. The Fed eliminated the requirement that commercial banks hold reserves against their deposits, effective March 26, 2020. Source: Reserve Requirements, The Fed. https://www.federalreserve.gov/monetarypolicy/reservereq.htm
3. After 2008, when Quantitative Easing had caused Bank Reserves to become superabundant, the Fed changed its operating procedure, as will be described in Chapter 20.
4. Banks began issuing large Certificates of Deposit (CDs) in 1961 to raise funds. These CDs were subject to Reserve Requirements until 1991. Source: “US Monetary Policy and Financial Markets” p. 38, Ann-Marie Meulendyke. Federal Reserve Bank of New York, 1998
5. “Federal Reserve Board Data on OCD Sweep Account Programs,” St. Louis Fed. https://research.stlouisfed.org/aggreg/swdata.html; Sweep Accounts, “The wholesale adoption of Sweep programs in 1995,” The Fed’s Annual Report for 2001, p. 101.