
4
Physiological processes of terrestrial plants regulate the land–atmosphere exchange of carbon, water and energy.
Lamba et al., 2017
The Earth’s carbon and hydrologic cycles are intimately coupled by gas exchange through plant stomata.
Frank et al., 2015
The balance between evapotranspiration and albedo determines how vegetation changes affect local climate.
Swann et al., 2010; Shen et al., 2015
4.1Introduction
To assess the effects of trees and forests on the temperature of the atmosphere, it is essential to review how they function in relation to biogeochemical factors, such as photosynthesis and release of biogenic hydrocarbons (BVOCs), and biophysical factors, such as albedo, deforestation, and land-use change, evapotranspiration, and ozone. Although biogeochemical and biophysical factors can be considered separately, their interactive roles determine whether trees and forests cool or warm the atmosphere.
4.2Biogeochemical Factors
4.2.1Leaf Photosynthesis
Photosynthesis is the process that primarily occurs in plant leaves where interactions between infused carbon dioxide, light-activated chloroplasts, and water result in formation of carbon compounds, with release of oxygen (Pallardy, 2008). It is a biochemical process that has been known and studied for more than two centuries (Cieslik et al., 2009). Details of the process can be found in hundreds of journal papers and books.
Photosynthesis is often represented by the following generalized, very simple equation:
CO2 + 2 H2O light/chlorophyll → (CH2O) + O2 + H2O
where CH2O represents carbohydrates (Kramer and Kozlowski, 1979).
Carbon dioxide enters through stomata, primarily on leaf surfaces, in the presence of sunlight. Inward diffusion of carbon dioxide is regulated by flux between internal and external concentrations, illustrated in Box 4.1.
Box 4.1Inward Stomatal Diffusion by Carbon Dioxide in Sunlight
Regulated by flux between internal and external concentrations
Cair − Cm = difference between outside CO2 and CO2 in substomatal cavity and chloroplast mesophyll cells
rair + rleaf = diffusion resistance to CO2 diffusion in outside air, plus two leaf resistance components:
rs = resistance in substomatal cavity
rm = mesophyll resistance during diffusion to chloroplasts
(Kramer and Kozlowski, 1979)
Mesophyll resistance slows the rate of diffusion and lowers the concentration of carbon dioxide ultimately available to chloroplasts for photosynthesis. Sun et al. (2014) determined that global carbon cycle models include only stomatal diffusion of carbon dioxide and not mesophyll diffusion. They developed a global mesophyll conductance (GMC) model which concluded that, by ignoring mesophyll diffusion, current global carbon cycle models overestimate the amount of carbon dioxide available for use in chloroplasts. This also appears to result in an underestimation of the effects of carbon dioxide on terrestrial biomass productivity (the CO2 fertilization effect). Inclusion of mesophyll diffusion in the GMC model increased the modeled carbon dioxide fertilization effect for GPP. Resistance due to mesophyll diffusion is a barrier to carbon dioxide movement in leaves to chloroplasts. This implies that terrestrial vegetation is inherently carbon limited and therefore will absorb more carbon dioxide as carbon dioxide concentrations in air continue to increase, and this will result in increased rates of photosynthesis and gross primary productivity.
4.2.2Woody Tissue Photosynthesis
Photosynthesis also occurs in many plant tissues that are not leaves: it can occur in stems, bark, flowers, fruits, and almost all vegetative and reproductive structures that contain chloroplasts. This can be viewed as additional opportunities for fixed carbon for plants (Aschan and Pfanz, 2003; Saveyn et al., 2010). Woody tissue photosynthesis is common in trees (Teskey et al., 2008). Saveyn et al. (2010) have suggested that photosynthesis in stems of woody plants and trees be termed “woody tissue photosynthesis.” While woody tissue photosynthesis has long been known, it has been concluded that, in general, the amount of carbon fixed in tree stems did not contribute to significant carbon gain. With increasing awareness of the role of carbon fixation and storage by trees, and effects of accompanying diffusion and respiration of carbon dioxide on global warming and climate change, interest has increased in woody tissue photosynthesis.
Avila-Lovera (2014) have extensively examined and characterized stem photosynthesis in trees. Their cclusion is that it occurs mostly in the cortex of the stem. They divided stem photosynthesis into the following categories:
1.Stem net photosynthesis (SNP) in chlorenchyma below an epidermal layer containing stomates, allowing uptake of carbon dioxide from air.
2.Stem recycling photosynthesis (SRP) in chlorenchyma below a stomate-free well-developed periderm, using internally respired carbon dioxide from mitochondrial respiration. The obvious presence of chlorophyll-containing chlorenchyma below the protective periderm enables photosynthetic activity. This type of stem photosynthesis is also called bark photosynthesis (Aschan et al., 2001).
Both SNP and SRP help to maintain physiological activity during stress periods, particularly in coping with drought. Trees in dry tropical areas that lose their leaves for most of the year use SRP with little water loss to provide carbon sources for refoliation before and during annual rainfall (Ávila-Lovera and Ezcurra, 2016). The palo verde tree (Parkinsonia florida) is a desert tree that has green bark tissues in branches and trunks (“green pole tree”) most of the year. Stem photosynthesis enables annual refoliation when rains begin. The palo verde trees refoliate, flower, produce seed pods and defoliate, and the cycle continues. Aschan et al. (2001) found that the chlorophyll content of one-year-old twigs (stems) on trembling aspen trees (Populus tremuloides) approached that found in leaves. The chlorophyll content of aspen bark collenchyma in stems was found to be age-dependent. Aschan et al. concluded that refixation of internal carbon dioxide in chloroplasts in aspen bark collenchyma may contribute to the carbon budget of deciduous aspens when they are dormant and leafless. Bark photosynthesis is affected by high temperatures in summer and low temperatures in winter.
Saveyn et al. (2010) addressed the question of whether trunk bark photosynthesis could significantly affect plant growth and carbon balance. They investigated the influence of woody stem photosynthesis on chlorophyll concentration, radial stem growth, bud biomass, and composition of sugars in plant organs for three native evergreen tree species. Treatments consisted of light exclusion by covering 100% or 50% of the trunk, and a non-treated control. After initial radial measurements, all trees were defoliated, and later effects on bud formation and tissue sugars were determined. Complete exclusion of light reduced chlorophyll concentration, radial trunk growth, and bud mass. Complete light exclusion on defoliated trees resulted in increased 13C in trunk and bud sugars. The contribution of woody stem photosynthesis to carbon accumulation and tree growth was clearly demonstrated in the results from this experiment.
Global warming and climate change appear to be increasing the incidence of drought stress in forests, which causes tree decline and often death. Vandegehuchte et al. (2015) have proposed that photosynthesis in woody bark tissue might result in enough carbohydrates to make up for loss from other sources due to disruption by drought. They conclude that this may be more likely for younger trees that may have greener shoot tissues and smaller bark layers.
4.3Biomass Gain from Photosynthesis
Carbon, primarily from leaf photosynthesis, is used to promote growth and development of tree buds, leaves, flowers, cones, seeds, shoots, branches, main stems (trunks), roots and associated mycorrhizae, which collectively can be considered as total biomass. Tree growth and biomass is often affected by multiple environmental stresses and disruptive events that can limit tree growth. These include light, carbon, water, and nitrogen. On a worldwide basis, water limitation is often the most limiting factor (Dickson, 1989). Tree growth seems to depend on maintaining a positive carbon balance while responding to one or more environmental stresses (Dickson, 1989). The rate of tree growth and biomass accumulation also varies with growth stages for trees. Dickson (1989) identified seedling, sapling, pole stage, mature flowering and fruiting, and senescence as growth stages for trees. Biomass gain is different at every growth stage and for every tree species. This is overlooked in most models that explain tree (summed as a generic term) response to environmental influences and climate change.
4.3.1The Nature and Function of Trees and Photosynthesis
Wilson (1984) defines a tree as a simple system: “A tall single-stemmed woody plant with a branched crown and many leaves.” He divides a tree into three basic components: leaves, shoot system, and root system. Leaves capture carbon in photosynthesis. Carbohydrates are used in construction of the mass of tree components. Stems and branches support leaves. In stems, phloem transports photosynthate within the tree, especially to the roots. Xylem moves water and nutrients, especially nitrogen, and auxins upward to leaves and meristems. Roots anchor the tree.
Wilson’s purpose in writing his book was to “show how the great size and complexity of a tree is generated by relatively few processes, repeated over and over each year as the tree grows.” How well these components function together will affect tree growth and biomass accumulation and carbon allocation within trees.
Patterns of bud expansion and shoot growth vary with seasons and tree species, and this influences growth and biomass production. Leaf development and expansion begins with bud expansion. Kramer and Kozlowski (1979) identified three general patterns of seasonal bud expansion and resulting shoot growth:
1.In determinate shoot growth, only one terminal bud expands on a shoot each year. Maximum leaf area occurs early in season. On some deciduous trees, two or more may form sequentially and expand in the same year. Examples include some species of pine, spruce, oak, and hickory.
2.In indeterminate shoot growth, the shoot tip bud may abort, allowing axillary buds to expand. New leaves may be added continuously. This is common in deciduous trees.
3.In intermittent growth, new shoots grow periodically in flushes. This is common in warm-climate pine species and in many tropical forest trees.
Dickson (1989) compared seasonal leaf production and function in deciduous and evergreen trees. Different strategies are used to gain, use, and store carbon obtained from photosynthesis.
In deciduous trees, growth is usually rapid, and large numbers of carbon-efficient leaves are produced annually. Defoliation at the end of the growing season is followed by rapid renewal of large numbers of leaves from bud expansion the following spring. This renewed spring growth requires large amounts of stored carbohydrates. After leaf expansion, much of the new fixed carbon is used for stem and root growth and storage.
Most conifers have narrow needle-like persistent leaves. Annual growth may be slower than for deciduous trees. The amount of new leaf produced in spring is small in relation to the existing persistent several-year leaf biomass. Depending on species and tree age, conifers may retain physiologically active leaves on stems for periods ranging from 2 to 7 years. Photosynthesis and carbon fixation are active in older leaves, declining with needle age. All ages of conifer leaves can be photosynthetically active in warm sunny early spring weather before budbreak and new leaf emergence. Some of this carbohydrate is stored in leaves, stems, and roots. When new leaf growth begins to emerge, some of this newly fixed carbohydrate is translocated to the new leaf growth. If carbon fixation in new leaves and all classes of older leaves is combined, total tree annual carbon gain for a conifer may be similar to that of a rapidly growing deciduous tree (Matyssek, 1986).
In addition to providing support for leaves on shoots and pathways for transport of water, minerals, carbohydrates, and auxins, the main stem and branches of trees are where radial growth and carbon sequestration occur, primarily in physiologically inactive wood. Radial growth occurs primarily from meristem growth in the vascular cambium located between bands of xylem on the inside and phloem outside in stems and branches. In temperate zone trees, cambium activity is suspended during winter. In spring, the cambium generates annual increments of new xylem on the inside and new phloem on the outside of the cambial layer. The new increments are formed between old layers of xylem and phloem, and this results in increases of stem and branch diameters (Kramer and Kozlowski, 1979).
Roots anchor trees and provide storage for carbohydrates and water and essential elements for shoot growth. Unlike leaves and shoots, it is difficult to visualize and determine the extent of tree root systems. There are a few examples where entire or partial tree root systems have been excavated and characterized, which provides some basis for generalizations about tree root systems (Kramer and Kozlowski, 1979; Pallardy, 2008). Life begins for a tree when a seed germinates under favorable conditions. The emerging root functions as a non-persistent tap root which later branches to begin the root stem. Wilson (1984) states that it is a myth that trees have persistent tap roots. Large perennial roots and smaller lateral roots anchor a tree. A very extensive network of fine roots extends well beyond the dripline of the tree crown. These are sometimes called “feeder roots” as they take up most of the water and nutrients for the tree. They are found typically in the upper 15 cm (6 inches) of soil (Wilson, 1984). Fine roots make up most of the root length, but only a small portion of total root weight. Rapid turnover of fine roots occurs, owing to surface disturbance, changes in soil temperature, and other environmental factors. Considering the extent of tree fine root systems, the death of fine roots may contribute to the soil carbon sink (Pallardy, 2008).
Fine roots also have symbiotic associations with nonpathogenic fungi that are called mycorrhizae. Root cells are invaded, and associations are established between the fungus and the root cell for mutual benefit. Two types of mycorrhizal associations that relate to trees are:
1.Endomycorrhizae (endotrophic). The fungus is entirely within the colonized cells. There is no change in the shape of the root cells or the external appearance of the root. Mycorrhizae of this type are found only in a few tree species such as Acer, Liriodendron, and Liquidambar.
2.Ectomycorrhizae (ectotrophic). The fungus is both inside root cells and outside the root, causing root cells to divide repeatedly to form external large multi-branched structures that increase uptake of water and minerals. This association is common in forest tree roots, and there are characteristic fungi associated with tree species. Part of the fungus life cycle is visible above ground in late summer or autumn as large fleshy growths called mushrooms. Some are edible and are avidly sought by people as food.
Trees provide carbohydrates and other nutrients to mycorrhizae. In turn, mycorrhizae increase uptake of nutrients and water and may protect roots from invasion by soilborne root pathogenic fungi (Pallardy, 2008).
4.3.2Carbon Allocation and Biomass Estimation
Capture of carbon dioxide from the atmosphere, patterns of allocation of carbon from photosynthesis within trees, and its retention in tree tissues, primarily wood, are key components of how trees influence atmospheric temperatures. Carbon allocation in trees influences how much is invested in biomass, consisting of leaves, stems, and roots. The allocation varies between deciduous and evergreen trees and between tree species. General background about carbon allocation is presented here, together with invasive destructive and non-invasive methods for determining carbon allocation and biomass estimation.
4.3.2.1Carbon Allocation
Several authors have posed the question, “Where does all the carbon go?” To understand this, it is essential to know and predict where and how assimilate from photosynthesis is allocated within trees (De Kauwe et al., 2014). There is general consensus that most of the fixed global terrestrial carbon is found in trees and forests (Bonan, 2008). Klein and Hoch (2015) estimate that as much as 90% of fixed terrestrial global carbon resides in forest trees. Forest trees are estimated to contain approximately 650 billion tonnes of wood, which is the most important location within a tree for long-term storage of carbon obtained from the atmosphere via photosynthesis. The amount of carbon dioxide in the atmosphere (carbon source) is at present greatly elevated and exceeds the amount that trees can assimilate through photosynthesis. The response of trees to elevated carbon dioxide is determined not by atmospheric carbon dioxide (source) but by the extent of photosynthesis and resulting cambial growth (sink) possible to produce wood and other woody tissues. Cambial sink strength limits (controls) the mitigation potential of trees and forests by wood sequestration for global warming and resulting climate change (Sass-Klassen, 2015).
Kozlowski (1992) has provided an extensive review of carbon allocation in trees and woody plants. Carbon is assimilated during photosynthesis in chloroplasts in leaves. Some may be converted to starch and used for chloroplast growth and metabolism. The rest is converted primarily to sucrose and other carbohydrates, such as sorbitol, mannitol and some oligosaccharides, and transported by mass flow in phloem to other locations throughout the tree, depending on relative sink strengths (Holtta et al., 2014; Ryan and Asao, 2014). Holtta et al. (2014) point out that while water transport from soil to leaves in xylem in trees is fairly well understood, system transport of carbohydrates in phloem in trees is less understood and more complicated, a view also shared by Lemoine et al. (2013) and Bruggemann et al. (2011).
Carbohydrates from photosynthesis are translocated to leaves, branches, stems, and roots of trees for growth, metabolism, storage, and respiration. Transfer in roots includes exudation to soil and mycorrhizal associations. Some is transformed into nonstructural carbohydrates, principally starch, but also lipids and fructans that are stored for use during periods of stress or lack of sufficient available carbohydrates from photosynthesis (Ericsson et al., 1996; Sala et al., 2012; Klein and Hoch, 2015).
Ericsson et al. (1996) proposed a general scheme for carbohydrate allocation, based on deciduous tree growth and maturity in a forest:
In early stages of tree growth in a forest, much of the assimilate is used for leaf production and blade expansion. As tree growth continues, more assimilate is used for development of branches, stems, and roots.
Assimilate production and rate of biomass increments increases and peaks at the time of canopy closure. Net carbon gain may begin to decline with tree age.
After canopy closure, respiration continues to increase as the branches, stems, and large perennial roots continue to increase in size and accumulate carbon. Net carbon gain begins to decrease. Carbon dioxide fixation may not keep up with carbon costs for maintenance and respiration. The amount of carbon for branch, stem, and root growth may begin to decrease.
Klein and Hoch (2015) have proposed a sequential pathway scheme to describe tree allocation in response to atmospheric carbon dioxide. Their carbon budget scheme can be summarized as:
A = R + G + E + L + S = C
where A = assimilation, R = respiration, G = sequestration through growth, E = root exudation, L = carbon litter released, S = storage of non-structural carbohydrates, and C = complete carbon budget.
4.3.2.2Measuring Carbon Allocation
Because of the size and complexity of underground root systems, it is difficult, if not impossible, to measure carbon allocation accurately. This causes problems as one way to accurately determine carbon allocation for a tree is to measure the size, extent, and weight of tree leaves, branches, stems, and roots. This has resulted in a number of methods to measure and estimate tree carbon allocation. Destructive harvest of smaller trees has been used to identify sinks and establish carbon budgets. Detailed systemic complete analyses of carbon allocation in trees are not numerous and rely on estimates as well as actual measurements, especially for roots (Hogberg et al., 2002). Tracing labelled carbon molecules through trees has more appeal and is used to determine the path of the carbon.
4.3.3Destructive Harvest Mass Balance
Agren et al. (1980) established the first complete annual carbon budget for a tree (a 14-year-old Scots pine, Pinus sylvestris L.), in a forest in Sweden, using actual measurements and estimates based on them. Their annual budget is in Box 4.2.
Box 4.2First Complete Annual Carbon Budget for a Tree
Actual measurements, and estimates based on them, for a 14-year-old Scots pine (Pinus sylvestris L.) in Sweden. Estimated annual photosynthetic production: 1,696 g carbon.
|
Respiration |
173 g carbon |
10% |
|
Stem growth |
145 g carbon |
9% |
|
Branch growth |
132 g carbon |
8% |
|
Current needle growth |
286 g carbon |
17% |
|
Fine root growth |
960 g carbon |
57% |
Most carbon was estimated to be in the fine roots.
Source: Agren et al., 1980
The accuracy of their estimates was variable. They concluded that they had used accurate estimations for stem respiration (10%), stem growth (9%), current needle growth (17%), and net photosynthesis (100%). While most of the tree carbon was found in fine roots, their estimates of fine root growth were less certain as their measurements were uncertain. With the exception of branch weights, the authors concluded that their carbon budget was balanced. Their results illustrate that the difficulty of establishing a carbon budget for a tree lies in the methods of determining the extent and weight of roots of various sizes.
Helmisaari et al. (2002) identified beginning biomass and annual biomass production for a forest stand of sapling (15 years old), pole stage (35 years old), and mature (100 years old) Scots pine (Pinus sylvestris L.) trees in Finland. Fine root mass was determined by soil core sampling. Biomass and annual production values were obtained for needles, cones, stem wood, and coarse roots, and calculated for the whole stand using biomass components from felled tree samples. Their results are in Box 4.3. Annual fine root production predominated in biomass production. This suggests that fine roots are large sinks for carbohydrates. Respiration, death, and decomposition of fine roots could release considerable carbon into the soil.
Box 4.3Initial and Annual Biomass by Tree Age for Scots Pines (Pinus sylvestris)
Saplings (15 years), pole stage (35 years), and mature (100 years)
|
Sapling |
Pole |
Mature |
|
|
Beginning biomass |
|||
|
Needles |
9% |
9% |
4% |
|
Stems, branches, cones |
66% |
69% |
83% |
|
Coarse roots |
10% |
15% |
2% |
|
Fine roots |
15% |
7% |
2% |
|
Annual biomass production |
|||
|
Needles |
15% |
12% |
14% |
|
Stems, branches, cones |
39% |
26% |
18% |
|
Coarse roots |
3% |
3% |
8% |
|
Fine roots |
43% |
59% |
60% |
Source: Helmisaari et al., 2002
Konôpka et al. (2010) evaluated young trees (first age class, 0–10 years old) of Scots pine (Pinus sylvestris), Norway spruce (Picea abies), European beech (Fagus sylvatica), and sessile oak (Quercus petrae) growing in regeneration areas of forests in Slovakia. For each species, basal diameter and height for up to a total of 175 trees was calculated. Some were then excavated and the biomass of foliage, branches, stems, leaves, and roots was determined. Allometric equations were used to determine biomass allocation patterns, termed biomass allocation coefficients (BAC). They also calculated stem biomass increment per unit of foliage area or foliage biomass, termed growth efficiency (GE). They found that there were large differences in BAC and GE between the evergreen and deciduous trees; and also differences between beech and oak, and between Scots pine and Norway spruce. Their conclusion was that forest growth models should include all tree species and age classes, not just older more mature trees, to more accurately predict forest biomass and stored carbon.
4.3.4Non-invasive Isotopic Analysis
The destructive harvest or mass balance approach to determining carbon allocation within trees relies on implications from physical measurements. Non-destructive tracing of assimilate using labelled carbon allows more precise determination of carbon allocation from photosynthesis in living plants. Isotopic forms of carbon, principally 13C (carbon 13) or radioactive 14C or 11C can be applied as short or continuous pulses to trace assimilate from source to pathway in the plant to exudation to soil microbes to respiration (Bruggemann et al., 2011; Dietz et al. 2014). Allocation to sinks for assimilate can be estimated by the amount and persistence of labelled assimilate and loss through respiration, root exudation, and emissions of BVOCs (Epron et al., 2012). Extensive reviews of isotopic analysis and the use of isotopes to determine carbon allocation can be found in Bruggemann et al. (2011) and Epron et al. (2012).
Hogberg et al. (2008) used pulse-labelled 13CO2 to trace assimilate from the canopy of 4 m tall Scots pines (Pinus sylvestris) through the tree to roots, soil and soil microorganisms, and back to the atmosphere via soil respiratory efflux. They found labelled carbon in phloem after 24 hours, in soil respiratory efflux after 2–4 days, in ectomycorrhizal roots after 4–7 days, and in soil microbial cytoplasm after 2–4 days. From their results, they concluded that ectomycorrhizal roots were the strongest sinks for the labelled assimilate.
4.3.5Leaf Area Index
The extent of tree leaf area, and how long the leaves persist, are important determinatives for GPP. Leaf area is affected by available soil moisture and nutrients. Leaf persistence is governed by temperature and soil moisture availability (Duursma et al., 2009). Both leaf area and persistence vary with tree species, age, and location. This can complicate efforts to use leaf area in general predictive models.
Leaves have the most active living cells of any part of a tree. Leaves in a tree canopy are the place where carbon dioxide uptake, transpiration, light interception and reflection (albedo), photosynthesis, and assimilate formation occur. Leaves are the key energy source and atmospheric exchange site for the biogeochemical cycle in trees (Bartelink, 1997; Breda, 2003). Anything that affects tree leaves will have an effect on leaf function and atmospheric exchange, and thus on the contribution that trees make to cooling or warming the atmosphere (Breda, 2003).
Actual or estimated tree leaf canopy areas are used in predictive models of tree cover and change; gas exchange and function; and carbon accounting. Accuracy in measuring and estimating tree leaf canopy are essential to the validity and application of models. Determining canopy size and number of leaves for herbaceous plants and small trees can be accomplished by counting them and obtaining dry weights. This can be done on a limited scale when young trees are destructively harvested to determine carbon allocation. This provides data for the time of harvest, but does not allow for continuing assessment, unless a continuing cycle of destructive harvest is established. Indirect estimation methods are necessary for larger trees. One method of estimation for canopy leaf area for larger trees in forests is called leaf area index (LAI), defined as: the total one-sided area of leaf tissue per unit of ground surface area, the area of ground surface covered by leaves of the canopy (Breda, 2003; Zhao and Popescue, 2009). LAI is a useful metric, as it has been concluded that there can be good correlation between LAI and GPP and NPP (gross and net primary production) (Duursma et al., 2009).
LAI can be measured in many direct and indirect ways. Results from direct methods seem to be more accurate than those from indirect methods (Breda, 2003). The index is easier to calculate for deciduous trees than for conifers. A labor-intensive and time-consuming traditional direct method for determining LAI for deciduous forest trees involves collecting leaves from traps placed beneath canopies at 2-week intervals during leaf fall. Collected leaves are dried and weighed to determine weight per square meter. Results from collection dates are converted to leaf area. LAI is expressed as accumulated leaf area during the total leaf-fall period (Breda, 2003). Indirect methods include monitoring daily and seasonal light transmission through canopies. LAI is determined by measuring the transmission. A number of commercial analyzers can also be used to measure radiation transmission (Breda, 2003). Zhao and Popescue (2009) used pulsed laser energy from airborne LiDAR (light detecting and ranging) to determine LAI for a pine forest area in East Texas. They compared their results with those for LAI from moderate-resolution satellite results and concluded that their results were superior for mapping LAI at local and regional scales.
4.3.6Biomass
Estimation of above-ground forest biomass (leaves, branches, and stems) is essential to determine the extent and condition of available sinks for atmospheric carbon dioxide and how this data can be incorporated into existent and predicted global climate change models. Like LAI, there are many ways to do this. Destructive and invasive methods give the most accurate results, but are expensive, consume large amounts of time, and are not appropriate for large or large numbers of trees. Non-invasive methods are less accurate but are more efficient and less expensive.
Dittmann et al. (2017) have provided an extensive review of non-invasive methods for estimating tree biomass:
Allometric Equations
Biomass estimation from measurements obtained from non-invasive methods, such as diameter at root collar, diameter at breast height (dbh; 1.3 m above ground), tree height, crown width, and height above stem, are used to formulate regression equations. This is appropriate for small areas and uses low grade technical methods.
Bartelink (1997) used measurements of 38 beech (Fagus sylvatica) trees, ranging from 8 to 59 years old, to establish allometric relationships for stem, crown characteristics, biomass, and leaf area. These relationships increased with tree age and increases in stem diameter. He concluded that above-ground biomass ranged from 6 to 167 tonnes per hectare, increasing with tree age. Nowak (1996) collected data on dbh, tree height, height to base of live crown, and crown width for urban trees. He used regression equations to predict leaf area and leaf biomass based on dbh and crown characteristics. Combining dbh with crown parameters provided better results with a stronger relationship than dbh alone.
Optical Imaging
Passive remote sensing, using visible and infrared wavelengths, of large mostly homogeneous forest stands, can be obtained from airplanes or satellites. Muukkonen and Heiskanen (2005) used optical ASTER satellite data to estimate stands of boreal forests, together with National Forest Inventory of Finland data. They found that their estimates were close to the forest inventory data.
Radar and Laser Technology
Airplane and satellite radar can be used on large scales. It is most effective over large areas with re-growing or spare stands.
Laser technology has proven much more effective and useful than radar. Popescue (2007) used airborne LiDAR to measure form and biomass of individual loblolly pine trees (Pinus taeda). LiDAR-measured parameters such as tree height and crown diameter were used in regression models. The above-ground biomass and component biomass were then determined. Kankare et al. (2013) used terrestrial laser scanning (TLS) to estimate tree biomass. Dense clouds from TLS measurements allowed features that describe biomass to be estimated from stem form and canopy measurements.
Computer Vision
Dandois and Ellis (2010) applied computer vision algorithms to digital photographs and were able to demonstrate high-resolution three-dimensional measurements of the structure of vegetation.
4.3.7Respiration
During photosynthesis, it is known that trees obtain carbon from carbon dioxide in the atmosphere via stomatal conductance and release oxygen. Carbohydrates, principally glucose and stored starch, accumulate for use within the tree. Energy is required to maintain the integrity of the tree and to promote growth. In all living cells throughout a tree, an autotrophic oxidation process in mitochondria called respiration provides the energy. Carbohydrates, often glucose, are substrates for the respiratory process. Unlike photosynthesis, oxygen is used in respiration, and carbon dioxide and water are released. Respiration occurs primarily at night. A brief example of a complicated and complex process, using glucose as a substrate, is given below:
C6H12O6 + 6 O2 → 6 CO2 + 6 H2O + est. 686 calories/mole
(Kramer and Kozlowski, 1979; Pallardy, 2008).
Saveyn et al. (2008) divide respiration in trees into two components:
Growth respiration: synthesis of material for new structures (assimilation);
Maintenance respiration: maintaining existing cellular contents and structure.
They conclude that maintenance respiration strongly depends on temperature, as it involves enzymatic processes. As for photosynthesis, the effects of ambient air temperatures on respiration are well known. Respiration is expected to increase as temperatures increase, while photosynthetic rate will decline when temperatures exceed an optimal temperature range. An exponential equation involving Q10 (relative increase in basal reference respiration rate at temperature T1 to an increase of 10 °C in air temperature) can be used to calculate an increased respiration rate at the new temperature (T2) (Turnbull et al., 2001; Saveyn et al., 2008).
Tree maintenance and growth depend on the availability of the fixed carbon products, primarily carbohydrates, from photosynthesis. Griffin and Prager (2017) conclude that the amount of carbon dioxide removed from the atmosphere each year by vegetation is almost balanced by the amount of carbon dioxide returned to the atmosphere through respiration by vegetation. Estimates of losses of fixed carbon from photosynthesis due to autotrophic respiration range from 40% to 60% for deciduous forests, to as much as 90% for tropical forests (Ryan et al., 1997; Turnbull et al., 2001; Saveyn et al., 2008). In deciduous trees, approximately half of the carbon fixed on one day is estimated to be lost through respiration the next night. What is left can be used for maintenance and growth (Turnbull et al., 2001). The difference between photosynthesis gain and respiration loss determines carbon balance of the forest (Hogberg et al., 2002). Gains from photosynthesis are expressed in GPP. When losses from respiration are subtracted, NPP remains. NPP rates determine forest tree growth and carbon allocation (Ryan et al., 1997; Turnbull et al., 2001).
4.3.8Respiration Loss by Trees
Leaves
Leaves are the site of most photosynthesis and also where the respiration rate is the highest, as most of the tissues and cells in leaves are alive and functional. Leaf respiration changes with leaf age and location on the tree, with respiration rates higher in leaves in the tops of canopies (Pallardy, 2008). Turnbull et al. (2001) investigated leaf respiration rates for three species of deciduous trees in the field in relation to temperature and available soil moisture. Gas exchange measurements were used to determine rates of dark respiration for red maple (Acer rubrum L.), red oak (Quercus rubra L.) and chestnut oak (Quercus prinus) leaves at ambient and increasing temperatures. Respiration rates for all species were similar at ambient temperatures. Values for all species were lower at the wet site than the higher drier site. There were significant differences between species in respiration rates in response to warming. The smallest increases in respiration occurred in leaves of A. rubrum. The Q10 value for A. rubrum was 1.5 and 2.1 for Q. prinus. The variable rate of leaf respiration by different common deciduous forest tree species, in response to air warming and soil moisture, is a factor to consider when estimating or modeling future rates of respiration from tree leaves.
Stems
It is assumed that carbon dioxide from cellular respiration in tree stems can readily diffuse outward into the atmosphere. Teskey et al. (2008) challenged this assumption and concluded that internal barriers may slow and reduce release of internally generated carbon dioxide. Some may be used for photosynthesis by internal cells, or dissolve in xylem and be transported to leaves. Based on their findings, they proposed that less carbon dioxide diffuses into the atmosphere than is commonly thought, and that carbon dioxide concentrations in tree stems may exceed 20%. They proposed re-thinking carbon dioxide fluxes in tree stems and suggested that this would help to increase understanding of tree stem emissions of internally generated carbon dioxide.
Fan et al. (2017) investigated the effects of stem size on stem respiration and flux components in yellow poplar (Liriodendron tulipifera L.) trees with different basal diameters. For the smallest tree (20 cm diameter), they determined that 86% of the internally produced carbon dioxide diffused to the atmosphere, while only 46% diffused from the largest tree (60 cm diameter) More internal carbon dioxide remained in the xylem sap as the trees increased in diameter.
Ryan et al. (1995) conducted a large field experiment at four geographic sites, with a relevant conifer species at each site, to estimate baseline maintenance respiration for boles (stems) of each species. Measurement of carbon dioxide efflux for estimating maintenance respiration was done in autumn, when respiration from growth or construction was low or non-detectable. Ponderosa pine (Pinus ponderosa) represented a southwest region of the United States, slash pine (Pinus elliotti) represented the southeast region, red pine (Pinus resinosa) represented the northeast region and western hemlock (Tsuga heterophylla) represented the northwest region. They estimated that autumnal maintenance respiration of the conifer species used 5–13% of annual net carbon assimilation. This increased as temperatures increased at the sites.
Roots and Soil Respiration
Measuring respiration from leaves and stems can be accomplished fairly accurately. Measuring respiration from roots is more difficult as they are not readily available for use. Root respiration may be confounded when soil microbial respiration is also a factor, and it is difficult to separate the two forms of respiration. Soil respiration, then, is meant to include both types of respiration.
Hogberg et al. (2002) and Chen et al. (2014) divide soil respiration into two parts. Root respiration includes respiration from coarse and fine roots, and their mycorrhizae, and carbon dioxide from root exudates directly driven by photosynthesis. Heterotrophic respiration is from microbial decomposition of above- and below-ground soil organic matter from leaves, roots, and plant debris indirectly driven by photosynthesis.
Hogberg et al. (2002) estimate that 75% of carbon allocation to roots is respired and only 25% is used for growth. Pallardy (2008) concludes that root respiration may be up to 50% of the carbon dioxide released from soils, with much of it coming from fine roots near the surface and their mycorrhizal associations. Bloemen et al. (2016), however, believe that much of the root-respired carbon dioxide remains in the root system and is transported to the shoot in xylem sap. This controversy remains to be resolved.
Soil respiration has been proposed as the second largest flux of carbon dioxide between the terrestrial ecosystem and the atmosphere. It has been estimated that soil respiration releases 78–98 billion tonnes (GT) of carbon to the atmosphere annually, a larger emission of carbon dioxide than from fossil fuel combustion (Chen et al., 2014).
Respiration Acclimation
Photosynthesis and accompanying respiration both respond to air temperature. Both increase with temperature and are thus expected to increase with global warming. Warmer temperatures, due to increasing atmospheric carbon dioxide, will increase uptake of carbon dioxide, resulting in increased photosynthesis and carbon sequestration. Respiration, however, also increases as temperatures increase. This means that as the rate of photosynthesis increases, the rate of respiration, and release of carbon dioxide, will also proportionally increase. With increasing temperatures, the approximate 50:50 ratio of photosynthesis to respiration may change in the direction of respiration (Aschan et al., 2001). The concern is that increased temperatures may increase respiration and release of carbon dioxide, changing the carbon content of forests and increasing global warming (Turnbull et al., 2001; Reich et al., 2016; Griffin and Prager, 2017).
It was found, however, that rates of respiration can adjust or acclimate to increasing temperatures. This would result in decreased emissions of carbon dioxide in response to rising temperatures. This has been determined primarily in controlled experiments and field experiments of varying lengths. The rationale for this is uncertain, and it has been ascribed to changes in respiration responses to temperature. There is a suggestion that predictions of increased carbon dioxide emissions due to respiration may not be completely accurate (Griffin and Prager, 2017).
Reich et al. (2016) concluded that, while there was some evidence of acclimation of respiration to warming under controlled conditions, there was no long-term evidence of acclimation of respiration to warming temperatures in the field. They established a multiple-year study of the effects of increasing temperature by 3.4 °C above ambient on leaf respiration for young juvenile plants of 10 North American tree species under forest conditions. When comparisons were made to control plants that were not exposed to an increased temperature of 3.4 °C, they found that, on average, leaf respiration increased by 5%. They predicted that without respiration acclimation, the increase would have been 23%. Acclimation eliminated 80% of the expected increase in respiration. They concluded that if respiratory acclimation is a common response to temperature increase, then respiration rates from plants may not increase as much as predicted, and this contribution to global warming may be less than expected. Achieving similar results with older trees could prove to be difficult. More needs to be done to determine the extent and importance of acclimation of respiration to increasing temperatures.
4.4Factors Affecting Photosynthesis, Growth, and Carbon Storage
Trees use photosynthesis to fix carbon from carbon dioxide and either use it for growth or store it in sinks in stems, branches, and roots. It has been widely assumed and proposed that increasing levels of anthropogenic carbon dioxide will greatly stimulate photosynthesis in trees and other terrestrial vegetation, resulting in increased growth and carbon storage. Results from satellite scans conclude that it is likely that there is an extensive human-induced global greening or carbon dioxide fertilization effect in progress (Mao et al., 2016). Results from ground-based empirical research, however, may not completely support this conclusion.
Unlike animals including humans, trees and other plants must adapt or acclimate to changes in their immediate above-ground and below-ground environments. Their own inherent characteristics and requirements influence how effectively they can acclimate. This variability is not included in large predictive models or satellite scans, especially in relation to elevated carbon dioxide and photosynthesis. In these approaches, trees are often used as a generic term.
Photosynthesis is essential for tree growth. Trees and forests often occur in areas where essential conditions for tree growth and photosynthesis are limiting (Oren et al., 2001). Atmospheric limiting factors include stomatal function, light, temperature, and carbon dioxide (Cieslik et al., 2009; Rennenberg and Schmidt, 2010; Royal Society of Chemistry). Soil factors include available soil water and nutrients. Tree species, stage of plant development, age, canopy structure, leaf area, leaf age and longevity, and phenology are among inherent factors that affect photosynthesis. Inclusion of limiting factors in calculations or assessments of tree photosynthetic and growth responses to elevated carbon dioxide results in more relevant and realistic appraisals.
4.4.1The Law of Limiting Factors
F. F. Blackmann is credited with formulating the law of limiting factors in 1905. He developed it while studying factors affecting the rate of photosynthesis. “The law states that the rate of a physiological process will be limited by the factor which is in the shortest supply. Any change in the level of a limiting factor will affect the rate of reaction.” Based on his investigations, he concluded that the law of limiting factors determines the rate of photosynthesis (Royal Society of Chemistry). In a warming world, light intensity, temperature, carbon dioxide, soil water, and soil nutrients are likely major limiting factors for photosynthesis.
4.4.2Stomatal Function
Opening and closing of stomata regulates intake of carbon dioxide and water loss through transpiration. When enough carbon dioxide is present in the intercellular air spaces for photosynthesis, stomata close to conserve water. During transpiration via open stomata, evaporation of water cools surrounding air. Stomata also open to regulate internal leaf temperature to prevent overheating from exposure to strong sunlight. Stomata close during drought to save water (Cieslik et al., 2009).
4.4.3Light
Light in the photosynthetically active radiation (PAR) range of 400 to 700 nanometers is required for photosynthesis. The amount and intensity of ambient light depends on the weather, the season of the year, and the time of day. Light intensity typically peaks at noon in warm summer months that coincide with the growing season for plants. Photosynthesis may peak in the late afternoon and declines with darkness. Chlorophyll molecules respond to the light intensity they receive, and this affects generation of ATP and NADPH. Light-dependent reactions such as these are not temperature-dependent. In general, light intensity increases increase the rate of photosynthesis, unless limited by another factor (Royal Society of Chemistry).
The canopy structure of trees affects light availability. The light intensity diminishes within canopy depth. Light availability within the canopy regulates leaf area, leaf energy balance, water use, and photosynthesis (Ellsworth and Reich, 1993). Leaves at the top of the canopy, exposed to bright sunlight, may be light-saturated (Perry et al., 2008). This reduces the efficiency of their use of light for photosynthesis. Leaves within the canopy receive less light but are more efficient in using it in photosynthesis. With clouds, atmospheric aerosols from pollution, or BVOCs from trees, light intensity is reduced but is more uniformly distributed to and within tree canopies. Resulting reductions in overall PAR may reduce photosynthesis, but this may be balanced by the effectiveness of increased PAR at the top and within canopies in increasing photosynthesis. Until 1999, PAR in the global atmosphere was diminished (global dimming) by pollution aerosols. It has been estimated that the reduction and more uniform distribution of PAR increased global land carbon sinks from 1960 to 1999 by 25% (Mercado et al., 2009). Rap et al. (2018) have recently proposed the term “diffuse radiation fertilization” to describe the effect of BVOC aerosol particles that reduce direct sunlight and increase light distribution within tree and plant canopies, resulting in increased well-distributed photosynthesis and increased biomass productivity.
Seasonal rainfall and cloud cover may influence photosynthesis in evergreen tropical forests. With adequate rainfall and available soil water, photosynthesis is maintained and has increased during the dry winter season in tropical evergreen forests. Guan et al. (2015) are concerned that increasing cloud cover during the wet season will reduce PAR available for photosynthesis.
4.4.4Temperature
Trees and plants are affected by air temperatures in their immediate environment. Optimal temperatures for survival, photosynthesis, growth, and reproduction vary widely with species. Temperature also regulates the activity of enzymes that govern light-independent reactions of photosynthesis (Royal Society of Chemistry). Markings (2017) has detailed the response of these enzymes to low, medium, and high temperatures.
· Low temperatures: 32–50 °F (0–10 °C)
Enzymes are not efficient. Reduction in glucose production may stunt growth.
The limiting factor here is inefficient enzyme activity.
· Medium temperatures: 50–68 °F (10–20 °C)
Enzymes function at their optimal level. Photosynthesis rate is high and optimal.
The limiting factor here is the rate of stomatal diffusion into leaves.
· High temperatures: above 68 °F (20 °C) and 104 °F (40 °C)
Above 68 °F (20 °C), enzymes begin to be adversely affected by temperature and the rate of photosynthesis begins to decrease, even as increased diffusion of carbon dioxide into leaves may increase. At 104 °F (40 °C), enzymes lose shape and become denatured and ineffective. Even with optimal light and water, photosynthesis declines.
The limiting factor here is warming temperature effects on enzyme activity.
Lin et al. (2012) describe some processes that control the relationship of photosynthesis to temperature. The general assumption is that photosynthesis is limited by either the maximum rubisco (ribulose-1,5-phosphate carboxylase/oxygenase) carboxylation rate or the maximum regeneration rate of RUBP (ribulose-1,5-biphosphate). Both of these processes are temperature-dependent. The sensitivity of plant species and growth stage responses of photosynthesis to temperature vary in the comparative role played by these two biochemical processes.
4.4.5Thermal Acclimation of Photosynthesis to Temperature
With increasing ambient temperatures from global warming, there is interest in determining whether photosynthesis can acclimate to warming temperatures. Dillway and Kruger (2010) tested this in a large field experiment. They established a 900-km transect in Eastern North America crossing seven degrees of latitude with a 12 °C difference in temperature from low to high transect end. At intervals along the transect, they planted two boreal tree species (trembling aspen, Populus tremuloides, and paper birch, Betula papyrifera) and two temperate tree species (Eastern cottonwood, Populus deltoides, and sweetgum, Liquidambar styraciflua). Leaf photosynthetic metabolism was assessed, focusing on maximum rate of RUBP carboxylation and regeneration. Little evidence of photosynthesis acclimation by location was found for all species. Three tropical tree species were grown over a range of air temperatures, and carbon dioxide uptake and photosynthesis responses were determined. All species showed some indications of acclimation to increasing temperature. The conclusion was that photosynthesis of the tropical tree seedlings could probably acclimate to moderate temperature warming, but that carbon gain would decrease with warming (Slot and Winter, 2017).
4.4.6Stomatal Regulation
Stomatal regulation of internal carbon dioxide is affected by air temperature. Stomata respond to temperature and also to increases in vapor pressure deficit (the difference between water vapor pressure and saturation water vapor pressure at a given temperature) that occurs as temperatures rise. Vapor pressure deficit regulates stomatal aperture and conductance. It has been shown to increase with air temperature in experiments. The response of photosynthesis to temperature is affected by vapor pressure deficit effects on stomatal conductance.
4.4.7Water
Trees obtain most of their water from soil. Water must be available in soil to be absorbed by roots and then transferred via xylem, with nitrogen and other nutrients, to leaves where photosynthesis takes place. Transpiration of water vapor occurs whenever stomata are open. During gas exchange, water vapor diffuses outward, and carbon dioxide diffuses inward. Water is also necessary to maintain turgor pressure and protoplasm hydration (Kramer and Kozlowski, 1979; Larcher, 2003). Stomatal apertures narrow during water deficiency, and this reduces gas exchange, carbon dioxide diffusion, and photosynthesis. Protoplasm hydration is also affected, as are chloroplasts (Larcher, 2003). The extent of water stress depends on how the rate of water absorption from soil affects transpiration rate from leaves (Kramer and Kozlowski, 1979).
Predictions for the future include a warmer drier world. Drought is becoming more widespread, as is drought stress in trees. During drought stress, stomata close. Photosynthesis slows down or may stop, as little new carbon dioxide is available, and transpiration has stopped. Trees face a no-win situation when temperatures are elevated and drought occurs. Cieslik et al. (2009) describe two possible strategies by trees to cope with high temperature and drought: stomata open to provide leaf cooling, or stomata close to reduce water loss. Leaves overheat without transpirational cooling. If overheating continues, leaves may burn, discolor, and die. Cornic (2000) conclude that mild drought stress decreased stomatal aperture, and this was the cause of inhibition of photosynthesis.
4.4.8Nitrogen and Mineral Elements
Trees obtain nitrogen, phosphorus, and mineral elements from soil via the flow of water from soil to leaves in the transpirational stream. Trees growing in soils with sufficient available water, nitrogen, phosphorus, and other elements, under appropriate light and temperature conditions, exhibit a high rate of photosynthesis and water-use efficiency that allow them to approach their genetic potential. Many forests, especially in remote northern forests, do not exist under these ideal conditions and are deficient in nitrogen and other elements (Oren et al.2001; Perry et al., 2008). Fernandez-Martinez et al. (2014) analyzed how nutrient availability affected GPP and NPP. They concluded that forests in high-nutrient soils have high GPP and NPP. Forests growing in low-nutrient or nutrient-poor soils lose much of their GPP to respiration (Figures 4.1 and 4.2).
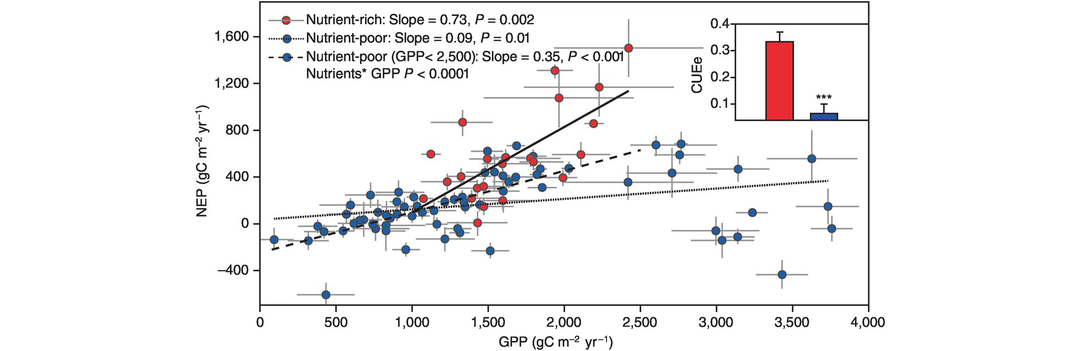
Figure 4.1
Only nutrient-rich forests substantially increase carbon sequestration with increasing carbon uptake.
The bar chart inside the main graph shows that carbon-use efficiency at the ecosystem level (CUEe, which is the ratio of net ecosystem production to gross primary production, NEP/GPP) in nutrient-rich forests (red) is more than five times as high as in nutrient-poor forests (blue). We also present results for forests with GPP < 2,500 gC m−2 yr−1, because values of GPP > 2,500 gC m−2 yr−1 were available only for nutrient-poor forests. When considering only forests with GPP < 2,500 gC m−2 yr−1, the Nutrient*GPP (where Nutrient = nutrient availability) interaction (where * indicates an interaction) is significant at the 0.006 level. In the bar chart, error bars indicate the s.e.m. and *** indicates significant differences at the P < 0.001 level.
Adapted by permission from Springer Nature: Springer Nature Ltd, Nature Climate Change, Nutrient availability as the key regulator of global forest carbon balance, M. Fernández-Martínez et al. © (2014)

Figure 4.2
The coupling between ecosystem respiration (Re) and gross primary productivity (GPP) is weak in nutrient-rich forests and very strong in nutrient-poor forests.
Nutrient-rich forests decouple Re from GPP, resulting in an increase in carbon accumulation with increasing GPP. When considering only forests with GPP < 2,500 gC m−2 yr−1, the Nutrient*GPP interaction (where * indicates an interaction and “Nutrient” = nutrient availability) is significant at the 0.005 level. Error bars indicate the uncertainty of the estimate on both the x and y axes (s.e.m.).
Adapted by permission from Springer Nature: Springer Nature Ltd, Nature Climate Change, Nutrient availability as the key regulator of global forest carbon balance, M. Fernández-Martínez et al. © (2014)
Craine et al. (2018) examined trends in foliar nitrogen concentrations over a 37-year period and concluded that foliar concentrations of nitrogen declined by 9%. This suggested that the amount of available nitrogen in relation to plant requirements is declining. This is a particular problem for trees now experiencing longer growing seasons and might affect growth, uptake, and sequestration of anthropogenic carbon dioxide.
Deficiencies in mineral elements can adversely affect chlorophyll and chloroplasts. Deficiencies in magnesium or iron can cause reduction in leaf chlorophyll and a yellow coloration called chlorosis. This slows uptake of carbon dioxide and reduces photosynthesis (Larcher, 2003). Wang et al. (2012) consider soil water and nitrogen to be major limiting factors for photosynthesis.
4.4.9Nitrogen
Trees, like many other plants, require more available nitrogen than any of the other 16 elements required for plant growth (Perry et al., 2008). Nitrogen in leaves is used in synthesis of chlorophyll, regulatory proteins, and enzymes. Nitrogen-containing enzymes in chloroplasts, which function in photosynthesis, contain approximately 75% of available foliar nitrogen. Rubisco, the primary enzyme in carbon fixation from carbon dioxide, contains approximately 20% of available foliar nitrogen. Nitrogen deficiency affects enzyme formation and chlorophyll synthesis and reduces photosynthesis. Leaf chlorophyll and nitrogen content correlate well (Kramer and Kozlowski, 1979; Larcher, 2003; Perry et al., 2008).
4.4.9.1Nitrogen Deposition
It has been widely assumed and proposed that atmospheric deposition of nitrogen will stimulate primary plant productivity in nitrogen-limited areas, which will increase sequestration of carbon from anthropogenic carbon dioxide. This would be accomplished by increased photosynthesis. Evidence for this from field experiments and models is controversial.
Most atmospheric nitrogen originates from combustion, primarily from vehicles. Atmospheric nitrogen is deposited in dry or wet modes. Dry deposition includes gases such as nitrogen dioxide (NO2), from combustion and ammonia (NH3) from animal agriculture (Reay et al., 2008). Some NO2 can also diffuse into substomatal cavities with carbon dioxide during gas exchange for photosynthesis. Nitrogen from NO2 can be used as a nutrient promoting growth. In wet deposition, nitrogen compounds are captured in water droplets which are deposited on leaves, stems, or soil where they can be used for plant growth. Janssens and Luyssaert (2009), however, consider that much of the wet atmospheric nitrogen deposition is lost to groundwater, evaporates back to the atmosphere, or becomes part of temporary tissues such as leaves and twigs that end up as litter on the ground. Nadelhoffer et al. (1999) concluded from 15N tracer studies in temperate forests that nitrogen deposition would not be a major contribution to increased tree growth and carbon storage.
4.4.9.2Nitrogen and Phosphorus Addition to Forest Soils
Trees growing under high or adequate nutrient conditions allocate more resources to biomass growth than to roots (Sara et al., 2012). Forest soils are often deficient in nitrogen and phosphorus, especially phosphorus in tropical soils, which limits net primary productivity (Wieder et al., 2015; Ellsworth et al., 2017; Schulte-Uebbing and de Vries, 2017; Jiang et al., 2018). Trees growing under nitrogen and phosphorus soil deficiencies allocate more resources to root development than shoot development, especially to large networks of fine roots to find soil nitrogen (Rennenberg and Schmidt, 2010). Concern has been raised about the impact of nitrogen and phosphorus limitations on carbon dioxide uptake, biomass formation, and carbon sequestration in relation to global warming predictions (Wieder et al., 2015). Many experiments have been conducted on the growth response of forest trees to additions of nitrogen to forest soils. They were designed to simulate the effects of atmospheric nitrogen deposition to forest soils on tree growth. Schulte-Uebbing and de Vries (2017) conducted a meta-analysis of tree responses to soil nitrogen. They concluded that temperate and boreal forest trees responded with increased growth and carbon fixation. Tropical forest trees did not show significant increases in growth and carbon fixation. Low soil phosphorus levels in tropical soils have been assumed to be a limiting factor for tropical tree growth responses to nitrogen added to soils. Addition of phosphorus to soils amended with nitrogen did not, however, result in significant increases in tropical tree growth and carbon fixation.
Thomas et al. (2009) concluded that the results from small plot studies and models regarding the nitrogen deposition and its effects on carbon sequestration were inconclusive and controversial. He used forest inventory data to determine that growth response of 24 temperate deciduous trees to nitrogen deposition varied considerably by species. Growth was enhanced for only 11 species. The role of mycorrhizal fungi was important in determining tree growth benefit from nitrogen added to soil. Trees with VA mycorrhizae, caused by obligate vesicular arbuscular (VA) fungi, had enhanced growth as they were unable to enzymatically break down added soil nitrogen and were able to use it.
Only a few forest trees have VA mycorrhizae. Acer rubrum, A. saccharum, Liriodendron tulipifera, and Prunus serotina are common trees with VA mycorrhizae. Most forest trees have ectomycorrhizal associations. They produce enzymes that break down added soil nitrogen and do not benefit as much from soil nitrogen deposition.
Many experiments with nitrogen deposition find that the response of trees to nitrogen deposition may be inconclusive, so sometimes phosphorus is included as well. Schulte-Uebbing and de Vries (2017) conducted a meta-analysis of tree responses to nitrogen addition. They concluded that there was good growth response by young temperate-zone trees. Tropical forests did not show positive growth responses to nitrogen deposition. Phosphorus was considered as a limiting factor, but phosphorus additions did not elicit significant growth responses.
Jiang et al. (2018) investigated the role of nitrogen and phosphorus additions on tree growth response in a tropical montane forest in Hainan Island, China, for a 5-year period. Nitrogen additions alone did not result in significant growth responses. Phosphorus additions alone resulted in enhanced growth of only small trees. Results from combined additions of nitrogen and phosphorus were not significantly different from those obtained with nitrogen application alone. Their results suggest that phosphorus regulates (or limits) tree growth in tropical forests. Ellsworth et al. (2017) found that adding phosphorus to a phosphorus-limited soil increased growth of trees in a broadleaved evergreen eucalyptus forest in Australia. Wieder et al. (2015) feel that projected estimates of future increases in NPP may be too high and may not be supported by adequate amounts of nitrogen, phosphorus, and other elements necessary to achieve the projected increases. They included limitations for nitrogen and phosphorus in projections for estimates of increased NPP by the end of the twenty-first century. They concluded that nitrogen limitations would decrease NPP by 19%. Phosphorus limitations decreased NPP by 25%. Taken together, these limitations would turn the terrestrial ecosystem into a net source of carbon dioxide.
4.4.10Seasonal Changes in Leaves and Photosynthesis
On a global scale, photosynthesis is constrained by the seasons of the year. Keeling et al. (1996) found that carbon dioxide levels were higher in winter and lower in summer in the Northern Hemisphere. This implied that photosynthesis was lower in winter than in summer and that this affected carbon dioxide levels. Wenzel et al. (2016) confirm that the lack of photosynthesis, fuel combustion for heating, and organic matter decomposition in winter constrain the influence of photosynthesis on global warming. Guan et al. (2015) used satellite imagery to determine how seasonal rainfall affected photosynthesis of evergreen tropical forests during the dry season. Canopy photosynthesis of some tropical forests declines during the dry season, while in others it continues as if they were in the wet season. They concluded that the extent of seasonal rainfall could be a threshold for forest function. They proposed that a rainfall threshold value of 2,000 mm yr−1 would allow the evergreen state of forests to be maintained during the dry season. Wu et al. (2016) proposed that not seasonal climate, but seasonal leaf phenology, was responsible for seasonality of photosynthesis in tropical evergreen forests. During the dry season, older leaves fall and are replaced by younger, more photosynthetically active leaves in the canopy.
Photosynthesis changes in leaves as they age throughout the growing season. The patterns and extent of change vary with environment and with species of deciduous and evergreen (conifer) trees. Jurik (1986) determined that carbon dioxide exchange rates for Populus grandidentata, Betula papyrifera, Quercus rubra, Acer rubrum and Fagus grandiflora increased in June and reached a maximum at full leaf expansion. This continued until mid-September and then declined until leaves died. Seasonal changes in canopy leaves of Quercus crispula were highest from June to August in summer and decreased in September (Hirosaka et al., 2007). Wilson et al. (2001) determined seasonal leaf development patterns, photosynthetic capacity, and senescence rates for leaves of Q. alba, Q. prinus, A. rubrum, A. saccharum, and Nyssa sylvatica. They compared their results to those from a model (CANOAK). The model used the maximum early season value for photosynthetic capacity for the entire growing season. They determined that the model overestimated seasonal carbon uptake by 50%. When allowances were made for mid- to late summer changes in leaf development and photosynthetic capacity, the model overestimation was 25%. Unlike deciduous trees, conifers produce new leaves (needles) annually and can retain older cohorts of needles for as long as 5 years. Needle age affects photosynthetic capacity. Jensen et al. (2015) found that needle cohorts of Picea mariana varied by age for photosynthetic activity. New youngest needles (Y0) had the lowest activity, followed by year one (Y1) and then year two (Y2).
4.4.11Tree Age
It has been proposed that mature trees and old-growth forests continue to grow and serve as continually expanding large sinks for carbon from photosynthesis and biomass production. They are not just neutral reservoirs of carbon conserved in wood. This has proven to be controversial and has led to differing conclusions (Bond, 2000; Luyssaert et al., 2008). Given the role often given to mature trees and old-growth forests in reducing anthropogenic carbon dioxide via photosynthesis, it is important to examine this issue. A few examples of many reports about this are given here.
The reference that supports the proposal that is most often cited is Luyssaert et al. (2008). Given favorable climate and nitrogen, old-growth forests store carbon in tree biomass, litter, and soil, and serve as global carbon sinks. Luyssaert et al. conducted a literature and database review for carbon flux estimates and NEP (net carbon balance of forest and soil). NEP was usually positive for forests ranging in age from 15 to 800 years old. They concluded that old-growth forests are important carbon sinks and therefore are not carbon-neutral or carbon sources. Stephenson et al. (2014) examined whether growth and biomass production in trees increases, remains constant, or declines with tree age and size. They evaluated actual measurements and observations for 403 global tropical and temperate tree species. In most cases, biomass growth increased with tree size. Compared to smaller trees, they concluded that large older trees continue to sequester large amounts of carbon via photosynthesis. The rationale for continuing carbon fixation by older trees was that continuing increase in total leaf area compensated for declining activity per leaf area unit.
Bond (2000), however, concluded from her review that changes in stomatal conductance and photosynthesis in trees and woody plants are age-related. Net photosynthesis declines with age.
Most of the carbon fixed by photosynthesis is stored in wood. Sillett et al. (2010) note that wood production increases with tree size and age and then typically declines as the tree reaches maturity at an age where wood production rate declines when one or more factors becomes limiting. The decline varies with tree species and environmental conditions. They compared wood production in relation to longevity in two very tall trees: Eucalyptus regens in Australia and Sequoia sempervirens in California. E. regens grows rapidly to great height but declines fairly quickly owing to fire and disease. S. sempervirens grows more slowly, sometimes for 1000 years or more, and continues to produce resistant heartwood.
Relating leaf age and level of function and photosynthesis to tree age has been the subject of many experiments. Thomas (2010) conducted an extensive field experiment to determine the course of gas exchange and leaf level photosynthesis, leaf area, size, mass, and nitrogen content in the upper canopy, and related these to tree age and dbh. Seedlings, saplings, pole-sized, intermediate, mature, and very old trees of Acer saccharum, Betula alleghaniensis, and Tilia americana were evaluated in a single uneven-sized forest. Photosynthetic capacity peaked at intermediate tree size and correlated with dbh. Bassow and Bazzaz (1998) measured gas exchange in relation to tree species in a mixed 60–70-year-old forest. Measurements at canopy tops and interiors indicated that gas exchange rate was highest for Quercus rubra, followed by Betula papyrifera, B. alleghaniensis, and A. rubrum. Yoder et al. (1994) compared net rates of photosynthesis per unit area for 1-year-old needles from mature Pinus ponderosa and P. contorta trees that had either stopped growing or had ceased growth. Net photosynthetic rates for needles on actively growing trees were 14–30% lower than for needles on trees that had stopped growing.
NPP has been observed to decline in trees and forests with age. This has been attributed to decline in photosynthesis and GPP. It has also been noted that water may become more limiting with tree age. Drake et al. (2010) proposed that hydraulic conductance rates of water from soil to leaves may limit photosynthesis due to extent of stomatal closure. Tang et al. (2014) examined traditional views that NPP declines with age in forests because rates of photosynthesis and GPP are stable but autotrophic respiration increases. They concluded that in ageing boreal and temperate forests, both GPP and respiration decline, with GPP declining more rapidly than dark respiration.
4.4.12Elevated Carbon Dioxide
Stomatal conductance determines the diffusion rate of carbon dioxide from ambient air into the substomatal cavity of a leaf. The rate of mesophyll conductance or resistance governs further internal diffusion to intercellular air spaces and eventually to chloroplasts and rubisco. Changes in stomatal conductance due to changes in stomatal aperture and mesophyll resistance affect the rates of this process (Niinemets et al., 2010; Long, 2012). Guard cells of stomates, which control the extent of stomatal aperture opening, respond to a number of environmental factors, such as light, humidity, and carbon dioxide (Morrison, 1998). Concentrations of carbon dioxide that are much higher than ambient are well known to decrease stomatal conduction, which can increase or stimulate photosynthesis (Long, 2012). Partial stomatal closure caused by elevated carbon dioxide increases resistance to water loss by transpiration, while maintaining a constant internal concentration of carbon dioxide for photosynthesis (Perry et al., 2008; Keenan et al., 2013).
When global brightening gradually began to replace global dimming in the 1980s, global warming became more evident, as did continuing increases in atmospheric carbon dioxide. Carbon dioxide was determined to be the most persistent of the reradiative gases and most likely the major cause of global warming. Numerous models began and have continued to predict that carbon dioxide in the future would increase considerably and could be as much as 100% higher than at present. Assumptions were made about the possible role of terrestrial plants, especially trees, in reducing increased levels of carbon dioxide through photosynthesis and storage of fixed carbon in wood and soil. How effective trees and forests might be in utilizing above ambient concentrations of carbon dioxide became the subject of hundreds if not a thousand or more experiments, beginning in the 1980s.
Given the size, complexity, and cultural requirements, trees are not typical of plants used in replicated experiments. The first experiments were short-term and done with potted tree seedlings in growth chambers or greenhouse compartments containing ambient carbon dioxide (then 370 ppm) or carbon dioxide as high as 800 ppm. Trees also respond differently at different growth stages, so it was realized that larger trees should be used in longer-term experiments under natural conditions. Branch chambers were used on older trees, large open-top chambers allowed use of saplings, and FACE (free air carbon dioxide exposure) systems could be used for up to 12 years. Three things became evident from all these experiments. First, there were many instances where elevated carbon dioxide stimulated tree growth. Second, there were differences between and within tree species regarding degree of incidence of growth stimulation. Third, after an initial period of stimulation of photosynthesis and growth, the stimulation levelled off or declined, indicating additional requirements for continued growth stimulation.
Forests often either occur naturally or are related to areas with low soil fertility (Oren et al., 2001). Plants grow well when nutrients, especially nitrogen, and water and light are readily available (Kramer and Kozlowski, 1979; Korner, 2003; Ainsworth and Rogers, 2007; de Dios et al., 2016). It was also known that low plant tissue levels of nitrogen could reduce the response of trees to elevated carbon dioxide (Cotrufo et al., 1998; Korner, 2003). This led to numerous field experiments on the effects of nitrogen and phosphorus on the response of trees to elevated carbon dioxide. An early conclusive experiment was conducted at the Duke Forest in FACE experiments with 550 ppm carbon dioxide exposure and maturing loblolly pines growing in place. Trees in a poor soil site did not respond to elevated carbon dioxide. Trees at a moderate-fertility site responded positively, but only for 3 years. When nitrogen fertilizer was added to the sites, large long-term increases in photosynthesis and growth were obtained in response to elevated carbon dioxide at 550 ppm (Figure 4.3). In a 12-year FACE experiment at Oak Ridge National Laboratory, Warren et al. (2014) found that sweetgum trees initially experienced increases in photosynthesis and biomass due to exposure to elevated carbon dioxide, but this was not sustained. Availability of soil nitrogen declined, and lack of nitrogen as well as acclimation to elevated carbon dioxide may have curtailed the rate of photosynthesis. Decreased soil nitrogen availability in trees was concluded to be due to a decrease in transpiration of soil water into roots and transport of less nitrogen and other elements to leaves because of partial stomatal closure on exposure to elevated carbon dioxide (McDonald et al., 2002; Taub and Wang, 2008). A decline in net carbon dioxide uptake and growth stimulation in response to continued exposure to elevated carbon dioxide reduces tissue nitrogen availability. This reduces maximum carboxylate (Vcmax) velocity of rubisco and RuBP generation capacity (Jach and Ceulemans, 2000; Rogers and Humphries, 2000; Ainsworth and Rogers, 2007). Rogers and Humphries (2000) concluded that decline of initial growth stimulation of net carbon dioxide uptake is almost entirely due to decline in Vcmax of rubisco.

Figure 4.3
a, A moderate-fertility Duke Forest site (averaged for 1999 and 2000); b, an infertile SETRES site (1997 and 1998). P values represent test results between ambient and elevated CO2 in each fertility level. In both sites, elevating only CO2 had no significant effect (in a, data without nutrient addition are the mean of the past 2 years); fertilizing in ambient CO2 had a significant effect; and fertilizing under elevated CO2 had significantly higher effects than the sum of the single CO2 and N effects. NS, not significant.
Adapted with permission from Springer Nature: Springer Nature Ltd, Nature, Soil fertility limits carbon sequestration by forest ecosystems in a CO2-enriched atmosphere, R. Oren et al. © (2001)
Phosphorus soil levels can be low in eucalyptus forests in Australia. Ellsworth et al. (2017) compared the growth and rates of photosynthesis of plots in an evergreen eucalyptus forest to elevated carbon dioxide, with and without phosphorus addition to soil for 3 years. Trees in the low-phosphorus soil did not increase growth in response to elevated carbon dioxide. Photosynthesis, however, increased by 19%. Trees in soil amended with phosphorus increased growth by 35% with elevated carbon dioxide (Figure 4.4) Phosphorus availability in soils may determine positive effects of elevated carbon dioxide.
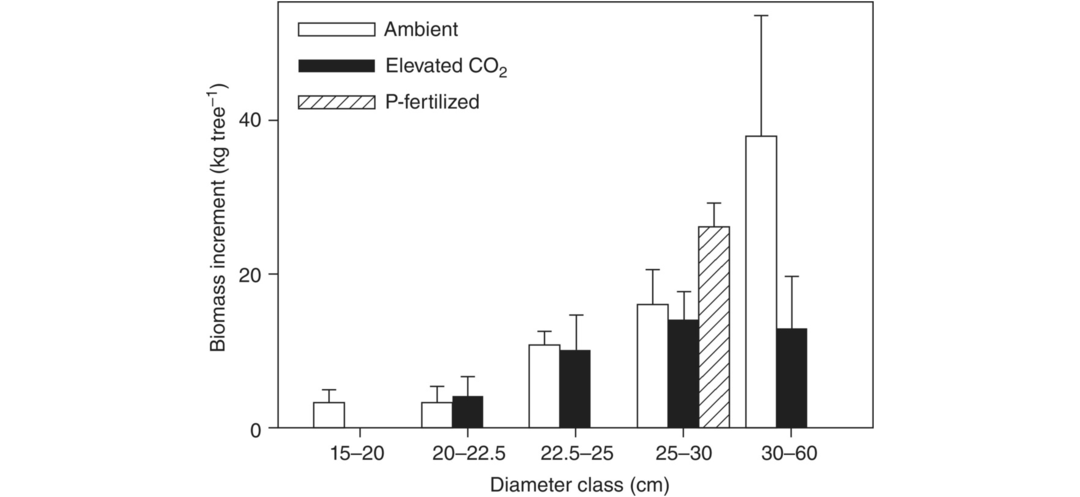
Figure 4.4
Shown is the biomass increment over 4 years from December 2011 to December 2015 within each size class for trees grown in ambient (open bars, mean ± s.e.m.) and elevated CO2 (dark bars, mean ± s.e.m.), and for ambient-grown trees with 4 years of P-fertilization (striped bar, mean ± s.e.m.). Diameter classes are defined as the diameter in December 2011 before the start of treatments. The biomass increment for elevated-CO2 trees in the first size class (15–20 cm) was not different from zero. Each combination of tree diameter class and treatment contained nine unsuppressed trees on average (N = 5 trees for P-fertilized). Bars are means +1 s.e.m. within each size class. The P-fertilized tree increment is significantly different from the ambient tree increment for the appropriate size class (P = 0.031; one-tailed t-test).
Adapted with permission from Springer Nature: Springer Nature Ltd, Nature Climate Change, Elevated CO2 does not increase eucalypt forest productivity on a low-phosphorus soil, D. S. Ellsworth et al. © (2017)
Tree response to elevated carbon dioxide varies between and within species. de Dios et al. (2016) conducted a meta-analysis search for elevated carbon dioxide effects on growth responses of trees within species, focusing on young trees, mostly in the genus Populus. They found variation in height, stem growth, stem biomass, stem volume, and photosynthesis. Growth responses, however, were not correlated with photosynthetic response. It was recommended that superior genotypes be selected for tree breeding and reforestation. Zhou et al. (2011) exposed Pinus korainensis and P. sylvestriformis to ambient (370 ppm) and elevated (500 ppm) carbon dioxide in open-top chambers for 8–9 years. They measured photosynthesis and specific leaf area on current and 1-year-old needles. Photosynthesis increased for both, but varied with needle age and pine species. Slow-growing P. korainensis did not acclimate to elevated carbon dioxide, but fast-growing P. sylvestriformis did.
Ghannoum et al. (2010) grew well-watered and well-fertilized faster-growing Eucalyptus saligna and slower-growing E. sideroxylon trees in glasshouse chambers with 290, 400, and 650 ppm carbon dioxide, and examined the effect of air temperature on response to carbon dioxide concentration. At ambient temperatures, elevated carbon dioxide did not stimulate eucalypt growth above that at the pre-industrial level of 290 ppm. Warming increased growth at elevated carbon dioxide, but not photosynthesis. Complete results are found in Figures 4.5 and 4.6.
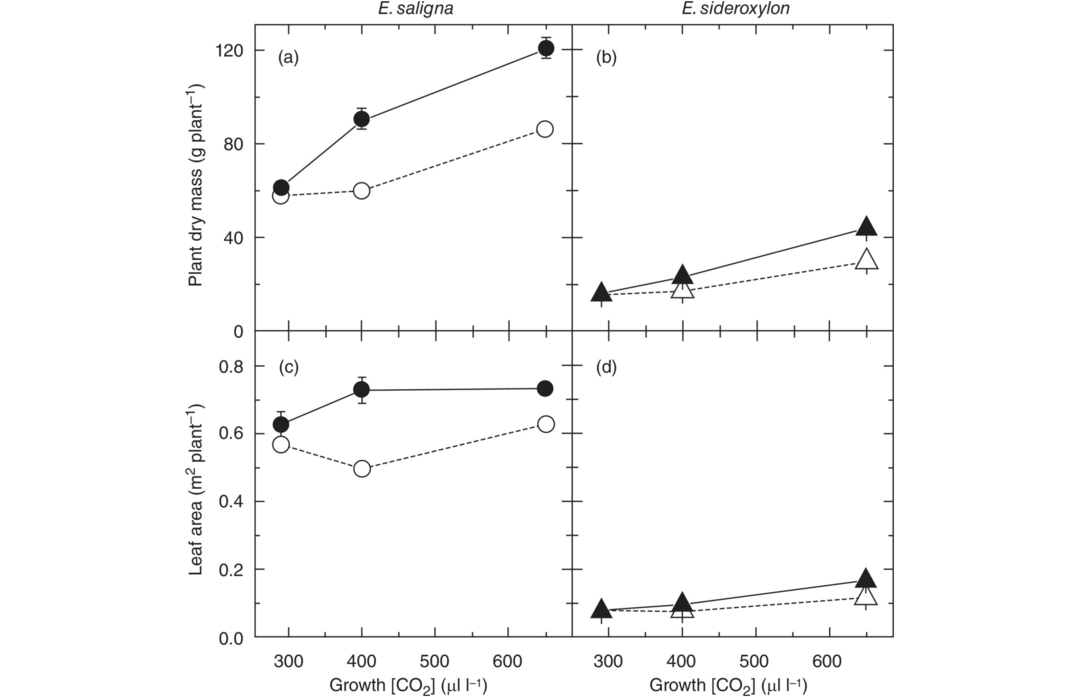
Figure 4.5
Total plant dry mass (a and b) and leaf area (c and d) of E. saligna (a and c) and E. sideroxylon (b and d) grown at three values of atmospheric [CO2] with day averages of 290, 400, or 650 μl l−1, and two air temperatures (ambient (▵○•) or high (ambient +4 °C, ○•▴)). Plants were harvested 150 days after planting. Values represent means ± SE.
From O. Ghannoum et al. Global Change Biology, Exposure to preindustrial, current and future atmospheric CO2 and temperature differentially affects growth and photosynthesis in Eucalyptus. Copyright © 2010 by John Wiley & Sons, Inc. Reprinted by permission of John Wiley & Sons, Inc.
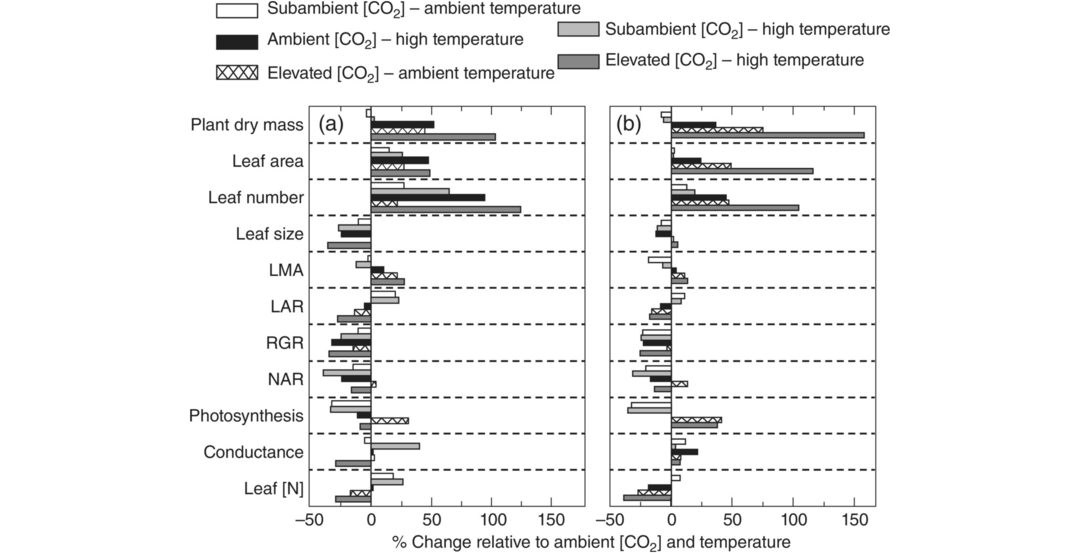
Figure 4.6
Percentage change of key physiological parameters of E. saligna (a) and E. sideroxylon (b) relative to current ambient conditions of CO2 and temperature. Five different scenarios of CO2 and temperature: subambient CO2 and ambient temperature (white bars); subambient CO2 and high temperature (light grey bars); ambient CO2 and high temperature (black bars); elevated CO2 and ambient temperature (checked bars); and elevated CO2 and high temperature (dark grey bars). LAR, leaf area ratio; LMA, leaf mass/area; RGR, relative growth rate; NAR, net assimilation rate.
From O. Ghannoum et al. Global Change Biology, Exposure to preindustrial, current and future atmospheric CO2 and temperature differentially affects growth and photosynthesis in Eucalyptus. Copyright © 2010 by John Wiley & Sons, Inc. Reprinted by permission of John Wiley & Sons, Inc.
4.4.13Leaf Age and Photosynthesis
Leaf age and longevity affect the response of leaves to elevated carbon dioxide. If leaf age is a factor, and leaf senescence is delayed by elevated carbon dioxide, in a longer autumn, this would affect tree carbon gain in a growing season (Herrick and Thomas, 2003). Jach and Ceulemans (2000) investigated the effect of leaf age and elevated carbon dioxide (ambient + 400 ppm) on photosynthesis in current and 1-year-old Scots pines (Pinus sylvestris) in open-top chambers for 2 years. Elevated carbon dioxide reduced photosynthesis in both current and 1-year-old needles by 18% and 23%. Herrick and Thomas (2003) investigated senescence and photosynthesis in sweetgum (Liquidambar styraciflua) leaves on trees exposed to elevated carbon dioxide in the Duke Forest FACE program. They found that elevated carbon dioxide increased photosynthesis until early November. Taylor et al. (2007) found that elevated carbon dioxide at 550 ppm in FACE exposures (AspenFACE USA and PopFACE Italy) delayed fall leaf color and leaf senescence for clonal Populus euroamericana. Leaf level photosynthesis and carbon uptake was increased by elevated carbon dioxide.
4.5Biogenic Volatile Organic Compounds (BVOCs)
The atmosphere contains numerous volatile organic non-methane small hydrocarbon compounds. Anthropogenic volatile organic compounds (AVOCs) originate primarily from incomplete combustion fuels. BVOCs are naturally released from plants, especially trees. The concentration of BVOCs in the atmosphere is at least 10 times greater than that of AVOCs, and, other than methane, they are the most frequently emitted small organic molecules (Unger, 2014b; Zhao et al., 2017). Dicke and Loreto (2010) estimate that more than 1,700 volatile compounds can be released by plants. Tropical forests in the Amazon are major emmiters of BVOCs, mainly isoprene (Greenberg et al., 2004). Isoprene and monoterpenes are the main BVOCs and are well known to influence many aspects of plant physiology and function, including leaf temperature, insect infestations, and drought response. Penuelas and Staudt (2009) have published a detailed review linking BVOCs to global climate change.
Diurnal patterns of temperature and light regulate synthesis and emissions of BVOCs (Wang et al., 2017). Emissions also play a role in formation of ozone, secondary aerosols, and cloud formation. Emissions strongly influence local atmospheric cooling and warming (Jokinen et al., 2015).
4.5.1Isoprene
Isoprene (C3H8 2-methyl-1,3-butadiene) is commonly associated with leaves of deciduous trees. Isoprene is not constitutive in leaves and is synthesized when needed. Synthesis requires carbon fixed in photosynthesis. Emission rates can be determined, as isoprene is emitted as soon as it is formed. Light and temperature control its synthesis and release. Emission does not occur in the dark or below 20 °C. Isoprene emission helps to reduce high temperatures of leaves exposed to full sunlight (Cieslik et al., 2009). Isoprene levels may be very high when the sun is shining, air temperature is high, and winds are calm. This could increase its role in the photochemical oxidant cycle with oxides of nitrogen that forms ozone (Chameides et al., 1988; Sharkey and Singaas, 1995; Dicke and Loreto, 2010). Increasing air temperatures may cause larger tree canopies in the future, which could result in increased emission of isoprene (Sharkey and Monson, 2014). Elevated carbon dioxide levels may promote growth and larger tree canopies, which could increase emissions of isoprene (Kumala et al., 2004). Sun et al. (2013) exposed hybrid poplars (Populus tremula × P. tremuloides) to 380 and 780 ppm carbon dioxide. Trees in elevated carbon dioxide had greater leaf area and greater emission rates of isoprene.
Trees naturally emit isoprene in varying amounts that differs by tree species and type. Considering its roles in ozone formation, secondary aerosol formation, and cloud formation, interest has developed in determining isoprene emission rates for common tree species. Suitable tree species, with lower natural emission rates for isoprene, could lower ozone levels and be appropriate for use in large-scale afforestation/reforestation programs. Benjamin et al. (1996). tested 124 native trees and shrubs for isoprene and monoterpene emission rates with the idea that species with high isoprene emission rates should not be included in new native plantings. Donovan et al. (2005) modeled scenarios for isoprene emissions from 30 tree species in the Midlands region of the United Kingdom with the aim of identifying low-emission species to recommend to reduce incidence of elevated photochemical oxidant events. They developed Urban Tree Air Quality Scores (UTAQS) for trees based on their potential to increase ozone formation. Pine, larch, and silver birch had positive effects on air quality, while oak, willows, and poplar had negative effects. A Tree BVOC Index was developed to identify low-emitting trees for use in future tree planting schemes (Simpson and McPherson, 2011). Aydin et al. (2014) determined BVOCs in emissions from 38 tree species (18 conifers and 20 broadleaved), growing in natural forests in Turkey. Isoprene was the major BVOC from broadleaved species with interspecies variability in oak species. Monoterpenes predominated in emissions from conifers.
4.5.2Monoterpenes
Monoterpenes (C10H16) are 10-carbon small-chain terpenes that contain two isoprene units. They are commonly found in leaves of conifers, including boreal black spruce (Picea mariana) and jack pine (Pinus banksiana) (Lerdau et al.1997). Monoterpenes can either be directly emitted or stored in resin ducts or glands. Unlike isoprene, synthesis is not required for emissions of monoterpenes (Loreto et al., 1996). Drought stress, excessive heat, mechanical injury, and insect activity can affect monoterpene emissions (Wang et al., 2017). Monoterpene emissions from leaves are controlled by the vapor pressure (VP) of monoterpenes in leaves, which is controlled by air temperature and monoterpene concentration within the leaves. High VP of monoterpenes results in volatilization from leaves (Lerdau et al.1997). Wang et al. (2017) monitored summer BVOC emissions from 118-year-old Norway spruce (Picea abies) trees with branch chambers. High temperatures in August induced maximum seasonal emission of BVOCs. Monoterpenes dominated, with only small levels of isoprene.
BVOCs are readily oxidized by ozone and OH (the hydroxyl radical). Low volatile organic compounds (LVOCs) can either form new particles or become part of existing particles, both of which enhance concentrations of secondary organic aerosols (SOAs) and formation of cloud condensation nuclei (Jokinen et al., 2015; Scott et al., 2018). The formation of cloud condensation nuclei is closely linked to oxidation of BVOCs from vegetation. Monoterpene oxidation produces large quantities of LVOCs, while oxidation of isoprene results in low concentrations of LVOCs. LVOCs from monoterpenes increase new particle formation, increase the size of existing particles, and produce more cloud condensation nuclei (Jokinen et al., 2015; Scott et al., 2018). Monoterpene emissions in boreal forests in Europe have been directly linked to SOA formation (Tunved et al., 2006). The size and composition of SOAs is affected by a number of environmental factors. Zhao et al. (2017) investigated the effects of temperature and aphid feeding on monoterpene emissions from boreal trees. They found that aphid feeding resulted in release of sesquiterpenes rather than only monoterpenes. This modified the composition of SOA and CCN activity. Temperature alone affected cloud condensation nuclei through an increase in size of SOA particles (Figure 4.7).

Figure 4.7
The schematic shows the interactions of environmental conditions, plant volatile organic compound (VOC) emissions, secondary organic aerosol (SOA), cloud formation, and climate. In unstressed conditions, plants emit constitutive VOC (black arrows on the left path), which on oxidation form SOA that act as cloud condensation nuclei (CCN) and can affect cloud formation and climate. Unfavorable environmental conditions (stresses) can induce VOC emissions (red arrows on the right path). Climatic changes and the resulting environmental conditions can affect the amount of constitutive VOC emissions and/or induce VOC emissions that modify the VOC composition. Such alterations in VOC emissions will be reflected in the particle size and/or particle composition. The latter determines the hygroscopicity parameter (κ) of the SOA, which is a measure of CCN activity at a given particle size. Both particle size and κ determine the number concentration of CCN (NCCN), and thus affect cloud formation and climate. +/− indicates the changes of parameters.
Adapted from Zhao et al. (2017).
SOA particles in the size range of 100 nanometers can act as cloud condensation nuclei to form cloud droplets. Cloud condensation nuclei here also include AVOCs (Topping et al., 2013). Cloud brightness and duration depends on the number of cloud droplets. Depending on elevation and nature, clouds could provide negative climate radiative forcing (Scott et al., 2018). Low clouds could also slow the return of infrared radiation to space and increase night warming. There is observational evidence for increased cloud cover over forests in Western Europe. The cloud cover has a higher albedo than the darker forests, so it may reflect more light back to space and have a cooling effect (Topping et al., 2013). The future of this kind of negative forcing effect for clouds is questioned by Unger (2014a) and Hantson et al. (2017). Deforestation has changed the forest cover of the Earth by 50%. Continuing deforestation will reduce BVOC emissions and secondary aerosols. A warmer climate may lead to lower emissions of monoterpenes if conifers are reduced or eliminated from reforestation or new forest plantings.
4.6Biogeophysical Factors
Biogeochemical and biogeophysical factors together affect tree growth and function and how they affect global warming and cooling. For convenience, they are considered separately in this chapter. Biogeophysical factors, such as albedo and evapotranspiration, have received considerable attention. They are key physical components that influence climate and integral parts of many climate change models. Biogeochemical factors, such as photosynthesis and BVOCs, have received less attention. Ozone is included in both categories. Its formation at above-background levels involves VOCs and BVOCs, and it is a physical factor affecting carbon dioxide uptake, evapotranspiration, and plant growth and development.
4.6.1Albedo
Sunlight provides energy for the Earth, and this determines its temperature, general climate, and weather. Sunlight enters at the top of the Earth’s atmosphere and moves downward to the surface of the Earth (NASA, 2011; Farmer and Cook, 2013; Climate Data Information, 2010–2015). NASA (2011) has calculated that a planetary average for energy from the sun is 340 watts per square meter. Approximately one-third is reflected back to space, leaving 240 watts per square meter to be absorbed or reflected by the atmosphere, land, and the ocean. How much of incident sunlight is absorbed or reflected by substances and surfaces depends on their exposure, color, and texture. Smooth light-colored surfaces will reflect more light than rougher or darker surfaces.
The degree of light reflection from a surface, without absorption, is called albedo (Farmer and Cook, 2013). Complete reflection has been assigned the number 1.0. Climate Data Information (2010–2015) has presented some albedo values of interest. Fresh clean snow has albedo from 0.80 to 0.90, declining to 0.40 with melting and age. The difference between snow cover and bare ground is approximately 0.50. Grassland albedo values may average 0.25, with deciduous trees at 0.15–0.18 and conifers at 0.08–0.15. The average albedo for the Earth is 0.30–0.31, but is affected by many factors, including deforestation, land cover changes, cloud cover, and secondary aerosols (NASA, 2011; Climate Data Information, 2010–2015).
Deciduous forests generally have higher albedo values than coniferous forests owing to the darker color of coniferous trees (Betts, 2000; Bonan, 2008; Naudts et al., 2016; Cherubini et al., 2017). Forests that reflect less light could absorb more solar radiation, warming the forests and surrounding areas (Mykleby et al., 2017). Low albedo values for forests, especially dark coniferous boreal forests, can cause positive radiative climate forcing (Betts, 2000; Bonan, 2008). Results from a simulation study suggested that in some boreal forests, positive forcing from low albedo values might offset negative forcing from carbon sequestration (Betts, 2000).
4.6.1.1Determinants for Forest Albedo
Kuusinen et al. (2015) propose that albedo values for forests are determined by structure, which affects light transmission into the forest, and the relative reflection by the components of biomass. Structure includes size and density of the trees, branches, and leaves. Biomass components include leaves, stems, branches, understory vegetation, or bare soil. Both structure and biomass vary considerably between tree species and locations. They used measurement data from 1,005 field plots in forests in central Finland together with airborne laser scanning data and high-resolution satellite albedo retrievals (Landsat) to investigate factors affecting albedo in summer. Albedo here was influenced by forest structure, tree species, and the composition of understory vegetation. Albedo decreased as the trees increased in size. Deciduous trees (Betula and Populus) had the highest albedo. Norway spruce (Picea abies) had the lowest albedo, with Scots pine (Pinus sylvestris) at an intermediate value.
4.6.1.2Deforestation, Afforestation, and Reforestation
Large-scale deforestation has considerable influence on albedo. Deforestation in boreal areas allows for more snow cover and higher albedo values, and decreases the warming influence from lower conifer albedo. In tropical regions, surface albedo is increased by deforestation. The cooling effect is decreased, however, by reduced transpiration and lower cloud albedo (Bonan, 1992, 2008; Betts, 2000).
Afforestation and reforestation are widely recommended to lower atmospheric carbon dioxide and reduce radiative forcing, resulting in a cooling effect. Restoring or increasing forest cover, particularly with conifers, means lower albedo levels than the previous grass or pasture areas. More radiation is absorbed by the forests, and this can lead to an increase in radiative forcing and a warming effect. Kirschbaum et al. (2011) conclude from this that decreased albedo and carbon storage are opposing processes, with the net effect on radiative forcing depending on the size of each. Extensive cumulative measurements of albedo and biomass data, from a developing Pinus radiata forest in New Zealand, were used to estimate net change in radiative forcing as the newly planted forest grew. By the end of the forest rotation, it was estimated that, although carbon storage increased, changes in albedo reduced the benefits from carbon storage by 17–24%. de Wit et al. (2014) concluded that natural expansion of the range of mountain birch into high-latitude non-forested areas would increase carbon sequestration and cooling, but would reduce albedo, which could cause warming. They modeled mountain birch expansion from 2000 to 2100. Forest canopy increased by 12–27% with an increase in biomass and carbon storage of 59%. Albedo in the new forested area went from 0.46 to 0.30. They estimated that the warming caused by the lower albedo in the new forest was 10–17 times greater than any cooling effect.
Mykleby et al. (2017) concluded that changes in albedo brought about by afforestation could affect net absorbed radiation. They simulated a comparison of the effects of differences in net radiation from afforestation in mid and high latitudes in North America on mitigation of global warming. They drew a boundary line across North America: south of the line, they projected cooling due to a positive equivalent carbon balance; north of the line, they projected negative equivalent carbon balance and warming, except for snow-covered areas.
Forests in Europe are largely planted and managed, often planted with single tree species with selected genotypes. Naudts et al. (2016) conducted an extensive review of forest management in Europe from 1750 to 1850. Deforestation was common, followed later by extensive replacement with new trees. Native deciduous trees were replaced with conifers, mainly Norway spruce (Picea abies) and Scots pine (Pinus sylvestris), chosen as good sources of useful wood that grew faster than deciduous trees. Conifers are darker in color and thus have lower albedo and absorb more solar radiation. Naudts et al. (2016) conclude that conifer forests in Europe warm the air, with a possible increase of 0.12 °C. Well-managed forests today store less carbon than forests in 1750. Large-scale use of conifers for reforestation or afforestation is not an effective strategy to reduce global warming. Tree species selection is essential for reforestation or afforestation. Hovi et al. (2016) conclude that increasing incidence of broadleaved (deciduous) trees in coniferous boreal forests has potential to raise forest albedo values.
4.6.2Evapotranspiration
In the forest hydrological cycle, water enters as rainfall, fog, cloud droplets, or snow. Fog and cloud droplets can be directly absorbed by leaves, especially at high elevations. When snow melts, some water is absorbed into soil and some evaporates. Rainfall is the most common form of water, especially in the tropics. In direct throughfall, some rain lands on the forest soil. A small part runs down stems and is known as stemflow. Some of the water on the leaf canopy drips to the ground or is evaporated in place. Soil water is taken up by plant roots and returned to the atmosphere via transpiration. It is estimated that 10% of water vapor in the air originates from transpiration, with the rest from the oceans, lakes, rivers, and streams. Remaining soil water may run off or contribute to soil water recharge, groundwater, and streamflow (Roberts, 2009; USGS, 2016; Ellison et al., 2017).
Evapotranspiration includes water returned to the atmosphere as water vapor from water on or in soil or forest litter, and water vapor from groundwater released from plants via stomata during transpiration (Schlesinger and Jasechko, 2014; USGS, 2016). Evaporation of water on leaves from rainfall, especially for trees with large canopies or high LAI, is usually not included, especially in models (Liu et al., 2017). Evapotranspiration is thus a collective term that includes evaporation from two related but very different water sources. Both can be measured separately and the contribution of each determined. This is most likely to occur in long-term field studies, where the use of the term is appropriate. Transpiration is the appropriate term for experiments involving stomatal conductance and release of water vapor. Schlesinger and Jasechko (2014) evaluated 81 ecosystem-scale field experiments in which evapotranspiration was divided into evaporation and transpiration. They concluded that 61% of evapotranspiration was attributable to transpiration alone. Jasechko et al. (2013) used isotopic effects to separate the contribution of evaporation and transpiration in evapotranspiration. They concluded that transpiration was the largest global water flux, and that transpiration was 80–90% of terrestrial evapotranspiration. In view of these findings, only transpiration will be considered here.
Transpiration is the process of outward diffusion of water vapor into the air surrounding a leaf through open stomata. This regulates leaf temperature. Heat is used in the internal cellular evaporative process, and diffusion of water vapor cools the air around and near the leaf. Diffusion of water vapor into the air also causes movement of more water and soluble nutrients from soil into the plant (Pallardy, 2008; Perry et al., 2008; Cieslik et al.2009). Most of the water in trees that is obtained from soil is released via stomatal diffusion to the air (Pallardy, 2008). Sunlight increases leaf temperatures, and trees can lose large volumes of water each day (Ellison et al., 2017). Larcher (2003) estimated that, in general, temperate trees could lose 200–350 liters of water for every kilogram of biomass, while release from tropical trees could be as high as 600–900 liters. Atmospheric conditions near a leaf, such as temperature, relative humidity, wind speed, sunlight and resulting linked leaf warming, as well as carbon dioxide and ozone concentrations, can affect stomatal opening. Lack of available soil water and differing water demands by tree species are key factors regulating stomatal opening (Pallardy, 2008; Cieslik et al., 2009; US Geological Survey, 2016). Partial or complete stomatal closure reduces demand for water from soil.
Perry et al. (2008) consider transpiration to be essential to the gas exchange process that leads to photosynthesis. Water vapor diffuses outward, and carbon dioxide diffuses inward, through open stomata. The water vapor diffuses more rapidly outward than carbon dioxide inward (Larcher, 2003). Water evaporation diffusion rates depend on the degree of opening (aperture) of the regulating stomatal guard cells. High leaf temperatures and/or optimal internal concentrations of carbon dioxide for photosynthesis can cause stomata to close to save water and thus reduce transpiration, soil water demand, and nearby air cooling (Pallardy, 2008; Cieslik et al., 2009; Holtum and Winter, 2010).
Photosynthesis requires water loss through transpiration. Water-use efficiency (WUE) relates water loss from transpiration to carbon gain in photosynthesis (Keenan et al., 2013; van der Sleen et al., 2015). Increased WUE is key to the concept that increasing carbon dioxide will cause corresponding partial stomatal closure, resulting in increased WUE due to lower transpiration. This will allow sufficient internal carbon dioxide concentrations to maintain a high level of photosynthesis, resulting in increased biomass. On a global scale this is known as Earth greening, global greening, carbon dioxide fertilization effect, or other descriptors (Keenan et al., 2013; Zeng et al., 2017). Increased WUE in Northern Hemisphere temperate and boreal forests for the past two decades appeared to be a result of the carbon dioxide fertilization effect. Increases in WUE were related to increasing rates of photosynthesis and carbon sequestration and decreased evapotranspiration (Keenan et al., 2013). Zeng et al. (2017) conducted an extensive review of the role of increased LAI and decrease in global albedo in Earth greening and global cooling. They concluded that LAI increase over a 30-year period caused a 0.09 °C decrease in global air temperature. Evapotranspiration was responsible for 70% and albedo for 6%. Increased LAI caused cooling in Eurasia, India, Northwest Amazonia, and the Sahel, but not in North America and East Asia. All things considered, they concluded that global land warming had been reduced by 12% for the past 30 years. Increased growth in tropical forests has been attributed to stimulation by elevated carbon dioxide. Holtum and Winter (2010) concluded that increased growth in tropical forests may not be due to the effects of carbon-dioxide-caused increases alone, but also to carbon-dioxide-caused decreases in transpiration and increased soil water content. Van der Sleen et al. (2015) measured stable carbon isotopes and annual growth rings in 1,100 understory and canopy trees in tropical forests in Bolivia, Cameroon, and Thailand. WUE increased over the past 150 years for all trees measured, as carbon dioxide levels were also increasing. Analysis of tree growth rings did not reveal an increase in tree growth in relation to increasing carbon dioxide. They questioned the common assumption that elevated levels of carbon dioxide alone will stimulate the growth of tropical trees.
Transpiration from forests plays a major role in the world’s hydrological cycles from atmospheric cooling to atmospheric recharge, rainfall, soil infiltration, plant water uptake and transpiration, groundwater recharge, and surface runoff. As much as 40% of rainfall over land may be attributable to water evaporation. Forests and hydrological cycles may be more effective in global cooling than photosynthesis and carbon sequestration (Ellison et al., 2017). Water from rainfall that does not infiltrate soil instead runs off and may affect streams and rivers. Gedney et al. (2006) identified increases in water runoff on a continental basis in the twentieth century. Using a model to evaluate causes such as deforestation, global dimming, climate change, and elevated carbon dioxide, they concluded that the most likely cause was reduction of plant transpiration due to partial or complete stomatal closure caused by increasingly elevated carbon.
4.6.3Ozone
Ozone is a secondary molecule that forms episodically in the atmosphere when the conditions are right for interactions of nitrogen dioxide (NO2) and ultraviolet light in sunlight at warm temperatures. Ultraviolet light dissociates NO2 to NO and an oxygen atom. The oxygen atom combines with an oxygen molecule (O2) to form O3, an unstable trivalent molecule which back reacts with NO and breaks down to reform NO2 and O2. Ozone cycles between formation and breakdown, and does not reach concentrations high enough to injure plants. This is background ozone, which may be 35–50 ppb in North America and Europe (Ainsworth et al., 2012). Introduction of AVOCs and BVOCs into the cycle, especially isoprene from tree leaves, interferes with the extent of O3 breakdown by NO, allowing more O3 to rise to concentrations that can cause plant injury. Ozone now is an air pollutant. It occurs primarily during warm summer months, which unfortunately coincides with the growing season for trees. Ozone concentrations are often highest in late afternoons, especially if long-range transport from urban areas is a factor (Ainsworth et al., 2012).
Ozone can be removed from the atmosphere by rain or by deposition to soil surfaces (Unger, 2012). Ozone can also make direct contact with leaf surfaces. Reactions can occur with surface cuticles and waxes over time, especially with persistent conifer leaves, resulting in changes in integrity that lead to leaking of cations and other soluble compounds, and possible foliar injury symptoms. Ozone makes contact with moist mesophyll cells in the substomatal cavity of a leaf, following inward stomatal diffusion during gas exchange. It elicits the formation of highly reactive oxygen species that cause cell injury. Ozone does not directly cause cell injury.
While diffusive conductances vary, stomata do not discriminate against inward diffusion of atmospheric gases. Ozone and carbon dioxide can both diffuse inward through stomata, while water vapor diffuses outward during transpiration. Stomatal aperture regulates diffusive conductance (Ainsworth et al., 2012). Reich (1987) concluded that differences in innate leaf diffusive conductance rates could be used to quantitatively predict ozone uptake by stomata and resulting effects on plant growth and carbon assimilation. He predicted that in a growing season, agricultural crops would be most sensitive to ozone, followed by hardwood trees and conifers. Jolivet et al. (2016) proposed that combination of atmospheric ozone concentrations with estimated stomatal conductance rates would allow good estimates of the amount of ozone uptake by a plant. This would allow for more accurate determination of a dose/response function. In many experiments, dose/response for plant exposure to ozone has been determined by measuring plant effects in response to the concentration of ozone used multiplied by the duration of the exposure, which was considered to be the effective ozone dose, without determining diffusive conductance for ozone.
As a toxicant, ozone can reduce tree growth, net primary productivity, and carbon storage. Long-term or chronic exposure can result in priority for assimilate accumulation and use in leaves, buds, and stems, and reduction of allocation to stems and roots. Roots serve as storage areas for assimilate to be used for annual renewal of above-ground shoot growth, and reduction in root storage could initiate tree decline (Cooley and Manning, 1987).
To be an effective toxicant, ozone must diffuse into the substomatal cavity of a leaf to cause formation of reactive oxygen species at a high enough concentration to cause cell injury and affect tree growth, function, and carbon storage. Ozone diffuses via stomata to the substomatal cavity. Depending on inherent genetic tree constitution, stomatal aperture, ozone concentration, and rate and duration of diffusion, reactive oxygen species are induced, which can injure or kill membranes, cells, and enzymes like rubisco. Limitation of injury can be accomplished by defensive compounds like constitutive reductive apoplastic ascorbate and others, such as superoxide dismutase, glutathione, and phenolics. The entering ozone concentrations may be too high for complete prevention of toxic effects of reactive oxygen species by defense compounds, resulting in cell damage (Ainsworth et al.2012; Jolivet et al., 2016). In addition to foliar damage to leaves, photosynthesis, starch, and sucrose metabolism may be affected. On a whole tree level, biomass, leaf area, and senescence may be affected. In a forest community, NPP may be reduced, and ozone-sensitive species may decline or be eliminated (Felser et al., 2007; Ainsworth et al., 2012).
Foliar ozone injury usually appears on leaves in mid to late summer. For deciduous tree leaves, it is evident first on the upper surface of older leaves. Injured areas do not cross veins. Injury symptoms can be considered to be acute or chronic. Acute injury results from periodic high ozone concentrations for a short time. Cell contents leak, and areas of epidermal cells may die, or individual or small groups of palisade parenchyma cells remain white or fill with black to red-brown pigments, creating a symptom called stipple, illustrated on leaves of milkweed (Asclepias) (Figure 4.8). Exposure to fluctuating low concentrations of ozone over time decreases photosynthesis by affecting chloroplasts, causing leaf chlorosis, illustrated on a leaf of Morning Glory (Ipomea) (Figure 4.9). Leaf bronzing from accumulation of phenolics and red-brown anthocyanins often results in premature senescence, illustrated on leaves of Gaylussacia (Figure 4.10).

Figure 4.8
Black punctate stipple and chlorosis on older leaves of common milkweed (Asclepias syriacus), Sheffield, Massachusetts.
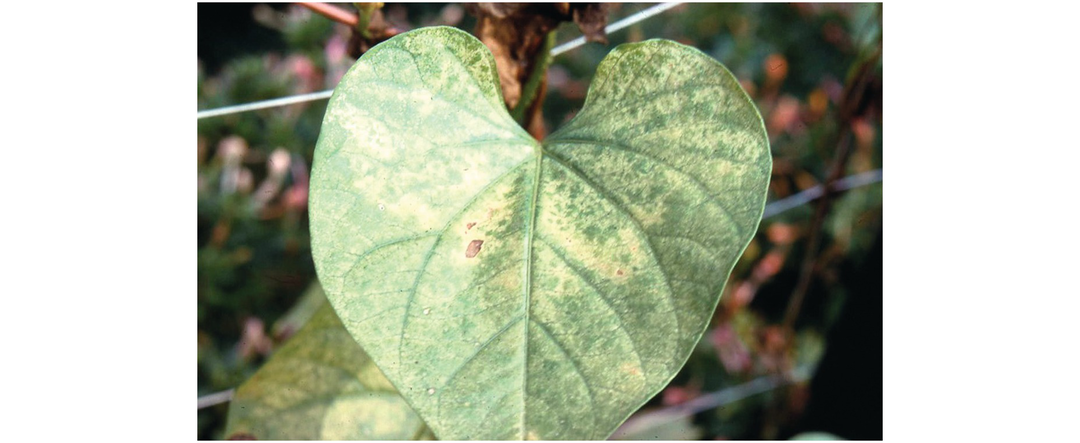
Figure 4.9
Chlorosis on older morning glory leaves (Ipomea purpurea cv. Heavenly Blue), Amherst, Massachusetts.

Figure 4.10
Red-brown phenolic leaf pigmentation on leaves of black huckleberry (Gaylussacia spp.), Quabbin Reservoir, Massachusetts.
Given the episodic nature of ozone concentrations, it is possible to find both acute and chronic ozone injury symptoms on the same leaf. Chlorotic mottle on first-year and older leaves on conifers, especially pines, is a common symptom of ozone injury. Extensive injury may result in defoliation (Manning and Feder, 1980; Krupa and Manning, 1988).
4.6.3.1Ozone and Trees
In the aftermath of World War II, there was a huge global upsurge in industrial development, power plant construction, new housing, trucks for commercial use, and personal cars. Inexpensive fossil fuels became readily available for power plants, home and commercial heating and cooling, and to power vehicles. Increased fuel consumption released oxides of nitrogen and AVOCs in ever-larger concentrations. The photochemical oxidant cycle began to form ozone at levels not experienced before. While it was suspected that human health was affected by ozone, it became obvious early on that trees were being affected by something. Ponderosa and Jeffrey pines in forests in the San Bernadino mountains in southern California were developing chlorotic mottling on needles that eventually led to extensive senescence by 1- to 2-year-old needles. Individual trees varied in the extent of chlorotic mottle and needle loss, with a few appearing unaffected (as illustrated in Figure 4.11). Chlorotic mottle was determined to be caused by high levels of ozone, transported there from Los Angeles, where it had formed. In addition to the effects of needle loss, affected trees became more susceptible to bark beetle infestations and root disease fungi, and began to die (Richards et al., 1968; Miller et al., 1997). This is the classic case of ozone-mediated forest decline (Figure 4.11). Significant ozone-influenced forest declines in other locations are described in Sanderman et al. (1997).

Figure 4.11
Variation in ozone tree sensitivity in Ponderosa pine (Pinus ponderosa) and Jeffrey pine (Pinus jeffreyi) forest in the San Bernadino forest above the Los Angeles Basin, Southern California.
Later, ozone injury became apparent on forest trees in the eastern United States. This prompted numerous and continuing surveys of trees in regional areas for foliar ozone injury symptoms. Felzer et al. (2007) summarized results from surveys in the Southern Appalachian Mountains and the Mid-Atlantic Region. Conclusions were that black cherry and yellow poplar were the most sensitive, with red maple, loblolly pine, and northern red oak being intermediate, and red spruce the most tolerant. Results from surveys are useful indicators of air quality for ozone. Correlations of foliar ozone injury symptoms with reductions in growth and carbon storage in a few instances for trees such as yellow poplar and loblolly pine have been reported, but this has not generally been the case (Felzer et al., 2007).
Ozone injury occurs on leaves of trees in forests wherever conditions are appropriate for its formation. Symptoms occur on trees in central and southern Europe, often on tree species originally imported for forestry from the United States. Ozone injury on as many as 19 tree species occurs in Beijing (Wan et al., 2014). Ozone injury on trees in remnants of the Southern Brazil Tropical Atlantic Forest, downwind of San Paulo, Brazil, is increasing (Moura et al., 2018). The potential for ozone injury of trees in the Amazon Basin is indicated from aircraft measurements of ozone from 40 ppb to 60 ppb in the east and south during the dry–wet season. Precursors from biomass burning may be a contributing factor (Bela et al., 2015).
Given the size, complexity, and climatic requirements of trees, there have been very few determinations of ambient ozone effects, under completely ambient conditions, on growth and carbon assimilation and storage in large, in situ trees. In their place, hundreds of short- and long-term experiments on predictive ozone effects on trees have been done with tree seedlings and saplings under varying degrees of controlled reductionist conditions, in indoor and outdoor chambers of various kinds, or in FACE systems. Extrapolation of results to ambient conditions and scaling up results to forest level may pose a challenge.
White pine (Pinus strobus) is native to much of the Eastern United States. Genetic differences in needle response to ambient ozone can be identified in natural stands. McLaughlin et al. (1982) used needle symptom conditions of 25-year-old white pine trees to select ozone-sensitive, intermediate, and tolerant trees for study near Oak Ridge, Tennessee. Growth ring analysis indicated a steady decline for the sensitive trees of 70% over 15 years, while the other categories were similar to each other. Respiration rate compared to photosynthesis was higher in sensitive trees. Photosynthate accumulated preferentially in foliage and branches, with less going to stems and roots, as determined by tracking 14C. Decline of sensitive trees was explained by needle loss, increased respiration, and altered translocation induced by ozone.
Bartholomay et al. (1997) examined radial growth rates for eight stands of white pine in Acadia National Park in Maine. Negative associations between ozone and tree core results were found for seven of the eight stands. Associations with tree core results were stronger for ozone than for associations with climate. Twenty-eight mature loblolly pines (Pinus taeda) were used for 5 years by McLaughlin and Downing (1995) to investigate interactive effects of ozone (40 ppb), low soil moisture, and high air temperatures on short-term stem expansion, using dendrochronometer bands. They concluded that annual radial growth was inversely related to low soil moisture and ozone.
4.6.3.2Present and Future Ozone
There is considerable interest in determining present ozone levels and predicting future levels. Conclusions from a meta-analysis indicate that present ozone concentrations ranging from 20 ppb to 65 ppb, with an average of 40 ppb, are found in the Northern Hemisphere. These ozone levels have been concluded to be likely to reduce the current forest carbon sink, and higher future ozone levels will increase this effect (Wittig et al., 2009). Reduction in precursors nitrogen dioxide and AVOCs has reduced the number of episodic high ozone concentration events. More frequent current lower ozone levels cause more chronic than acute ozone injury. Models predict, however, that if precursor levels increase, ozone could increase to 68–70 ppb (Sanderson et al., 2007; Sitch et al., 2007; Wittig et al., 2009; Klingberg et al., 2011). Long-range transport of ozone and ozone precursors from Asia, particularly China, affects ozone levels in the United States and Europe (Wittig et al., 2009).
Models predicting ozone effects on carbon sequestration by forests assume a certain level of uniformity in terms of genetic composition of species, size, age, and sensitivity to ozone. Wang et al. (2016) feel that this can lead to misleading results and conclusions, especially for deciduous forests. They propose that there are ozone-sensitive and ozone-tolerant individuals within the tree species that constitute the forest community. A possible example of differential responses of ponderosa pines (Pinus ponderosa) and Jeffrey pines (P. jeffreyi) to ozone in a forest in the San Bernadino mountains in Souhern California is shown in Figure 4.11. Ozone may select for ozone-tolerant trees and diminish ozone-sensitive trees. Their results suggest that the ozone-tolerant trees may not be negatively affected by ozone, and if they dominate the forest, ozone may not reduce the capacity of the forest to assimilate and sequester carbon from carbon dioxide. This may, however, result in increased isoprene emissions from trees that may tolerate ozone exposure better. This could result in an increase in atmospheric ozone, which would constitute a positive feedback from the forest.
4.6.4Ozone and Carbon Dioxide Interactions
Ozone and carbon dioxide can occur together in the atmosphere. Diffusion into stomata depends on external concentrations. Elevated concentrations of each can reduce stomatal aperture or close stomata completely, reducing or eliminating uptake and photosynthesis or cellular ozone injury. Stomatal closure induced by elevated carbon dioxide can prevent ozone diffusion (Sitch et al., 2007). As a result, ozone levels might stay the same or decrease in central and southern Europe (Klingberg et al., 2011). If extensive ozone diffusion is successful, ozone-caused reduction of NPP in forests may result in an increase in carbon dioxide in the atmosphere that could result in indirect radiative forcing (Unger, 2012).
It is widely assumed that continuing rising levels of carbon dioxide will reduce the effects of ozone on plants by reducing stomatal aperture or closing stomata. This was tested most extensively in the field in the world’s largest experiment on elevated carbon dioxide and ozone on growth and productivity of young forest trees, an 11-year-long experiment in the AspenFACE facility near Rhinelander, Wisconsin, USA. Uddling et al. (2010) determined stomatal flux rates for canopy and sun leaves of aspen and birch during long-term exposure to ambient and elevated concentrations of ozone, carbon dioxide, or both. Accumulated stomatal flux data indicated that stomatal flux was not reduced by elevated carbon dioxide. Stomatal flux rates were higher for aspen than for birch.
In long-term experiments with ambient and elevated ozone and carbon dioxide and combined exposures in the AspenFACE facility, ozone as low as 1.5 times ambient offset or moderated elevated carbon-dioxide-induced growth in aspen, aspen/birch, and aspen/maple plots. Ozone completely offset growth enhancement for both ozone-sensitive and ozone-tolerant aspen clones (Karnosky et al., 2003). Later evaluation of the aspen, aspen/birch, and aspen/maple FACE plots indicated differences in the effects of elevated carbon dioxide, elevated ozone, and a combination of both on tree biomass. Elevated carbon dioxide increased biomass by 25% for aspen, 45% for aspen/birch, and 60% for aspen/maple. Elevated ozone reduced biomass by 24% for aspen, 13% for aspen/birch, and 14% for aspen/maple. Elevated carbon dioxide and elevated ozone reduced biomass for aspen by 7.8%, increased biomass for aspen/birch by 8.4%, and increased biomass for aspen/maple by 24.3% (King et al., 2005). These results indicate that under these circumstances, elevated carbon dioxide effects on reducing ozone injury are species-specific and range from incomplete to partial. The role of elevated carbon dioxide in reducing ozone effects on trees in a forest requires further investigation.
4.7Summary and Transition
Biogeochemical and biophysical factors were considered separately here. How they interact affects physiology, growth, biomass accumulation, and carbon storage by trees. How trees grow and function determines how effective they can be in cooling the atmosphere. Fixing carbon from carbon dioxide in photosynthesis provides removal, storage, and potential cooling. This is a negative climate forcing process. Photosynthesis is affected by light intensity, air temperature, carbon dioxide, soil water and nutrients, and vapor pressure deficit. Carbon gain in photosynthesis is offset by respiration. Light reflection (albedo) by darker-colored forests, especially conifers, is low, resulting in a warming effect. Transpiration and photosynthesis occur together. Transpiration from a forest can cool the air. Partial stomatal closure by elevated carbon dioxide reduces soil water uptake and transpiration, and is largely responsible for increased biomass. Decreased transpiration results in reduced air cooling, which can be a positive climate forcing process, increasing air temperature. Trees emit isoprene and other BVOCs. Together with AVOCs from combustion, these can increase production of ozone in the photochemical oxidant cycle. Ozone can reduce tree growth and carbon storage. It is also a reradiative or greenhouse gas, contributing to air warming. BVOCs and AVOCs also influence cloud formation and aerosol formation, which can result in either air warming or cooling.
Tree responses to a continually warming world is considered in the next chapter. Warmer days and nights, and drought, are affecting the ways that trees and forests function. Phenology, leaf longevity, photosynthesis, respiration, and evapotranspiration are affected. Forest fires are increasing as are incidences of insect pests and diseases. Deforestation continues at a record rate.
REFERENCES
Agren, G. I., Axelsson, B., Flower-Ellis, J. G. K. et al. 1980. Annual budget for a young Scots pine. Ecological Bulletin 32: 307–313.
Ainsworth, E. A. and Rogers, A. 2007. The response of photosynthesis and stomatal conductance to rising CO2: mechanisms and environmental interactions. Plant, Cell and Environment 30: 258–270. doi: 10.1111/j.1365-3040.2007.016441.x.
Ainsworth, E. A., Yenderek, C. R., Sitch, S., Collins, W. J. and Emberson, L. D. 2012. The effects of tropospheric ozone on net primary productivity and implications for climate change. Annual Review of Plant Biology 63: 637–661. doi: 10.1146/annurev-arplant=042110-103829.
Aschan, G. and Pfanz, H. 2003. Non-foliar photosynthesis – a strategy for additional carbon acquisition. Flora 198: 81–97.
Aschan, G., Wittmann, C. and Pfanz, H. 2001. Age-dependent bark photosynthesis of aspen twigs. Trees 15: 431–437. doi: 10.1007/s00460100120.
Avila-Lovera, E. and Ezcurra, E. 2016. Stem-succulent trees from the Old and New World tropics. In Tropical Tree Physiology, eds Louis S. Santiago and Guillermo Goldstein. Berlin: Springer, pp. 45–65.
Avila-Lovera, E., Herrera, A. and Tezara, W. 2014. Contribution of stem CO2 fixation to whole-plant carbon balance in nonsucculent species. Photosynthetica 52: 3–15. 10.1007/s11099-014-0004-2.
Aydin, Y. M., Yaman, B., Koca, H. et al. 2014. Comparison of biogenic volatile organic compound emissions from broad leaved and coniferous trees in Turkey. WIT Transactions on Ecology and the Environment 181: 647–658.
Bartelink, H. H. 1997. Allometric relationships for biomass and leaf area of beech (Fagus sylvatica L.). Annals of Forest Science 54: 39–50.
Bartholomay, G. A., Eckert, R. T. and Smith, K. T. 1997. Reductions in tree-ring widths of white pine following ozone exposure at Acadia National Park, Maine, U.S.A. Canadian Journal of Forest Research 36: 361–368.
Bassow, St. and Bazzaz, F. A. 1998. How environmental conditions affect canopy leaf-level photosynthesis in four deciduous tree species. Ecology 79: 2660–2675.
Bela, M. M., Longo, K. M., Freitas, S. R. et al. 2015. Ozone-production and transport over the Amazon Basin during the dry-to-wet and wet-to-dry transition seasons. Atmospheric Chemistry and Physics 15: 757–782. doi: 10.5194/acp-15-757/2015.
Benjamin, M. T., Sudol, M., Bloch, L. and Winer, A. M. 1996. Low-emitting urban forests: a taxonomic methodology. Atmospheric Environment 30: 1437–1452. doi: 10.1016/1352-2310(95)00439-4.
Betts, R. A. 2000. Offset of the potential carbon sink from boreal forestation by decreases in surface albedo. Nature 408: 187–190. doi: 10.1038/35041445.
Bloemen, J., Teskey, R. O., McGuire, M. A., Aubrey, D. P. and Steppe, K. 2016. Root xylem CO2 flux: an important but unaccounted-for component of root respiration. Trees 30: 343–352. doi: 10.1007/s00468-015-1185-4N.
Bonan, G. B. 1992. Effects of boreal forest vegetation on global climate. Nature 359: 716–718.
Bonan, G. B. 2008. Forests and climate change: forcings, feedbacks, and the climate benefits of forests. Science 320: 1444–1449. doi: 10.1126/science.1155121.
Bond, B. 2000. Age-related changes in photosynthesis of woody plants. Trends in Plant Science 5: 349–353. doi: 10.1016/S1360–1385(00)01691-5.
Breda, N. J. J. 2003. Ground-based measurements of leaf area index: a review of methods, instruments, and current controversies. Journal of Experimental Botany 54: 2403–2407. doi: 10.1093/jxb/erg263.
Bruggemann, N., Gessler, A., Keel, S. G., et al. 2011. Carbon allocation and carbon isotope fluxes in the plant–soil–atmosphere continuum: a review. Biogeosciences 8: 3457–3489. doi: 10.5194/bg-8-3457/2011.
Chameides, W. L., Lindsay, W. R., Richardson, J. and Kiang, C. S. 1988. The role of biogenic hydrocarbons in urban photochemical smog: Atlanta as a case study. Science 241: 1473–1475.
Chen, G., Yang, Y. and Robinson, D. 2014. Allometric constraints on, and trade-offs in, ground carbon allocation and their control of soil respiration across global forest ecosystems. Global Change Biology 20: 1674–1682 doi: 10.1111/gcb.1294.
Cherubini, F., Vezhapparambu, S., Bogren, W., Astrup, R. and Stromman, A. H. 2017. Spatial, seasonal, and topographical patterns of surface albedo in Norwegian forests and cropland. International Journal of Remote Sensing 38: 4565–4586.
Cieslik, S., Omasa, K. and Paoletti, E. 2009. Why and how terrestrial plants exchange gases with air. Plant Biology 11: 24–34.
Climate Data Information. Albedo. 2010–2015. www.climatedata.info/forcing/albedo (accessed 11/02/2018).
Cooley, D. R. and Manning, W. J. 1987. The impact of ozone on assimilate partitioning in plants: a review. Environmental Pollution 47: 95–113. doi: qo.1016/0269-7491 (87)90040-6.
Cornic, G. 2000. Drought stress inhibits photosynthesis by decreasing stomatal aperture – not by affecting ATP synthesis. Trends in Plant Science 5: 187–188.
Cotrufo, M. F., Ineson, P. and Scott, A. 1998. Elevated CO2 reduces the nitrogen concentration of plant tissues. Global Change Biology 4: 43–54.
Craine, J. M., Elmore, A. J., Wang, L. et al. 2018. Isotopic evidence for oligotrophication of terrestrial ecosystems. Nature Ecology and Evolution: 2: 1735–1744. doi: 10.1038/s41559–018-0694-0.
Dandois, P. and Ellis, E. C. 2010. Remote sensing of vegetation structure using computer vision. Remote Sensing 2: 1157–1176. doi: 10.3390/rs2041157.
de Dios, V. R., Mereed, T. E., Ferrio, J. P., Tissue, D. T. and Voltas, J. 2016. Intraspecific variation in juvenile tree growth under elevated CO2 alone and with O3: a meta-analysis. Tree Physiology 36: 682–693. doi: 10.1093/treephys/twp026.
De Kauwe, M. G., Medlyn, B. E., Zaehle, S. et al. 2014. Where does the carbon go? A model–data intercomparison of vegetation carbon allocation and turn-over processes at two temperate forest free-air CO2 enrichment sites. New Phytologist 203: 883–899. doi: 10.1111/nph.12847.
de Wit, H. A., Bryn, H. A., Hofgaard, A. et al. 2014. Climate warming feedback from mountain birch forest expansion: reduce albedo dominates carbon uptake. Global Change Biology 20: 2344–2355. doi: 10.1111/gcb.12483.
Dicke, M. and Loreto, F. 2010. Induced plant volatiles: from genes to climate change. Trends in Plant Science 15: 115–117. doi: 10.016/j.tplants.2010.01.007.
Dickson, R. E. 1989. Carbon and nitrogen allocation in trees. Annals of Forest Science 46: supplement 631s–647s.
Dietz, M. C., Sala, A., Carbone, M. S. et al. 2014. Nonstructural carbon in woody plants. Annual Review of Plant Biology 65: 667–687. doi: 10.1146/annurev-arplant-050213-040054.
Dillway, D. N. and Kruger, E. L. 2010. Thermal acclimation of photosynthesis: a comparison of boreal and temperate tree species along a latitudinal transect. Plant, Cell and Environment 33: 888–899. doi: 10.1111/j.1365-3040.2010,02114.x.
Dittmann, S., Thiessen, E. and Hartung, E. 2017. Applicability of different non-invasive methods for tree mass estimation: a review. Forest Ecology and Management 398: 208–215. doi: 10.1016/jforeco.2017.05.013.
Donovan, R. G., Stewart, H. E., Owen, S. M., Mackenzie, A. R. and Hewitt, C. N. 2005. Development and application of an urban tree air quality score for photochemical pollution episodes, using the Birmingham, United Kingdom area as a case study. Environmental Science and Technology 39: 6730–6738. doi: 10.1021/es050581y.
Drake, J. E., Raetz, L. M., Davis, S. C. and Delucia, E. H. 2010. Hydraulic limitation not declining nitrogen availability causes the age-related photosynthetic decline in loblolly pine (Pinus taeda L.). Plant, Cell and Environment 33: 1756–1766.
Duursma, R. A., Kolari, P., Permaki, M. et al. 2009. Contributions of climate, leaf area index and leaf physiology to variations in gross primary production of six coniferous forests across Europe: a model-based analysis. Tree Physiology 29: 621–629. doi: 10.1093/treephys/tpp010.
Ellison, D., Morris, C. E., Locatelli, B. et al. 2017. Trees, forests and water: Cool insights for a hot world. Global Environmental Change 43: 51–61. doi: 10.1016/j.gloenvcha.2017.01.02.
Ellsworth, D. S. and Reich, P. B. 1993. Canopy structure and vertical patterns of photosynthesis and related leaf traits in a deciduous forest. Oecologia 96: 169–178.
Ellsworth, D. S., Anderson, I. C., Crous, K. Y. et al. 2017. Elevated CO2 does not increase eucalypt forest productivity on a low phosphorus soil. Nature Climate Change 6: 279–281.
Epron, D., Bahn, M., Derien, D. et al. 2012. Pulse-labelling trees to study carbon allocation dynamics: a review of methods, current knowledge and future prospects. Tree Physiology 32: 776–798. doi: 10.1093/treephys/tps057.
Ericsson, T., Rytter, L. and Vapaavuor, E. 1996. Physiology of carbon allocation in trees. Biomass and Bioenergy 11: 115–127.
Fan, H., McGuire, M. A. and Teskey, R. O. 2017. Effects of stem size on stem respiration and its flux components in yellow-poplar (Liriodendron tulipifera L.) leaves. Tree Physiology. doi: 10.1093/treephys/tpx084.
Farmer, G. T. and Cook, J. 2013. Earth’s albedo, radiative forcing and climate change. In: Climate Change Science: A Modern Synthesis, Vol. 1, Physical Climate. Dordrecht: Springer, pp. 217–229.
Felzer, B. S., Cronin, T., Reilly, J. M., Melillo, J. M. and Wang, X. 2007. Impacts of ozone on trees and crops. Comptes Rendus Geoscience 339: 784–798. doi: 10.1016/j.crte.2007.08.008.
Fernandez-Martinez, S., Vicca, I. A., Janssens, J. et al. 2014. Nutrient availability as the key regulator of global carbon balance. Nature Climate Change 4: 471–478. doi: 10.1038/nclimate2177.
Frank, D.C., Poulter, B., Saurer, M. et al. 2015. Water-use efficiency and transpiration across European forests during the Anthropocene. Nature Climate Change 5. doi: 10.1038/nclimate2614.
Gedney, N., Cox, P. M., Betts, R. A. et al. 2006. Detection of direct carbon dioxide effect in continental river runoff records. Nature Geoscience 439: 835–838. doi: 10.1038/nature04504.
Ghannoum, O., Phillips, N. G., Sears, M. E. et al. 2010. Photosynthetic responses of two eucalypts to industrial-age changes in atmospheric CO2 and temperature. Plant, Cell and Environment 33: 1671–1681. doi: 10.1111.j.1365-3040.2010.02172.x.
Greenberg, J. P., Guenther, A. B., Petron, G. et al. 2004. Biogenic VOC emissions from forested Amazonian landscapes. Global Change Biology 10: 651–662. doi: 10.1111/j.1529-8817.2003.00758.x.
Griffin, K. L. and Prager, C. M. 2017. Where does all the carbon go? Thermal acclimation of respiration and increased photosynthesis in trees at the temperate-boreal ecotone. Tree Physiology 37: 281–284. doi: 10.1093/treephys/tpw133.
Guan, K., Pan, M., Li, H. et al. 2015. Photosythetic seasonality of global tropical forests constrained by hydroclimate. Nature Geoscience 8. doi: 10.038/ngeo2382.
Hantson, S., Knorr, W., Schurgers, G., Pugh, T. A. M. and Arneth, A. 2017. Global isoprene and monoterpene emissions under changing climate, vegetation, CO2 and land use. Atmospheric Environment 155: 35–45. doi: 10.1016/j.atmosenv.2017.02.010.
Helmisaari, H.-S., Makkonen, K., Kellomaki, S., Valtonen, E. and Malkonen, E. 2002. Below-ground and above-ground biomass, production and nitrogen use in Scots pine stands in eastern Finland. Forest Ecology and Management 165: 317–326.
Herrick, J. D. and Thomas, R. B. 2003. Leaf senescence and late-season net photosynthesis of sun and shade leaves of overstory sweetgum (Liquidambar styraciflua) grown in elevated and ambient carbon dioxide concentrations. Tree Physiology 23: 109–118.
Hirosaka, K., Nabeshima, E. and Hiua, T. 2007. Seasonal changes in the temperature of photosynthesis in canopy leaves of Quercus crispula in a cool-temperature forest. Tree Physiology 27: 1035–1041.
Hogberg, P., Nordgren, A. and Agren, G. I. 2002. Carbon allocation between tree root growth and root respiration. Oecologia 132: 579–581 doi: 10.1007/s00442-002-0983-8.
Hogberg, P., Hogberg, M. N., Gottlicher, S. G. et al. 2008. High temporal resolution tracing of photosynthate carbon from the tree canopy to forest soil microorganisms. New Phytologist 177:220–228. doi: 10.1111/j.1469-8137.2007. 02238.x.
Holtta, T., Mencuccini, M. and Nikinmaa, E. 2014. Ecophysiological aspects of phloem transport in trees. In: Trees in a Changing Environment. Plant Ecophysiology No. 9, eds. M. Tausz and N. Grulke. Dordrecht: Springer Science+Business Media, Chapter 2.
Holtum, J. A. M. and Winter, K. 2010. Elevated CO2 and forest vegetation: more a water issue than a carbon issue? Functional Plant Biology 37: 694–702. doi: 10.1071/FP10001.
Hovi, A., Liang, J., Korhonen, L., Kobayashi, H. and Rautiainen, M. 2016. Quantifying the missing link between forest productivity and albedo in the boreal zone. Biogeosciences 13: 6015–6030. doi: 10.5194/bg-13-2016.
Jach, M. E. and Ceulemans, R. 2000. Effects of season, needle age and elevated atmospheric CO2 on photosynthesis in Scots pine (Pinus sylvestris). Tree Physiology 20: 145–157. doi: 10.1093/treephys/20.3.145.
Janssens, I. A. and Luyssaert, S. 2009. Nitrogen’s carbon bonus. Nature Geoscience 2: 318–319.
Jasechko, S., Sharp, Z. D, Gibson, J. et al. 2013. Terrestrial water fluxes dominated by transpiration. Nature 496: 347–351. doi: 10.1038/nature11983.
Jensen, A. M., Warren, J. M., Hanson, P. J., Childs, J. and Wullschleger, S. D. 2015. Needle age and season influence photosynthetic temperature response and total annual carbon uptake in mature Picea mariana trees. Annals of Botany 116: 821–832. doi: 10.1093/aob/mcv115.
Jiang, L., Tian, D., Ma, S. et al. 2018. The response of tree growth to nitrogen and phosphorus additions in a tropical montane rainforest. Science of the Total Environment 618: 1064–1070. doi: 10.1016/j.sciotenv.2017.09.099.
Jokinen, T., Berndt, T., Makkonen, R. et al. 2015. Production of extremely low volatile organic compounds from biogenic emissions: measured yields and atmospheric limitations. Proceedings of the National Academy of Sciences 112: 7123–7128. doi: 10.1073/pnas.1423977112.
Jolivet, Y., Bagard, M., Cabane, M. et al. 2016. Deciphering the ozone-induced changes in cellular processes: a prerequisite for risk assessment at the tree and forest levels. Annals of Forest Science 73: 923–943. doi: 10.1007/s13595-016-580-3.
Jurik, T. W. 1986. Seasonal patterns of leaf photosynthetic capacity in successional northern hardwood tree species. American Journal of Botany 73: 131–138.
Kankare, V., Holopainen, M., Vastaranta, M. et al. 2013. Individual tree biomass estimation using terrestrial laser scanning. ISPRS Journal of Photogrammetry and Remote Sensing 75: 64–75. doi: 10.1016/j.isprsjprs2012.10.003.
Karnosky, D. F., Zak, D. R., Pregitzer, K. S. et al. 2003. Tropospheric O3 moderates responses of temperate hardwood forests to elevated CO2. A synthesis of molecular to ecosystem results from the Aspen Face project. Functional Ecology 17: 289–305.
Keeling, C. D., Chin, J. F. S. and Whorf, T. P. 1996. Increased activity of northern vegetation inferred from atmosphere CO2 measurements. Nature 382: 146.
Keenan, T. F., Hollinger, D. Y., Bohrer, G. et al. 2013. Increase in forest water-use efficiency as atmospheric carbon dioxide concentrations rise. Nature 499: 324–327. doi: 10.1038./nature12291.
King, J. S., Kubiske, M. E., Pregitzer, K. S. et al. 2005. Tropospheric ozone compromises net primary production in young stands of trembling aspen, paper birch and sugar maple in response to elevated atmospheric ozone. New Phytologist 168: 623–636. doi: 10.1111/j.1469-8137.2005.0157.x.
Kirschbaum, M. U. F., Whitehead, D., Dean, S. M. et al. 2011. Implications of albedo changes following afforestation on the benefits of forests as carbon sinks. Biogeosciences 8: 3687–3696. doi: 10.5194/bg-8-3687/2011.
Klein, T. and Hoch, G. 2015. Tree carbon allocation dynamics determined using a carbon mass balance approach. New Phytologist 205: 147–159. doi: 10.1111/nph.12993.
Klingberg, J., Engardt, M., Uddling, J., Karlsson, P. E. and Pleijel, H. 2011. Ozone risk for vegetation in the future climate of Europe based on stomatal ozone uptake calculations. Tellus 63A: 174–187. doi: 10.1111/j.1600-0870.2010.00465.x.
Konôpka, B., Pajtik, J., Moravcik, M. and Lukac, M. 2010. Biomass partitioning and growth efficiency in four naturally regenerated forest tree species. Basic and Applied Ecology 11: 234–243. doi: 10.1016/j.baae.2010.02.004.
Korner, C. 2003. Ecological impacts of atmospheric CO2 enrichment on terrestrial ecosystems. Philosphical Transactions of the Royal Society A 361 (1810): 2023–2041. https://doi.org/10.1098/rsts.2003.1241.
Kozlowski, T. T. 1992. Carbohydrate sources and sinks in woody plants. Botanical Review 58: 107–222.
Kramer, P. and Kozlowski, T. T. 1979. Physiology of Woody Plants. New York: Academic Press.
Krupa, S. V. and Manning, W. J. 1988. Atmospheric ozone: formation and effects on vegetation. Environmental Pollution 50: 101–137.
Kumala, M., Suni, T., Lehtinen, K. E. J. et al. 2004. A new feedback mechanism linking forests, aerosols, and climate. Atmospheric Chemistry and Physics 4: 557–562.
Kuusinen, N., Stenberg, P., Korhonen, L., Rautiainen, M. and Tomppo, E. 2015. Structural factors driving boreal forest albedo in Finland. Remote Sensing of the Environment 175: 43–51.
Lamba, S., Hall, M., Rantfors, M. et al. 2017. Physiological acclimation dampens initial effects of elevated temperature and atmospheric CO2 concentration in mature boreal Norway spruce. Plant, Cell and Environment. doi: 10.1111/pce.13097.
Larcher, W. 2003. Physiological Plant Ecology. Heidelberg: Springer.
Lemoine, R., La Camera, S., Atanassova, R. et al. 2013. Source to sink transport of sugar and regulation by environmental factors. Frontiers in Plant Science 4: article 272. doi: 10.3389/fpls.203.00272.
Lerdau, M., Litvak, M., Palmer, P. and Monson, R. 1997. Controls over monoterpene emissions from boreal forests. Tree Physiology 17: 563–569.
Lin, Y.-S., Medlyn, B. E. and Ellsworth, D. S. 2012. Temperature responses of leaf net photosynthesis: the role of component processes. Tree Physiology 32: 219–231. doi: 10.1093/treephys/tpr141.
Liu, Z., Wu, C. and Wang, S. 2017. Predicting forest evapotranspiration by coupling carbon and water cycling based on a critical stomatal conductance model. Journal of Selected Topics in Applied Earth Observations 10: 4469–4477.
Long, S. P. 2012. Virtual Special Issue on mechanisms of plant response to global atmospheric change. Plant, Cell and Environment 35: 1705–1706. doi: 1111/j.1365-3040.2012.0258.x.
Loreto, F., Ciccioli, P., Brancaleoni, E., Cecinato, A. and Fratoni, M. 1996. Different sources of reduced carbon contribute to form three classes of terpenoids emitted by Quercus ilex leaves. Proceedings of the National Academy of Sciences 93: 9966–9969.
Luyssaert, S., Schulze, E.-D., Borner, A. et al. 2008. Old-growth forests as global carbon sinks. Nature 455. doi: 10.10.1038/nature07276.
Manning, W. J. and Feder, W. A. 1980. Biomonitoring Air Pollutants with Plants. London: Applied Science Publishers.
Mao, J., Ribes, A., Yan, B. et al. 2016. Human-induced greening of the northern extratropical land surface. Nature Climate Change 6. doi: 10.1038/nclimate3056.
Markings, S. 2017. The effects of temperature on the rate of photosynthesis. https://sciencing.com/effect-temperature-rate-photosynthesis-19595.html (accessed 13/09/2017).
Matyssek, R. 1986. Carbon, water and nitrogen relations in evergreen and deciduous conifers. Tree Physiology 2: 177–187.
McDonald, E. P., Erickson, J. E. and Kruger, E. L. 2002. Research Note: Can decreased transpiration limit plant nitrogen acquisition in elevated CO2? Functional Plant Biology 29:1115–1120.
McLaughlin, S. B. and Downing, D. J. 1995. Interactive effects of ambient ozone and climate measured on growth of mature forest trees. Nature 374: 252–255.
McLaughlin, S. B., McConathy, R. K., Duvick, D. and Mann, L. K. 1982. Effects of chronic air pollution stress on photosynthesis, carbon allocation, and growth of white pine trees. Forest Science 28: 60–70.
Mercado, L. M., Belliouin, N., Sitch, S. et al. 2009. Impact of changes in diffuse radiation on the global land carbon sink. Nature 458: 1014–1017. doi: 1038/nature07949.
Miller, P. R., Arbaugh, M. J. and Temple, P. J. 1997. Ozone and its known and potential effects on forests in the Western United States. In: Forest Decline and Ozone, eds H. Sanderman, A. R. Wellburn and R. L. Heath. Ecological Studies Series 127. Springer, pp. 39–67.
Morrison, J. I. L. 1998. Stomatal response to increased CO2 concentration. Journal of Experimental Botany 49: 443–452.
Moura, B. B., Alves, E. S., Marabesi, M. A. et al. 2018. Ozone affects leaf physiology and causes injury to foliage of native tree species from the tropical Atlantic Forest of Southern Brazil. Science of the Total Environment 610–611: 912–925. doi: 10.1016/j.scitoenv.2017.8.130.
Muukkonen, P. and Heiskanen, J. 2005. Estimating biomass for boreal forests using ASTER satellite data combined with standwise forest inventory data. Remote Sensing of the Environment 99: 434–447. doi: 10.116/j.rse2005.9.
Mykleby, P. M., Snyder, P. K. and Twine, T. E. 2017. Quantifying the trade-off between carbon sequestration and albedo in midlatitude and high-altitude North American forests. Geophysical Research Letters 44: 2493–2501. doi: 10.1002/2016GL071459.
Nadelhoffer, K. J., Emmett, B. A., Gundersen, P. et al. 1999. Nitrogen deposition make a minor contribution to carbon sequestration in temperate forests. Nature 398: 145–198.
NASA. 2011. Measuring Earth’s albedo: Image of the Day 2011. https://earthobservatory.nasa.gov/IOTD/view.php?id=8449 (accessed 11/02/2018).
Naudts, K., Chen, Y., McGrath, M. J. et al. 2016. Europe’s forest management did not mitigate climate warming. Science 351: 597–600.
Niinemets, U., Flexas, J. and Penuelas, J. 2010. Evergreens favored by higher responsiveness to increased CO2. Trends in Ecology and Evolution 26: 136–142. doi: 10.1016/j.tree.2010.12.012.
Nowak, D. J. 1996. Estimating leaf area and leaf biomass of open-grown deciduous trees. Forest Science 42: 540–547.
Oren, R., Ellsworth, D. S., Johnsen, K. H. et al. 2001. Soil fertility limits carbon sequestration by forest ecosystems in a CO2-enriched atmosphere. Nature 411: 469–472. doi: 10.1038/35078064.
Pallardy, S. G. 2008. Photosynthesis. In: Physiology of Woody Plants. New York: Academic Press, pp.107–167.
Penuelas, J. and Staudt, M. 2009. BVOCs and global change. Trends in Plant Science 15: 133–134.
Perry, D. A., Oren, O. and Hart, S. C. 2008. Forest Ecosystems. Baltimore: Johns Hopkins University Press.
Popescue, S. C. 2007. Estimating biomass of individual pine trees using airborne lidar. Biomass and Bioenergy 31: 646–655. doi: 10.1016/j.biombioe.2007.06.022.
Rap, A., Scott, C. E., Reddington, L. et al. 2018. Enhanced global primary production by biogenic aerosol via diffuse radiation fertilization. Nature Geoscience 11: 640–644. www.nature.com/articles/s41561-018-0208-3.
Reay, D. S., Detenter, F., Smith, P., Grace, J. and Feeley, R. A. 2008. Global nitrogen deposition and carbon sinks. Nature Geoscience 1: 430–437. doi: 10.1038/ngeo230.
Reich, P. B. 1987. Quantifying plant response to ozone: a unifying theory. Tree Physiology 3: 63–91.
Reich, P. B., Sendell, K. M., Stefansky, A. et al. 2016. Boreal and temperate trees show strong acclimation of respiration to warming. Nature 531: 633–636. doi: 10.1038/nature17142.
Rennenberg, H. and Schmidt, S. 2010. Perennial lifestyle – an adaptation to nutrient limitation? Tree Physiology 30: 1047–1049. doi: 10.1093/treephys/tpq076.
Richards, B. L., Taylor, O. C. and Edmunds, G. F. Jr. 1968. Ozone needle mottle in Southern California. Journal of the Air Pollution Control Association 18: 73–77. doi: 10.1080/00022470.1968.10469097.
Roberts, J. M. 2009. The role of forests in the hydrological cycle. In: Forests and Forest Plants Vol. III. UNESCO-EOLSS.
Rogers, A. and Humphries, S. W. 2000. A mechanistic evaluation of photosynthetic acclimation at elevated CO2. Global Change Biology 6: 1005–1011. doi: 10.1046/j.1365-2486.2000.00375.x.
Royal Society of Chemistry: Advancing the Chemical Sciences. Rate of photosynthesis: limiting factors. www.rsc.org/search-results/?q= rate of photosynthesis limiting factors (accessed 11/06/2017).
Ryan, M. G. and Asao, S. 2014. Phloem transport in trees. Tree Physiology 34: 1–4 doi: 10.1093/treephys/tpt123.
Ryan, M. G., Gower, S. T., Hubbard, R. M. et al. 1995. Woody tissue maintenance respiration of four conifers in contrasting climates. Oecologia 101: 133–140.
Ryan, M. G., Lavigne, M. B. and Gower, S. T. 1997. Annual carbon cost of autrophic respiration in boreal forest ecosystems in relation to species and climate. Journal of Geophysical Research 102: No. D24 28.871–28.883.
Sala, A., Woodruff, D. R. and Meinzer, F. C. 2012. Carbon dynamics in trees: feast or famine? Tree Physiology 32: 764–775. doi: 10.1093/treephys/tpr143.
Sanderman, H., Wellburn, A. R. and Heath, R. L. (eds) 1997. Forest Decline and Ozone. Dordrecht: Springer Ecological Studies Series 127.
Sanderson, M. G., Collins, W. J., Hemming, D. L. and Betts, R. A. 2007. Stomatal conductance changes due to increasing carbon dioxide level: projected impact on surface ozone levels. Tellus 59B: 404–411. doi: 10.1111/j.1600-0889.2007.00277.x.
Sara, V., Luyssaert, S., Penuelas, J. et al. 2012. Fertile forests produce biomass more efficiently. Ecology Letters 15: 520–526. doi: 10.1111/j.1461-1=0248.2012.01775.
Sass-Klassen, U. 2015. Tracking tree carbon gain. Nature Plants 1: 1–2. doi: 10.1038/nplants.2015.175.
Saveyn, A., Steppe, K. and Lemeur, R. 2008. Report on non-temperature related variations in CO2 efflux rates from young tree stems in the dormant season. Trees 22: 165–174.
Saveyn, A., Steppe, K., Ubierna, N. and Dawson, T. 2010. Woody tissue photosynthesis and its contribution to trunk growth and bud development in young plants. Plant, Cell and Environment 33: 1949–1958. doi: 10.1111/j.1365-3040.2010.021997.x.
Schlesinger, W. H. and Jasechko, S. 2014. Transpiration in the global water cycle. Agricultural and Forest Meteorology 189–190: 115–117.
Schulte-Uebbing, L. and de Vries, W. 2017. Global-scale impacts of nitrogen depositon on tree carbon sequestration in tropical, temporal and boreal forests: a meta-analysis. Global Change Biology. doi: 10.1111/gcb.13862.
Scott, C. E., Monks, S. A., Spracklen, D. V. et al. 2018. Impact on short-lived climate forcers increases projected warming due to deforestation. Nature Communications 9: 1–7. doi: 10.1038/s41467-017-02412-4.
Sharkey, T. D. and Singass, E. L. 1995. Why plants emit isoprene. Nature 374: 769.
Sharkey, T. D. and Monson, R. K. 2014. The future of isoprene emissions from leaves, canopies and landscapes. Plant, Cell and Environment. doi: 10.1111/pce.12289.
Shen, M., Piao, S., Jeong, S.-J. et al. 2015. Evaporative cooling over the Tibetan Plateau induced by vegetation growth. Proceedings of the National Academy of Sciences 112: 9299-9304 July 28 www.pnas.org/cgi/doi/10.1073/pnas.15044418112.
Sillett, S. C., Van Pelt, R., Koch, G. W. et al. 2010. Increasing wood production through old age in tall trees. Forest Ecology and Management 259: 976–994. doi: 10.1016/jforeco.2009.12.003.
Simpson, J. R. and McPherson, E. G. 2011. The tree BVOC index. Environmental Pollution 159: 2088–2093. doi: 10.1016/j.envpol.2011.02.034..
Sitch, S., Cox, P. M., Collins, W. J. and Huntingford, C. 2007. Indirect radiative forcing of climate change through ozone effects on the land-carbon sink. Nature 448: 791–794. August doi: 10.1038/nature06059.
Slot, M. and Winter, K. 2017. Photosynthetic acclimation to warming in tropical tree seedlings. Journal of Experimental Botany 68: 2275–2284. doi: 10.1093/jxb/erx071.
Stephenson, N. L., Das, A. J., Condit, R. et al. 2014. Rate of tree carbon accumulation increases continuously with tree size. Nature 507: 90–93. doi: 10.1038/nature12914.
Sun, Z., Niinemets, U., Huve, K., Rasulov, B. and Noe, S. M. 2013. Elevated atmospheric CO2 concentration leads to increased whole-plant isoprene emission in hybrid aspen (Populus tremula x P. tremuloides. New Phytologist 198: 788–800. doi: 10.1111/nph.12200.
Sun, Y., Gu, L., Dickinson, R. E. et al. 2014. Impact of mesophyll diffusion on estimated global land CO2 fertilization. Proceedings of the National Academy of Sciences 111: 15774–15779. doi: 10.1073/pnas.1418075111.
Swann, A., Fung, I. Y., Levis, S., Bonan, G. B. and Doney, S. C. 2010. Changes in Arctic vegetation amplify high-latitude warming through the greenhouse effect. Proceedings of the National Academy of Sciences 107: 1295–1300 doi: 10.1073/pnas.0913846107.
Tang, J., Luyssaert, S., Richardson, A. D., Kutsch, W. and Janssens, I. A. 2014. Steeper declines in forest photosynthesis than respiration explain age-driven decreases in forest growth. Proceedings of the National Academy of Sciences 111: 8856–8860.
Taub, D. R. and Wang, X. 2008. Why are nitrogen concentrations in plant tissues lower under elevated CO2? A critical examination of the hypotheses. Journal of Integrative Biology 50: 1365–1374. doi: 10.1111/j.1744-7909.2008.00754.x.
Taylor, G., Tallis, M. J., Giardina, C. P. et al. 2007. Future atmospheric CO2 leads to delayed autumnal senescence. Global Change Biology 14: 1–12. doi: 10.1111/j.1365-2486.2007.0147.x.
Teskey, R. O., Saveyn, A., Steppe, K. and McGuire, M. A. 2008. Origin, fate and significance of CO2 in tree stems. New Phytologist 177: 17–32. doi: 10.1111/j.1469-8137.2007.02286.x.
Thomas, R. Q., Canham, C. D., Weathers, K. C. and Goodale, C. L. 2009. Increased tree carbon storage in response to nitrogen deposition in the US. Nature Geoscience 3: 13–17. doi: 10.1038/ngeo721.
Thomas, S. C. 2010. Photosynthetic capacity peaks at intermediate size in temperate deciduous trees. Tree Physiology 30: 555–573. doi: 1093/treephys/tpq005.
Topping, D., Connolly, P. and McFiggans, G. 2013. Cloud droplet number enhanced by co-condensation of organic vapors. Nature Geoscience 6: 443–446. doi: 10.1038/ngeo1809.
Tunved, P., Hansson, H.-C., Kerminen, V.-M. et al. 2006. High natural aerosol loading over boreal forests. Science 312: 262–263. doi: 10.1126/science.1123052.
Turnbull, M. H., Whitehead, D., Tissue, D. T. et al. 2001. Responses of leaf respiration to temperature and leaf characteristics in three deciduous tree species vary with site water availability. Tree Physiology 21: 571–578.
Uddling, J., Hogg, A. J., Teclaw, R. M., Carroll, M. A. and Ellsworth, D. S. 2010. Stomatal uptake of O3 in aspen and aspen-birch forests under free-air CO2 and O3 enrichment. Environmental Pollution 158: 2023–2031. doi: 10.1016/j.envpol.2009.12.001.
Unger, N. 2012. New directions: enduring ozone. Atmospheric Environment 55: 456-458. doi: 10.1016/j.atmosenv.2012.03.036.
Unger, N. 2014a. Human land-use-driven reduction of forest volatiles cools global climate. Nature Climate Change 4: 907–910. doi: 10.1038/nclimate2347.
Unger, N. 2014b. On the role of plant volatiles in anthropogenic global climate change. Geophysical Research Letters. 41: 8563–8569. doi: 10.1002/2014GL061616.
US Geological Survey. 2016. Evapotranspiration – the water cycle. shttps://water.usgs.gov/edu/watercycleevapotranspiration.html (accessed 15/02/2018).
Vandegehuchte, M. W., Bloemen, J., Vergeynst, L. and Stepe, K. 2015. Woody tissue photosynthesis in trees: salve on the wounds of drought. New Phytologist 208: 998–1002.
van der Sleen, P., Groenendijk, P., Vlam, M. et al. 2015. No growth stimulation of tropical trees by 150 years of CO2 fertilization but water use efficiency increased. Nature Geoscience 8: 24–28. doi: 10.1038/ngeo2313.
Wan, W., Manning, W. J., Wang, X. et al. 2014. Ozone and ozone injury on plants in and around Beijing, China. Environmental Pollution 191: 215–222. doi: 10.1016/j.envpol.2014.02.035.
Wang, B., Shugart, H. H., Shuman, J. K. and Lerdue, M. T. 2016. Forests and ozone: productivity, carbon storage, and feedbacks. Scientific Reports 6: 1–7. doi: 10.1038/srep22133.
Wang, M., Shi, S., Lin, F. et al. 2012. Effects of soil water and nitrogen on growth and photosynthetic response of Manchurian ash (Fraxinus mandschurica) seedlings in Northeast China. PLoS One 7: 1–13.
Wang, M., Schurgers, G., Arneth, A., Eckberg, A. and Hoist, M. 2017. Seasonal variation in biogenic volatile organic emissions from Norway spruce in a Swedish boreal forest. Boreal Environment Research 22: 353-367.
Warren, J. M., Jensen, A. M., Medlyn, B. E., Norby, R. J. and Tissue, D. T. 2014. Carbon dioxide stimulation of photosynthesis in Liquidambar styraciflua is not sustained during a 12-year field experiment. AoB Plants 7: plu074 doi: 10.1093.aobpla/plu074.
Wenzel, S., Cox, P. M., Eyring, V. and Friedlingstein, P. 2016. Projected land photosynthesis constrained by changes in the seasonal cycle of atmospheric CO2. Nature 538. doi: 10.1038/nature19772.
Wieder, W. R., Cleveland, C. C., Kolby-Smith, W. and Todd-Brown, K. 2015. Future productivity and carbon storage limited by terrestrial nutrient availability. Nature Geoscience 8: 441–444. doi: 10.1038/ngeo2413.
Wilson, B. F. 1984. The Growing Tree. Amherst: University of Massachusetts Press.
Wilson, K. B., Baldocchi, D. D. and Hanson, P. 2001. Leaf age affects seasonal pattern of photosynthetic capacity and net ecosystem exchange of carbon in a deciduous forest. Plant, Cell and Environment 24: 571–583. doi: 10.1046/j.0016-8025.2001.00706.x.
Wittig, V. E., Ainsworth, E. A., Naidu, S. A., Karnosky, D. F. and Long, S. P. 2009. Quantifying the impact of current and future tropospheric ozone on tree biomass, growth, physiology and biochemistry. Global Change Biology 15: 396–424. doi: 10.1111/j.1365-2486.01774.x.
Wu, J., Albert, L. P., Lopes, A. P. et al. 2016. Leaf development and demography explain photosynthesis seasonality in Amazon evergreen forests. Science 351: 972–976.
Yoder, B. J., Ryan, M. G., Waring, R. H., Schoettle, A. W. and Kaufmann, M. R. 1994. Evidence of reduced photosynthesis rates in old trees. Forest Science 40: 513–537.
Zeng, Z., Pioa. S., Laurent, Z. X. et al. 2017. Climate mitigation from vegetation biophysical feedbacks during the past three decades. Nature Climate Change 7: 432–436. doi: 10. 1038/nclimate3299.
Zhao, D. F., Bucholz, A., Tillmann, R. et al. 2017. Environmental conditions regulate the impact of plants on cloud formation. Nature Communications 8: 14067 doi: 10.1038/ncomms14067.
Zhao, K. and Popescue, S. 2009. Lidar-based mapping of leaf area index and its use for validating GLOBOCARBON satellite LAI product in a temperate forest of the Southern USA. Remote Sensing of the Environment 113: 1628–1645. doi: 10.1016/j.rse.2009.03.006.
Zhou, Y.-M., Wang, C.-G., Han, S.-J. et al. 2011. Species-specific and needle age-related responses of photosynthesis in two Pinus species to long-term exposure to elevated CO2 concentration. Trees 25: 163–173. doi: 10.1007/s00468-010-0495-9.