
7
The only way to figure out what is happening to our planet is to measure it.
Keeling, 2008
While short-term leaf-level responses to CO2 (such as A/Ci curves) are well understood, we have less data on longer-term CO2 acclimation responses or responses at any time scale at larger spatial scales (such as stand level responses to CO2 from Free Air CO2 Enrichment (FACE) studies), and none that have run for decades or explored large-scale responses of forest stands to warming.
Way et al., 2015
7.1Introduction
Previous chapters considered the nature and cause of global warming; the key role of carbon dioxide; the importance of the biogeochemical factors photosynthesis and BVOCs, and the biogeophysical factors albedo, evapotranspiration, and ozone; and how their interactions affect forests, atmospheric temperatures, and climate. Warming temperatures, forest fires, insect infestations, drought, deforestation and land-use change, latitudinal forest locations, and species composition all affect these interactions.
Recognition that carbon dioxide and ozone were increasing, and that atmospheric warming was occurring, resulted in extensive research on how this would affect trees and forests, now and in the future, and what effect this would have on atmospheric warming and cooling. Results from hundreds of experiments, extensive model simulations, and meta-analyses can be found in a wide variety of journals and books. This chapter will use some examples to focus on how the current knowledge base was determined. Emphasis will be on methods used, and how this affects the relevance of the results. The devil is indeed in the details, and this is often overlooked when conclusions are drawn.
7.2Research and Perceptions of Reality
Research is the continuing search to identify and verify changing perceptions of reality. Verified perceptions constitute truth and in some cases facts. Truth is consistent with available relevant evidence and not contradicted by any important evidence (Ellis Cowling, North Carolina State University 1988, pers. comm.). Researchers often use declarative conclusive sentences that indicate the truth of their results from experiments or models as titles for their papers. In their abstracts and conclusions, however, their perceptions are often qualified by words such as estimate, likely, indicate, imply, suggest, or probably. This confirms the need for continuing research for perceptions of reality, but does detract from the surety of the titles and the conclusions.
Experimentation and modeling are used in a variety of ways to identify current conditions, and to predict how trees and forests will respond to, and be affected by, future carbon dioxide and ozone concentrations and warming temperatures, as influenced by other environmental and biological factors. Evaluation of the results involves connecting experimental variables and assumptions with results and conclusions, based on interactions and relationships. The extent and strength of the relationships indicates the degree of the new perceptions of reality or truth. Examples of some simple types of relationship are given below:
Association: A consistent relationship or association, ranging from weak to strong, is evident between variables. The significance of the relationship is not verified.
Correlation: A statistical procedure to determine the strength of linear regression relationships between two variables. An R2 value (0–100%) determines the strength of the relationship. Statistically significant differences are calculated. Strong perceptions of new reality are possible.
Causation: A cause/effect relationship is established. Changes in what is considered to be the causal variable directly cause a corresponding effect in the other variable. Absent any confounding effects, this is proof of causation. Causation is the true perception of new reality or truth. Correlation is often incorrectly considered to be causation.
7.3Trees as Experimental Plants
Compared with annual plant species, trees are not ideal experimental plants. Slow growth, long life span, and large size preclude experimentation from seedling to maturity. Considerable variation also occurs within and between species.
Most trees result from germinated seeds. Seedling growth rates vary with species, and they may require 1–2 years or more of growth from seed germination to be useful. Older seedlings, young trees, and saplings are also used in experiments. Some trees are vegetatively propagated or cloned by rooting stem cuttings. These are fast-growing deciduous species and can be used for more rapid and more uniform growth responses. Species and hybrids of poplars (Populus) are usually propagated this way. For this reason, they are frequently used in experiments, especially in cooperative international research projects such as PopFACE and in the long-term AspenFACE experiment. Results from poplars are sometimes extended to relate to all tree species. “Tree” can be a generic term, especially in models.
Response to carbon dioxide, ozone, temperature, drought, and other factors varies considerably with tree age. Large trees function differently than seedlings or saplings. As seedlings progress to saplings and to mature trees, the amount of photosynthetically active tissue declines, and the amount of carbon stored in wood increases as cambial tissue increases. There are changes in uptake, transport, and distribution patterns of water and nutrients from soil. Developing canopies develop microclimates and differing light levels. This makes it difficult if not impossible for the responses of seedlings and younger trees used in experiments to be extrapolated directly (or scaled) to mature trees and forests (Pye, 1988). Samuelson and Kelly (2001) compared 63 examples of stomatal conductance of water vapor between younger and older trees and found considerable differences. They concluded that stomatal conductance rates for seedlings might underestimate ozone uptake by mature trees. Grulke and Miller (1994) found that seedlings of giant sequoia (Sequoiadendron giganteum) were ozone-sensitive until about 5 years old. After that, high water-use efficiency and compact leaf mesophyll tissues protected against ozone injury. Results from short-term experiments with tree seedlings or saplings and with elevated carbon dioxide and ozone do not predict well how mature trees will respond. Trees in nature adjust to changing temperatures and other environmental factors, site conditions and water availability, and changes that occur with age (Camarero et al., 2015).
7.4Detecting Tree Growth
7.4.1Tree Measurements
The influences of elevated carbon dioxide, ozone, temperature, drought, insect infestations, disease, and fires are reflected in tree growth and biomass development during the tree’s life span. Tree biomass plays a key role in the global carbon and hydrological cycles. Assessing rates of tree growth and biomass development over time is essential to identify trends of environmental influence and to predict future growth and biomass in response to predicted environmental changes. Bowman et al. (2013) have provided an extensive and detailed review of detection of trends in tree growth.
Permanent sample plots provide long-term analysis of trends. Tree height and stem dbh (at 130 cm height) are common measures of tree growth (Bowman et al., 2013). They are correlated with biomass and wood volume. The dbh can be measured for marked trees at regular intervals, and tree growth rates can be determined from the first sampling date. Long-term historical records of tree growth are available for retrospective analyses.
Nabuurs et al. (2013) used historical data on stem volume increments in Europe from 2005 to 2010 to detect slow-down in forest growth and indications of saturation of the forest carbon sink. Tang et al. (2016) used field surveys, tree growth measurements, and statistical records to estimate carbon sequestration capacity by trees in Beijing. They concluded that the “urban forest” of trees in Beijing sequestered one-third to one-half of the carbon sequestered by non-urban Chinese forests, and estimated that Beijing’s trees sequestered 0.2% of the carbon dioxide emitted from energy production. Luyssaert and Cornelissen (2018) reviewed forest inventory data from the 1980s to 2000s to identify and characterize drought-tolerant trees, using tree diameters as an indication of biomass above the surface. More than 3 million trees were recorded by species and tree diameter. Drought-tolerant trees were identified on the basis of less reduction in growth caused by drought.
Dendrochronology, or tree ring analysis, can be used with trees that form clear annual growth rings in stem wood. It is a useful tool for retrospective investigations to evaluate past and current tree stem growth (Zhang, 2015). Annual growth-ring widths in cores from tree stems can be measured, and the rings counted and dated. Corrections are made for inherent tree age, size, and growth trends (Peters et al., 2015). The ratio of 13C to 12C allows analyses of wood and wood metabolites from the present to millennia ago (Wieloch et al., 2018). Dendrochronology methods are used to provide long-term data in temperate and boreal forests, with increasing use in tropical forests (Peters et al., 2015). Bowman et al. (2013) state that tree diameter increment is widely used as a proxy for whole-tree growth.
Gazol et al. (2015) used tree ring data to assess and quantify growth trends, expressed as changes in basal area increment, for silver fir (Abies alba). Data were obtained from 1,300 trees at 111 sites in Spain, Italy, and Romania. Growth was limited in southern Europe by soil aridity. Increased warming in temperate northern Europe increased tree growth.
On-the-ground decadal forest monitoring studies in tropical forests have indicated decreasing rates of tree growth and biomass for some species, and increasing rates for others, in response to increasing carbon dioxide and temperature (Groenendijk et al., 2015). They used tree ring analysis to examine growth trends for 13 specific tree species (approximately 1,300 trees) at a centennial scale in tropical forests in Bolivia, Cameroon, and Thailand. The aggregated trends indicated decreasing growth rates with time for eight to ten species, increasing growth rate for two species, and no trend for one species. These were not the growth patterns expected if elevated carbon dioxide had increased tree growth. The results suggested that not all tree species in tropical forests respond positively to elevated carbon dioxide. Van der Sleen et al. (2014) used tree ring analyses in the same areas as Groenendijk et al. (2015) to discern whether tree growth stimulation in undisturbed tropical areas was occurring. They measured stable carbon isotopes in wood growth rings in both understory and canopy trees, and concluded that water-use efficiency had increased by 30–35%. Analysis of the width of tree growth rings did not provide evidence of growth stimulation by carbon dioxide.
Cole et al. (2010), then followed by Peters et al. (2015), used several methods to determine how increasing carbon dioxide (over the past five decades) affected the growth of natural stands of clonal quaking aspen (Populus tremuloides) in Wisconsin. Tree rings were measured, and multivariate statistical analyses used to interpret results. Historical shifts in carbon dioxide and climate, and the age and genotype of clones were included. Growth of aspen increased on average 53% over the last 50 years. A 19.2% increase of carbon dioxide during that period was determined to be the likely cause. Soil moisture availability enhanced aspen growth.
7.4.2Soil Warming Experiments
Increasing air temperatures will also increase soil temperatures. How this might affect tree growth and biomass under natural open-field ambient conditions has become an area of increasing interest. In experiments, a network of heating cables can be established in soil plots, and soil temperature can be increased. Plots without heating cables are used as ambient controls. Chung et al. (2013) reviewed open-field warming studies with temperate and boreal forest tree seedlings. Their general conclusions for heated soil results were that leaves emerged earlier and senesced later for a longer growing season. Incidence of and effects of herbaceous insects could occur. Litter decomposed more rapidly, resulting in increased nitrogen mineralization.
Butler et al. (2012) reported the results of 7 years of soil warming on growth responses of young forest trees at the Harvard Forest. Relative growth rate and leaf nitrogen increased considerably for red maple (Acer rubrum), and increased to a lesser extent for red oak (Quercus rubra) and white ash (Fraxinus americana). Differences in tree species responses were attributed to availability of increased soil nitrogen due to long-term warming.
Reich et al. (2015) designed a 3-year experiment to assess the influence of soil warming (approximately 3.4 °C) on the growth of 11 co-occurring boreal and temperate forest tree seedlings near their warm range limit. Net photosynthesis and growth were reduced for balsam fir (Abies balsamea) and white spruce (Picea glauca), intermediate for Scots pine (Pinus sylvestris), birch (Betula papyrifera), and poplar (Populus tremuloides), and enhanced for temperate species of maple (Acer) and oak (Quercus). In a similar soil warming experiment, Reich et al. (2016) determined rates of leaf respiration and acclimation in ten North American tree species to soil warming and local temperature variations. This suggests that soil warming will not increase leaf respiration at the expense of photosynthesis.
7.5Controlled Experiments
7.5.1Interior Chamber and Greenhouse Experiments
Early experiments with elevated carbon dioxide effects on trees were conducted in a variety of small interior growth chambers and greenhouse compartments (Overdieck, 2016). These chambers provided control over environmental factors that affect seedling growth and allowed detection of the effects of carbon dioxide with few confounding factors. Size limitations restricted the replication of treatments and the duration of experiments. An example of a small-chamber exposure system for exposing plants to ozone or carbon dioxide is shown in Figure 7.1. Predictive experiments compared tree growth and physiology at ambient carbon dioxide to the effects of doubled ambient carbon dioxide concentrations. Because of space constraints, seedlings or smaller trees grown in small chambers were often grown in small-volume pots. After initial growth stimulation due to higher carbon dioxide, growth and photosynthesis was often reduced. Arp (1991) attributed this to the restriction of volume for root growth.

Figure 7.1
Greenhouse exposure chambers.
Controlled exposure.
Tjoelker et al. (1998) used growth chambers to investigate acclimation of net photosynthesis in boreal seedling tree species to elevated carbon dioxide (580 ppm) and temperature. Tree species, rather than temperature, appeared to be a better determinant of carbon dioxide effects on photosynthesis: increases in net photosynthesis were expressed more by the slower-growing conifers black spruce (Picea mariana), jackpine (Pinus banksiana), and larch (Larix laricina) than by the faster-growing deciduous aspen (Populus tremuloides) and birch (Betula papyrifera). Elevated carbon dioxide effects on net photosynthesis were better expressed on a leaf area basis rather than on a leaf mass basis. Because of the low number of growth chambers available, replication in time was necessary – that is, experiments had to be repeated to cover the number of different treatments required. Bazzaz et al. (1993) used greenhouse compartments to investigate simultaneously the effects of elevated carbon dioxide on six co-occurring temperate tree species: ash (Fraxinus americana), gray birch (Betula populifolia), red maple (Acer rubrum), yellow birch (B. alleghaniensis), striped maple (A. pennsylvanica), and red oak (Quercus rubra). Growth stimulation from elevated carbon dioxide for all species was greater in year one than in year three, but the growth stimulation declined at different rates for different species as affected by nutrient and light availability.
Similar small chambers were also used to investigate ozone effects on tree seedlings. Detailed chamber descriptions and evaluations are found in Manning (2005). Unlike carbon dioxide, ambient concentrations of ozone vary considerably in nature and are high enough to cause leaf injury and growth effects only on a periodic basis. Many of the early experiments involved steady-state (square wave) daily exposures of ozone concentrations for 8 hours a day. Reich and Lassoie (1985) used growth chambers to investigate the effects of 10-week exposure to a range of ozone concentrations (25, 50, 85, and 120 ppb) on growth and biomass of a hybrid poplar (Populus deltoides × trichocarpa). After 10 weeks, 85 and 120 ppb ozone reduced height, growth rates, and leaf senescence. Leaf, stem, root, and total dry weight per plant were reduced by 10–15% compared with plants exposed to 25 or 50 ppb ozone. Davis and Skelly (1992) used chamber fumigations with ozone (75 or 150 ppb) to identify foliar ozone injury symptoms on eight deciduous tree species. Based on extent of symptom expression (stipple and defoliation), black cherry (Prunus serotina) was the most sensitive, followed by sweetgum (Liquidambar styraciflua), yellow poplar (Liriodendron tulipifera), white ash (Fraxinus americana), red maple (Acer rubrum), and yellow birch (Betula alleghanensis). Red oak (Quercus rubra) and white oak (Q. alba) did not have visible injury symptoms. Keane and Manning (1988) grew birch (B. papyrifera) seedlings in soil with or without added inoculum of the ectomycorrhizal fungus Pisolithus tinctorius. Seedlings were grown in greenhouse chambers for 12 weeks and exposed to either 60–80 ppb ozone or charcoal-filtered air. Ozone reduced birch seedling growth and the extent of mycorrhizal colonization. Mycorrhizal colonization did not reduce incidence of the effects of ozone on birch seedling growth. Pye (1988) has extensively reviewed early chamber experiments with ozone effects on young trees.
Much of the early experimental work with trees in interior chambers focused on single-factor (reductionist) predictive experiments comparing ambient carbon dioxide concentration with immediate 50–100% increases in carbon dioxide levels. Gradual adaptation to slower increases in carbon dioxide was not considered.
While advancing fundamental knowledge, results from small chambers are only relevant to the chamber conditions and exposure regimes for both carbon dioxide and ozone. From a toxicology perspective, however, small-chamber experiments, where treatments are replicated and where environmental conditions are controlled, are ideal for establishing cause/effect relationships. The short-term influence of carbon dioxide and ozone alone can be determined for tree growth, physiological functions such as photosynthesis, stomatal conductance, and respiration. Ozone injury can be documented and verified. Results from interior chambers provide short-term indications of what extreme future effects of carbon dioxide and ozone might be, from 2050 to 2100.
7.5.2Field Chambers and Exposure Systems
Results from exposure experiments with small chambers encouraged researchers to develop techniques for use with larger trees in the field. Much interest in working with ozone, carbon dioxide, and temperature under more realistic ambient conditions prompted the development of a number of open and field chambers (Manning and Krupa, 1992; Manning, 2005; Overdieck, 2016). The size and long-term nature of these chambers made it possible to plant trees directly in the ground under more natural growing conditions. The movement to field chambers eliminated the completely controlled environmental conditions of the small interior chambers and introduced more variables in assessment of treatment effects on tree growth. Long-term, fully replicated, multi-year experiments under semi-controlled conditions were possible.
7.5.2.1Open-top Chambers
Open-top chambers (OTCs) were developed for long-term experiments. Complete environmental control in the small interior chambers was lost and replaced by semi-controlled conditions and completely replicated treatments. Heagle et al. (1973) developed an OTC that remains widely used. Charcoal-filtered air, with or without addition of carbon dioxide or ozone, is introduced into a large, plastic-sided OTC (3.5 m diameter, 2.22 m high) by fan movement over trees with upward air flow out of the top of the chamber. An example of an OTC in the field is shown in Figure 7.2. OTCs reduce some available light and increase air temperature and relative humidity, while wind velocity is steady and reduced. Norby et al. (1997) modified the design and function of OTCs to include increased air temperatures. Despite concerns about environmental differences within OTCs, increases in chamber size and the ability to grow trees in the ground for long periods made OTCs very attractive for research.
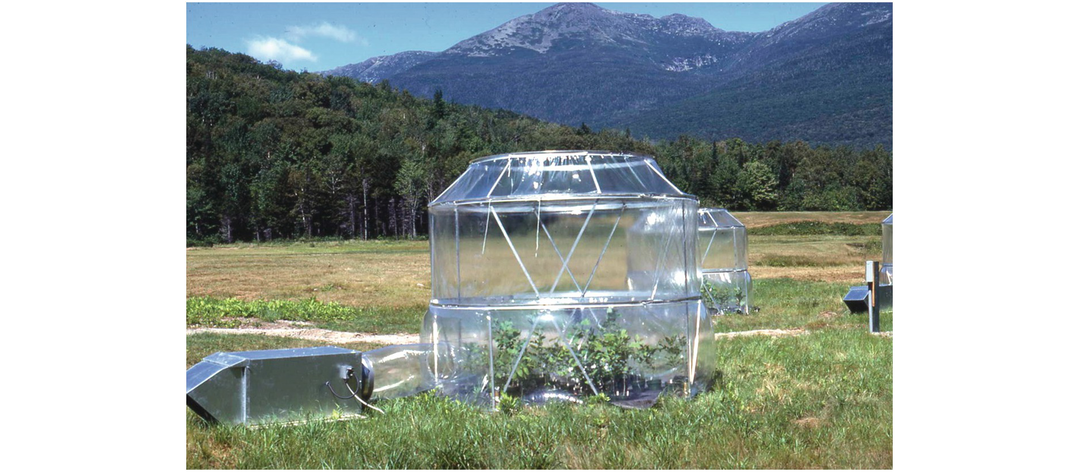
Figure 7.2
OTC in the field.
Semi-controlled exposure to ambient environment.
Rey and Jarvis (1998) grew silver birch seedlings in OTCs, exposed to either 350 or 700 ppm carbon dioxide, for four growing seasons. Elevated carbon dioxide increased photosynthesis by an average of 33% by the end of the four seasons. However, photosynthetic capacity – that is, the rate of photosynthesis per unit leaf area – was reduced by elevated carbon dioxide. Decreased carboxylation efficiency and regeneration of RuBP were concluded to be the basis for acclimation to elevated carbon dioxide. Hattenschwiler and Korner (2000) determined the influence of three different quantum flux densities (QFD) (ranging from 0.36 to 2.16 to 4.8% of full sun) on growth and biomass of six European forest tree species to 360, 500, and 660 ppm carbon dioxide, utilizing 12 OTCs at each QFD location. Tree species responded differently to carbon dioxide concentrations and site QFDs. Elevated carbon dioxide increased growth of shade-tolerant beech (Fagus sylvatica) and yew (Taxus baccata) at low-QFD locations, but not at high QFD. Sycamore maple (Acer pseudoplatanus), red oak (Quercus rubra), and white fir (Abies alba), which are less shade-tolerant, did not respond at low QFD, but did increase biomass at high QFD. Scots pine (Pinus sylvestris) is shade-intolerant and grew poorly. Greatest growth stimulation occurred at 500 ppm carbon dioxide. They concluded that elevated carbon dioxide may alter understory species performance and change the composition of future forests.
Bortier et al. (2000) compared the effects of ozone on poplar (Populus nigra) grown from cuttings and beech (Fagus sylvatica) grown from seed in OTCs. Ozone significantly reduced the growth and biomass of fast-growing poplar, but its effects on slow-growing beech seedlings were not significant. These results confirmed earlier observations that fast-growing tree species were more likely to be adversely affected by ozone. Calatayud et al. (2007) used OTCs in Spain to assess the effects of ozone on four species of maple (Acer). He exposed them to charcoal-filtered air (12-hr mean 11.6 ppb), ambient air (12-hr mean 46.3 ppb), and non-filtered air + 30 ppb (12-hr mean 65.1 ppb). Exposure to non-filtered air + 30 ppb caused some growth reduction for all four Acer species, with differing responses in foliar injury, gas exchange, and chlorophyll fluorescence. Norby et al. (1997) compared the response of yellow poplar (Liriodendron tulipifera) and white oak (Quercus alba) seedlings to elevated carbon dioxide in OTCs. There was no significant increase in dry mass at final harvest for yellow poplar, but a significant increase for white oak despite differences in photosynthesis and respiration. Results from differences in seedling biomass in response to elevated carbon dioxide might not be good predictors of long-term responses under forest conditions.
7.5.2.2Whole-tree Chambers
OTCs are too small to accommodate large trees. Larger whole-tree chambers (WTCs) were developed to enclose single mature trees in situ. The same environmental modifications that affect results from OTCs also prevail with WTCs. Increased expense for construction, and the large amount of carbon dioxide required for daily release, have limited their use.
Hall et al. (2009) used WTCs to study elevated carbon dioxide and temperature effects on 45-year-old Norway spruce (Picea abies) in the boreal region of northern Sweden for two complete years. The focus was continuous assessment of net assimilation rate (NAR) in individual buds and shoots, beginning at early bud development and continuing until late August. Monthly temperature increases ranged from 2.8 °C in July and August to 5.6 °C in December. In response to temperature increase, shoot development began 1–3 weeks earlier and was completed earlier, with positive effects on NAR. Elevated carbon dioxide (700 ppm) increased NAR by 30% later in the season. Interaction did not occur between elevated temperature and carbon dioxide. Prediction for effects of future climate in 2100 are that current-year shoots will assimilate carbon 20–30 days earlier than now.
From similar experiments with Norway spruce, Sigurdsson et al. (2013) concluded that low nutrient availability, a key factor limiting tree growth in boreal forests, would limit spruce response to elevated carbon dioxide and temperature. Lamba et al. (2017) continued investigations on elevated temperature and carbon dioxide effects on mature boreal Norway spruce. They found that long-term physiological acclimation reduced the initial increased net carbon assimilation due to both carbon dioxide exposure and the effects of warming on water use. Current models may overestimate the effects of warming and elevated carbon dioxide on boreal Norway spruce.
7.5.2.3Free-Air Carbon Dioxide Enrichment (FACE)
OTCs and WTCs do not provide enough open space or volume for long-term experiments with trees. They have innate effects on chamber environment that need to be considered. Free-air chamberless gas-dispensing exposure systems were developed to provide more space and to reduce experimental effects. Originally designed to dispense carbon dioxide (FACE stands for Free-Air Carbon dioxide Enrichment system), they can also be used to dispense ozone, or ozone and carbon dioxide together. Circular plots (25–30 m in diameter) were established. PVC pipe circles the plot or ring diameter. Upright PVC pipes, with inward facing holes, are placed at regular intervals in the ring. Blowers are used to dispense carbon dioxide through the holes and across the rings. A steady carbon dioxide concentration is maintained by monitoring carbon dioxide in the ring and adjusting it for wind speed and direction. The temperature in the rings is the same as ambient, and precipitation is included. The FACE system allows long-term, multiple-year experiments with fewer confounding effects. However, costs to establish and use with carbon dioxide can be very high.
The purpose of long-term experiments with elevated carbon dioxide and trees is to predict future rates of photosynthesis, carbon allocation, and carbon storage in wood in 2050 and 2100, and to determine what role this may play in partially mitigating global warming and climate change. FACE systems are suitable for this purpose. The carbon dioxide concentrations used range from immediate 50% to 100% increases from current ambient, with 400 ppm used as a control. Much has been learned about tree responses to long-term carbon dioxide exposure from 550 to 800 ppm. The results are used in predictive global carbon cycle models.
Drake et al. (2016) used their six-ring Eucalyptus Free-Air CO2 Enrichment (EucFACE) site in Southeast Australia. The site contains mature native trees, primarily Eucalyptus teretricornis. Photosynthesis and soil carbon flux were determined at each step. Warren et al. (2014) summarized a small 12-year (1998–2009) FACE experiment on photosynthesis in sweetgum (Liquidambar styraciflua), using four FACE rings. Treatments consisted of two ambient and two 560 ppm carbon dioxide treatments, allowing for two replications. An additional adjacent non-FACE ring served as an ambient control. Elevated carbon dioxide initially increased photosynthesis, but it was not sustained when leaf concentrations of nitrogen decreased to sub-optimal. Their important conclusion was that elevated carbon dioxide may initially increase photosynthesis, but it may decline with time if nitrogen also declines. Additional treatment replications would have increased the strength of the conclusion.
The largest and most productive FACE experiment, initially led by the late David Karnosky, was AspenFACE, established in Rhinelander, Wisconsin, and ran from 1997 to 2009. Twelve 30-m rings, in three replicates of four each, were established to include four treatments (elevated carbon dioxide 550 ppm, elevated ozone 60–80 ppb, elevated carbon dioxide + elevated ozone, and ambient control 350–380 ppm carbon dioxide and 30–50 ppb ozone). The field plot plan for this experiment is shown in Figure 7.3. Six aspen (Populus tremuloides) clones were planted in one half of each ring. The other half was divided into quarters. One quarter was planted with aspen/paper birch (Betula papyrifera) and the other with aspen/sugar maple (Acer saccharum). Elevated carbon dioxide increased photosynthesis and NPP for aspen and birch, but not for sugar maple (Karnosky et al., 2007). Elevated carbon dioxide increased competitive space utilization in aspen/birch at the expense of aspen (Kubiske et al., 2007). Elevated ozone reduced biomass for aspen and to a lesser degree for birch. Carbon dioxide did not provide complete protection from biomass reduction by ozone in the carbon dioxide plus ozone treatment (King et al., 2005). By the end of the experiment, elevated carbon dioxide alone continued to stimulate photosynthesis and NPP, except for sugar maple. Negative effects of elevated ozone decreased by the end of the experiment (Burton, 2014; Talhelm et al., 2014).

Figure 7.3
AspenFACE experiment.
Exposure under ambient environmental conditions.
Photo courtesy of John Couture, UW-Madison
A complete summary of ecosystem carbon content, from mineral soil to tree foliage, after 11 years of treatment in AspenFACE with carbon dioxide, ozone, or carbon dioxide plus ozone, is illustrated in Figure 7.4. Overall, carbon dioxide had a 11% positive effect, while ozone had a 9% negative effect. Carbon dioxide stimulated tree growth and narrowly reduced the negative effects of ozone, with biomass close to ambient effects.
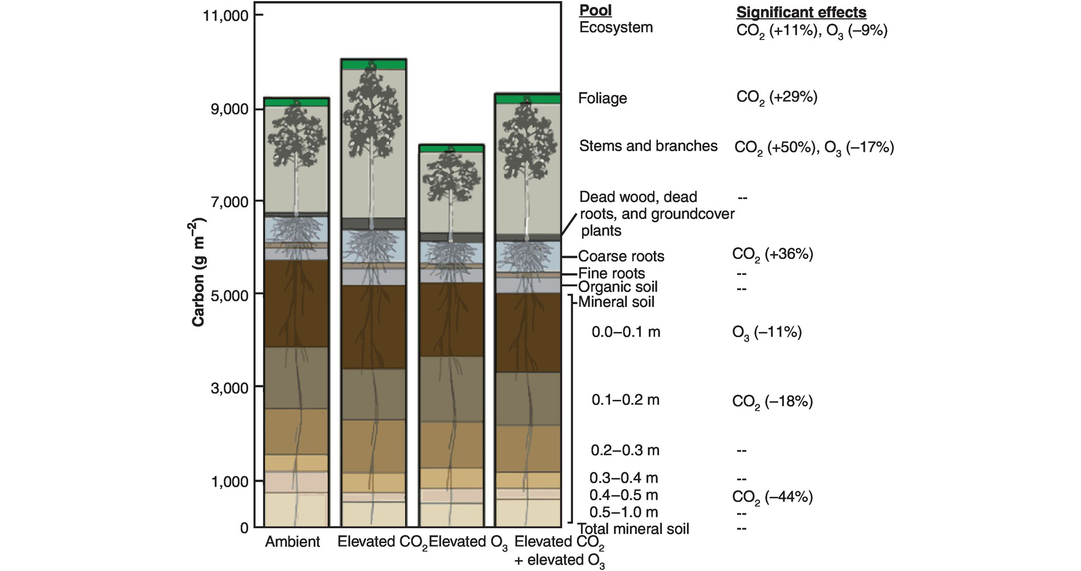
Figure 7.4
Ecosystem carbon content after 11 years of fumigation at the AspenFACE experiment.
Data are averaged across the three forest community types and include soil to 1 m in depth. The height of each bar segment represents the mean size of each pool, and the total bar height represents ecosystem C content for each treatment. For simplicity, soil C below 0.5 m in depth is grouped into a single pool because there were no significant treatment effects. Significant (P≤ 0.05) effects of the treatment gases and the size of these effects (%) are shown to the right of the figure. Pools without significant treatment effects are denoted with ‘--’. With the exception of two small pools (foliage, groundcover plants), there were no significant treatment × community interactions.
From A. F. Talhelm et al. Global Change Biology, Elevated carbon dioxide and ozone alter productivity and ecosystem carbon content in northern temperate forests © (2014). Adapted by permission of John Wiley & Sons, Inc.
More than 120 researchers from nine countries collaborated in AspenFACE. These collaborations resulted in 207 publications, with 169 in scientific journals (Burton, 2014). Results and conclusions from AspenFACE provide much of what is known about the long-term effects of elevated carbon dioxide and ozone on growth and biomass production by seedlings and saplings of deciduous temperate-zone trees. Examples of recent elevated carbon dioxide FACE sites and trees include the Duke Forest site (North Carolina, USA), with Pinus taeda and Liquidambar styraciflua, and PopFACE international (originating in Italy), with Populus hybrids. Newer FACE sites have been developed in Australia, Switzerland, and Japan (Overdieck, 2016). FACE experiments with carbon dioxide are appropriate for temperate forest trees (Hickler et al., 2008), but are not applicable to boreal or tropical forests.
Atmospheric carbon dioxide, however, increases slowly, and trees are also likely to respond and adapt slowly over time. This has been investigated, to some extent, with crop plants and grasses in growth chambers and outdoor dilution tunnels, using increasing concentrations of carbon dioxide. It would be prohibitively expensive to try to use the FACE method to determine the effects of realistic slow increases in carbon dioxide, ranging from pre-industrial levels to elevated carbon dioxide levels of more than 400 ppm (Gerhart and Ward, 2010).
Drake et al. (2016) developed an unique sequential step exposure system to gradually increase carbon dioxide at short defined intervals over time to allow study of short-term carbon cycling at each step, and overall at the conclusion of the experiment. Large eucalyptus trees, growing in nutrient-poor soil in Southeast Australia, were used in a FACE exposure experiment. Canopy leaf photosynthesis was the focus of the experiment. Treatments were 400 ppm control, with a menu of five step increases, beginning with step 1 at 30 ppm (total 430 ppm) and continuing with 60 ppm (460 ppm), 90 ppm (490 ppm), 120 ppm (520 ppm), and 150 ppm (550 ppm). Each step-addition exposure lasted 5 weeks. Photosynthesis in canopy leaves acclimated at step 2, 60 ppm (460 ppm), and remained the same through step 5, 150 ppm (550 ppm) (Figure 7.5). Soil carbon flux increased at both step 1 and step 2, but not at steps 3, 4, and 5. They interpreted the rapid increase in soil carbon flux to be due to rapid translocation of carbon from photosynthesis below-ground and release in respiration. They determined that soil carbon flux and photosynthesis interacted on a very short timescale, and that additional research is needed to investigate the significance of this in relation to effects of elevated carbon dioxide and the carbon cycle.

Figure 7.5
Measured and modeled rates of light‐saturated photosynthesis (Asat) in upper canopy leaves during the mid‐morning during the stepwise increase in [CO2] at EucFACE.
Asat was measured on four campaigns (large circles) and modeled for each day (lines). Error bars reflect ±1 SE (n = 3).
From J. E. Drake et al. Global Change Biology, Short‐term carbon cycling responses of a mature eucalypt woodland to gradual stepwise enrichment of atmospheric CO2 concentration. Copyright © (2016) by John Wiley & Sons, Inc. Reprinted by permission of John Wiley & Sons, Inc.
7.5.2.4Branch-in-Bag Method
OTCs, WTCs, and FACE systems allow long-term research on growth and biomass of tree seedlings and saplings. The branch-in-bag (BiB) method was developed to ascertain how leaves and branches of older, more mature trees would respond, primarily to elevated carbon dioxide, under semi-field conditions. Ventilated transparent bags are placed over selected branches for either the short term or a whole growing season duration. Half are ventilated with ambient air carbon dioxide (control), and half are ventilated with ambient air plus carbon dioxide to desired concentration (treatment). Results from leaves are assumed to include the enclosed branch (Overdieck, 2016), but cannot be extrapolated to the whole tree.
The BiB method has been useful for investigations for detailed physiological responses of leaves to elevated carbon dioxide and the influence of other factors, such as soil nitrogen levels, over growing seasons. Roberntz and Stockfors (1998) used this method to investigate the effects for Norway spruce of ambient carbon dioxide (370 ppm), elevated carbon dioxide (ambient carbon dioxide plus 370 ppm), and soil nitrogen levels on photosynthesis, respiration, carbohydrate accumulation, and acclimation. Elevated carbon dioxide increased average light-saturated photosynthesis by 55%. Increases were higher in needles with higher nitrogen concentrations than lower ones. Elevated carbon dioxide decreased the photosynthetic capacity, reducing rates by 8–32%, reduced carboxylation efficiency, and increased respiration rates. Rates of carbohydrate accumulation were increased by elevated carbon dioxide, while levels of nitrogen, potassium, and magnesium were reduced. Acclimation to elevated carbon dioxide was larger in needles with lower nitrogen concentrations.
7.5.2.5Web-FACE
Branch bags (BiB) enable measurement of the response of leaves of trees to elevated carbon dioxide or ozone, but plastic bags alter the branch environment, and results cannot be extrapolated to whole trees. Recognizing this, Pepin and Korner (2002) developed a free-air method (Web-FACE) for applying carbon dioxide to the canopies of large mature trees in Switzerland. The site was called the Swiss Canopy Crane Site: a large crane was used to install a carbon dioxide release system within the crowns of large trees. Connected to it was a network of small tubes distributed uniformly in the tree canopies. Elevated carbon dioxide was released through small holes in the tubes throughout the growing season (Figure 7.6). To maintain 500 ppm carbon dioxide for 14 tall trees for one growing season required 2 tonnes of carbon dioxide per day.
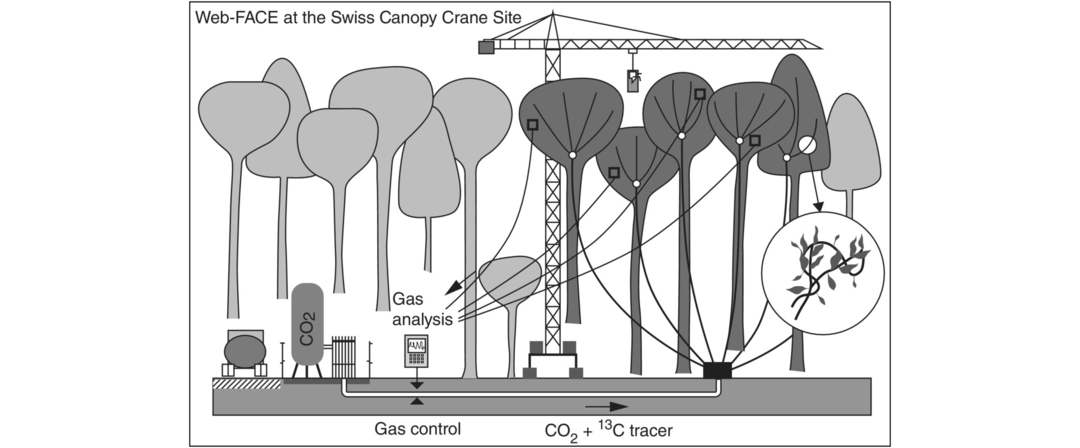
Figure 7.6
Web-FACE is a canopy free-air CO2 enrichment system for tall trees in mature forests.
Adapted by permission from Springer Nature: Springer Nature Ltd, Oecologia 133, 1–9, Web-FACE: a new canopy free-air CO2 enrichment system for tall trees in mature forests, S. Pepin & C. Korner, © (2002)
Asshoff et al. (2006) used the Swiss Canopy Crane Site to assess the effects of 4 years of seasonal 540 ppm carbon dioxide exposure on stem growth of 11 tall trees: three sessile oak (Quercus petrae), three hornbeam (Carpinus betulus), four beech (Fagus sylvatica), and one big leaf linden (Tilia platyphyllos). They used δ13C isotope data from tree rings before and after exposure to carbon dioxide to detect carbon dioxide uptake from exposure to elevated carbon dioxide (δ13 C = [(13C/12C)sample/(13C/12C)standard] −1). The δ13C signal varied, with linden the strongest and beech weaker (Figure 7.7). At the end of the 4-year experiment, there was no appreciable increase in stem growth. They concluded that future elevated levels of carbon dioxide are not likely to increase tree stem growth and stem wood.
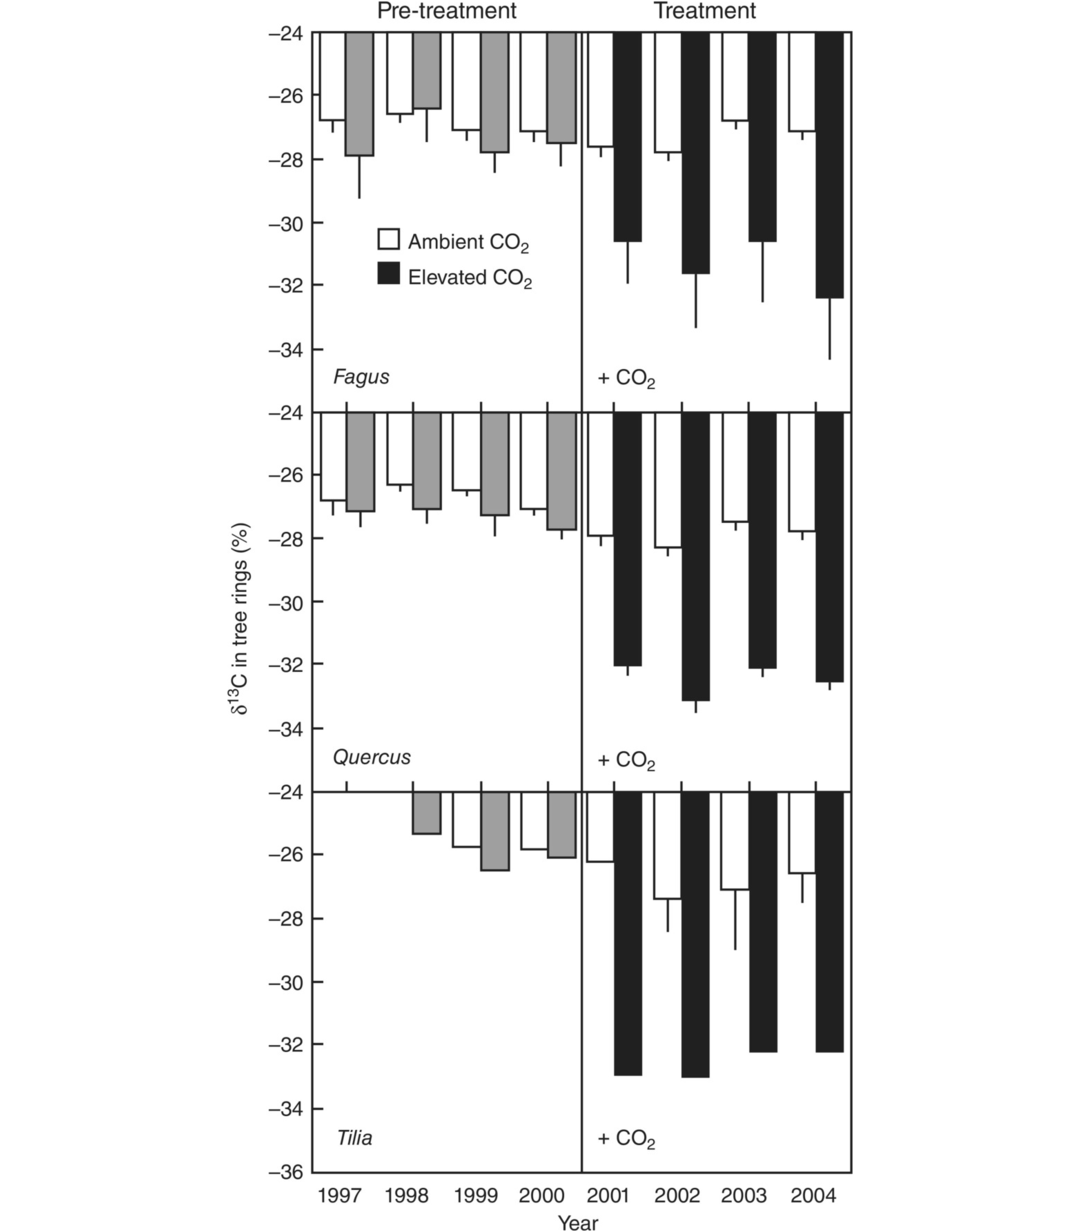
Figure 7.7
δ13C of tree rings in the years before CO2‐enrichment (1997–2000) and during the experiment (2001–2004) for Fagus, Quercus, and Tilia (mean ± SE).
Treated trees and controls did not differ significantly in their δ13C value before the onset of the experiment (2000, P = 0.45). Gray bars (1997–2000) indicate trees later exposed to CO2.
From R. Asshoff et al. Global Change Biology, Growth and phenology of mature temperate forest trees in elevated CO2. Copyright © 2006 by John Wiley & Sons, Inc. Adapted by permission of John Wiley & Sons, Inc.
Bader et al. (2013), also working at the Swiss Canopy Crane Site, exposed a natural forest site with mixed species of mature trees to 550 ppm carbon dioxide for eight growing seasons. The elevated carbon dioxide reduced tree water use and litter production, but radial growth for all hardwood species was unaffected. Using their results, they challenged the assumption that elevated carbon dioxide will provide a global fertilization effect that will increase forest tree growth. This was a concern for them, as this assumption is commonly used in predictive carbon cycle models.
Klein et al. (2016) exposed 110-year-old Norway spruce (Picea abies) to 550 ppm carbon dioxide for 5 years. The trees were not considered to be carbon-limited at the onset of exposure. Over time, the trees absorbed 37% more carbon dioxide than ambient control trees. There were no positive effects on stem diameters, apical growth, or needle litter. The authors proposed a missing sink for the increased uptake of carbon dioxide, one possibility being transfer to ectomycorrhizae associates with roots.
Leuzinger and Korner (2007) studied the oak, hornbeam, and beech at the Swiss Canopy Crane Site, exposing trees to 540 ppm carbon dioxide. Sap flow was reduced by 14% for all tree species, resulting in reduction of approximately 10% in evapotranspiration. Using stomatal response as a measure, the effects of elevated carbon dioxide were most pronounced in hornbeam and beech, but not evident in oak. During dry periods, soil moisture levels declined more slowly under trees treated with elevated carbon dioxide. Leuzinger and Korner suggested a 10% decrease in water use for these types of trees in response to future elevated carbon dioxide. Their documentation of an approximate 10% reduction in evapotranspiration by elevated carbon dioxide is important. Extending this to a large scale could mean a reduction in atmospheric cooling.
Matyssek et al. (2007), working in the Kranzberg Forest in Bavaria, reported the results of their crane Web-FACE experiment with whole-tree exposure to twice ambient ozone (maximum allowable concentration 150 ppb) for a 5-year period for 60-year-old 30-m beech trees (Fagus sylvatica). A non-significant decrease in average annual stem growth of 3% was found. Fine root and ectomycorrhizal development was stimulated.
7.6Chemical Protectants
Exposure chambers and FACE installations are designed primarily to determine the effects of projected future elevated steady-state concentrations of carbon dioxide and ozone on trees. Unlike carbon dioxide, levels of ambient ozone fluctuate widely. Periodic episodes of elevated ozone can cause foliar injury, which over time leads to growth reduction. Determining these effects under truly ambient conditions is difficult. However, a variety of chemicals have been recognized as having protective effects against ozone injury for plants growing in the field under ambient conditions, without chambers (Manning, 2000). Thus, by applying ozone-protective chemicals to some of the plants and not others, the effects of natural ozone exposure can be studied. This has allowed multi-year research on tree growth and biomass under natural ozone exposure and conditions. The most successful and widely used protectant chemical compound is ethylenediurea (abbreviated as EDU), N-[2-(2-oxo-1-imidazolidinyl)ethyl]-Nʹ-phenylurea. The complete mode of action of EDU remains elusive, but it is known that it does not provide protection from ozone by acting as a nitrogen supplement (Manning et al., 2011).
EDU was used to protect loblolly pine (Pinus taeda) seedlings from ambient ozone in a replicated treatment field plot upwind of Houston, Texas, outside the town of Nacogydoches, Texas, for three growing seasons. EDU was applied as biweekly foliar sprays, at 150, 300, and 450 ppm, to ozone-sensitive half-sib loblolly pine seedlings during the growing season. Water sprays were used as the control treatment. Ambient ozone levels were often in the 50–60 ppb range, with periodic episodes as high as 118 ppb. At the conclusion of the third growing season, ambient ozone had significantly reduced the total biomass. EDU at 450 ppm prevented the effects of ozone; EDU at 150 and 300 ppm provided less protection (Figures 7.8 and 7.9). This provided verification of the effects of ambient ozone on loblolly pine under completely natural conditions (Manning et al., 2003).

Figure 7.8
Dry weights for main stems, side stems, and total stem weight in relation to EDU treatments.
Values that have the same letter designations are not significantly different from each other (P = 0.05).
Adapted from Environmental Pollution 126, 73–81, W. J. Manning et al., Assessing plant response to ambient ozone: growth of ozone-sensitive loblolly pine seedlings treated with ethylenediurea or sodium erythorbate, Copyright (2003), with permission from Elsevier.

Figure 7.9
Stem height (in cm) in relation to EDU treatments.
Values that have the same letter designation are not significantly different from each other (P = 0.05). Average of 30 seedlings per treatment.
Adapted from Environmental Pollution 126, 73–81, W. J. Manning et al., Assessing plant response to ambient ozone: growth of ozone-sensitive loblolly pine seedlings treated with ethylenediurea or sodium erythorbate, Copyright (2003), with permission from Elsevier.
The influence of ambient ozone on growth and biomass of an ozone-sensitive clone of hybrid poplar (Oxford) was determined for three and six growing seasons in a field plot near Florence, Italy. Protection from ozone injury and growth reduction effects was found after 3 years (Hoshika et al., 2013). By the end of the sixth growing season, the trees had been exposed to a total of 23 ppm ozone hours (AOT40 cumulative value). Ambient ozone reduced the biomass and root volume, and stem diameter decreased in the lower third of the stem. EDU treatments prevented the effects of ambient ozone (Carriero et al., 2015).
7.7Meta-analysis of Results from Direct Methods
Results from FACE investigations and chamber experiments are available in hundreds of reports of numerical evidence for interactions between trees, carbon dioxide, ozone, and combinations of both gases. Meta-analysis is a statistical method that can be used to combine the findings of many experiments, find the average of the effects, make generalizations, and draw conclusions. The conclusions are often used in predictive models of the effects of elevated carbon dioxide and ozone on forests (Haworth et al., 2016).
De Dios et al. (2016) used a meta-analysis to explore intraspecific variation in juvenile tree growth in response to elevated carbon dioxide and ozone, alone and in combination. Twenty-five reports from FACE, OTC, BiB, growth chambers, and greenhouses were used. Of the seven tree species used, Sitka spruce (Picea sinensis) and poplar (Populus deltoides) predominated. For elevated CO2, tree growth and photosynthesis increased on average by 57.7%. Stem biomass increased by 36%, as did stem volume and stem biomass. Stem height increased only by 9.5%. Elevated ozone generally reduced height, stem volume, and photosynthesis. Trees that grew well with elevated carbon dioxide tended also to grow well with elevated carbon dioxide and ozone.
Wittig and Long (2004) published a very long and detailed meta-analytic review of the response of plants to elevated carbon dioxide in FACE exposure systems. Trees were more responsive than crop plants. Results from actively growing young tree species in AspenFACE, Duke Forest, Oak Ridge (USA), ETH-Z (Switzerland), and PopFACE (Italy) were the primary sources. In general, there was a 28% increase in above-ground dry matter due to exposure to elevated carbon dioxide. Stem diameter increased by 9%. Leaf number increased by 8%, but LAI did not change with tree growth. Stomatal conductance decreased, and photosynthetic acclimation increased.
Wittig et al. (2009) used meta-analysis to assess the impact of current levels of ozone (average 40 ppb) and estimated future levels of ozone (64 ppb and 97 ppb) on tree biomass, growth, physiology, and biochemistry in Northern Hemisphere forests. Current ozone levels reduced tree biomass by 7%, while 64 ppb reduced it by 11%, and 97 ppb reduced it by 17%. Elevated ozone reduced root/shoot ratios, leaf area, chlorophyll, and rubisco. Respiration rates were reduced, as were tree heights and stem diameters. The effects of elevated ozone were significantly less for gymnosperms than angiosperms. From this, Wittig et al. predicted that if ozone were to rise to the elevated levels used in their analysis, this would lead to a reduction in the future forest carbon sink.
Li et al. (2017) used meta-analysis to determine the future influence of elevated ozone (116 ppb) on growth and biomass, as affected by tree and leaf type. Chinese temperate deciduous species were more sensitive than deciduous species originally from Europe and North America in terms of effects on growth, photosynthesis, and respiration. Elevated ozone reduced tree biomass by 14%, also reducing tree height and stem diameter. Subtropical broad leaved evergreen and needle-leaf species were less sensitive than temperate deciduous trees. Given that subtropical broad leaved species are dominant in forests in China, future ozone effects may be less than predicted for increasing ozone levels.
Lyons et al. (2016) suggested that the generalizations derived from meta-analyses, because they are from average values, should be considered not whole truths, but half truths. Haworth et al. (2016) replicated some of the methods used in reported meta-analyses of tree and other plant responses to elevated carbon dioxide. They concluded that the meta-analyses exaggerated the magnitude of the effects by 20–40%. Their concern was that average values from meta-analyses are often used in models to predict the effects of future elevated carbon dioxide on trees and plants.
7.8Indirect Methods of Assessment
Direct methods, such as experimental chambers and FACE, with limited numbers of trees, provide empirical evidence of biogeochemical and biogeophysical effects of elevated carbon dioxide and ozone. Much has been discovered about the influence of elevated carbon dioxide and increasing temperature on photosynthesis, transpiration, and water-use efficiency by leaves (Way et al., 2015). Moving up to forest and ecosystem levels requires many different assumption-based methods or often combinations of these, resulting in less-specific generalizations, rather than empirical evidence. Indirect methods include use of flux tower data or satellite and remote sensing results, and many models that combine several methods and statistical analyses. The number of combinations is extremely large. Most of what we know about large-scale elevated carbon dioxide and ozone effects on forests was concluded from model results.
7.8.1Flux Towers for Carbon Dioxide
Large towers, containing instrumentation to measure wind speed and direction, temperature, carbon dioxide, water vapor, and other gases, are placed above forest canopies. They continually and directly measure changes in covariance between the upward and downward movement of gases in turbulent air between the canopy and the atmosphere. A global network of more than 500 flux towers (FLUXNET) has been established (NCAR, 2017) and can measure how much carbon dioxide and water vapor flows in or out, in wind gusts or eddies (Baldocchi, 2003, 2014; Burba et al., 2013). Carbon dioxide flux values are calculated on the half hour. Positive flux indicates net loss of carbon dioxide (from respiration), and negative flux indicates carbon dioxide uptake (photosynthesis). The flux data require additional processing to determine carbon dioxide uptake in photosynthesis and release in respiration (Campioli et al., 2016).
Flux towers require turbulence to function well. They are also not effective for individual trees, small areas, and uneven topography (Baldocchi, 2003; Campioli et al., 2016).
Ueyama et al. (2014) used 9 years of carbon dioxide flux data to investigate the role of summer warming, a longer growing season, and a warmer autumn on GPP and respiration in black spruce (Picea mariana). They concluded that black spruce shifted during the course of the experiment from a carbon sink to a carbon source, and that the effect was due to increased autumnal warming and respiration and not GPP. Hopkinson et al. (2016) compared repeat airborne laser scanning (ALS) of three-dimensional forest plot structure to data from flux towers for mixed-age jack pine (Pinus banksiana) in Saskatchewan. The flux data were used to estimate cumulative carbon dioxide fluxes and net ecosystem production (NEP). ALS was used to model variation and accumulation of total biomass. The authors concluded that ALS determination of accumulated biomass was greater than flux-measurement-based NEP.
7.8.2Satellite Remote Sensing
The availability of high-resolution satellite remote sensing systems has increased accurate assessment of the condition of the Earth’s forest areas. The satellites are moving sensors in orbit, and the number of observations of a given area or day are limited, as are observations on cloudy days. Some satellite assessments include all terrestrial vegetation. Zhang et al. (2018) have used long-term LAI records from satellite imagery, combined with global ecosystem models, to conclude that a widespread global increase in the growing season has resulted in a global 25–50% increase in LAI (greening), with less than 4% decrease in LAI browning. This is the global greening or carbon dioxide fertilization effect, and it is proposed that it reflects an increase in uptake and fixation of some of the anthropogenic carbon dioxide by global terrestrial vegetation (Smith et al., 2015). It is also the basis for advocating very large-scale tree planting programs. Other satellite data confirm a significant increase in NPP from 1982 to 2011. Smith et al. (2015) proposed that their newer satellite data showed a smaller rate of growth increase over the period 1982–2011, compared with that estimated by the Earth System Model (ESM). They proposed a 2.8% ± 1.50% increase versus the ESM model’s estimated increase of 7.6% ± 1.67% from 1982 to 2011. Accurate assessment of long-term trends in NPP is complicated, as NPP is affected by changing balances between biogeochemical (carbon dioxide) and biogeophysical (temperature and water) factors, and by the availability of nitrogen, phosphorus, and other nutrients over long time periods (Smith et al., 2015). Sun et al. (2017) used satellite remote sensing to detect and quantify total GPP. Images from the Orbiting Carbon Observatory-2 (OCO-2, NASA) were obtained for solar-induced chlorophyll fluorescence, a high-resolution signal which was used as global proxy for GPP. The use of an airborne chlorophyll fluorescence imaging spectrophotometer allowed determination of photosynthesis.
Satellite remote sensing has also been used to detect the condition of trees in forests. The Global Forest Watch (2015) program used satellite imagery (US Geological Survey Landsat and NASA) to detect global tree loss at a resolution of 30 m from 2000 to 2013. After analyzing 400,000 satellite images, they concluded that 18 million hectares (69,500 square miles) of tree cover was lost, either permanently or due to disturbances, insect infestations, or fires. Rogers et al. (2017) detected early incidence of decline in tree growth and mortality in boreal North American forests, using satellite-based indices, such as the Normalized Difference Vegetation Index (NDVI), and detection of time-series tree growth patterns. They concluded that tree mortality caused by drought and insect infestation is widespread in boreal forests. Bochenek et al. (2018) used satellite images (Landsat 5 TM and 8 OLI SPOT-5) to detect tree condition, diversity, and forest structure. They were able to detect and construct indices of water stress.
7.8.3Modeling
How global warming is affecting the nature and function of forests, now and in the future, and what this means for forests and the Earth’s atmosphere, are two questions that are difficult to answer using short-term traditional empirical evidence-based methods. Long-term experiments to answer the two questions are not possible. Therefore, models have been developed to try to understand the complexity of interacting environmental factors and future impacts on forests (Medlyn et al., 2011). They are often used to predict the future effects of carbon dioxide increase and atmospheric warming. While many models have been developed, the nature, use, and results of only a few types of models are presented here.
Models can be divided into groups depending on their intended use.
Process models simulate how environment affects trees and predict future climate effects (Peck, 2000). Ecological process models can predict how and when trees respond. Process models are often used to describe and predict forest response to environmental change (Ashraf et al., 2015).
Statistical models are used to discover criteria that can be used to describe and predict the strength of relationships from available data. Significant differences and correlation are the desired outcome (Peck, 2000). Statistical species distribution models, niche, or bioclimatic envelope models can be used to establish relationships between species and their environment.
Simulation models are large computer programs that attempt to quantitate, integrate, and clarify interacting environmental processes (Peck, 2000; Medlyn et al., 2011).
Kovenock and Swann (2018) investigated how a leaf trait acclimation of one-third increase in leaf mass per area in simulated climate warming affected climate and carbon cycling in ESM experiments. Global NPP decreases were related to current emission levels from fossil fuel combustion. Reduced evapotranspiration and increased absorption of sunlight increased warming. Leaf area growth is reduced as leaf mass increases, increasing carbon costs for leaf area construction. This results in decreased productivity and evapotranspiration, and thus results in warming.
As has been said, much of what we know about large-scale forest/environment interactions and predictions comes from the results and conclusions of many models. As they represent current perceptions of the reality of complex systems, the conclusions are usually accepted as the best information we have at present. The validity and utility of the results, however, depend on the model and how it was used, and most importantly, the number and nature of its assumptions. The number of assumptions that can be included in a model is limited – and missing out a factor may affect the application of the results. Environmental factors may be simplified or omitted (Peck, 2000). Medlyn et al. (2011) concluded that results from all types of models can be of value if the assumptions are clear, given, and understood.
Ashraf et al. (2015) used a new process model for growth and yield (JABOWA-3), and tree growth data from 3,000 permanent plots in Nova Scotia, Canada, to predict basal area and volume growth of individual trees in single or mixed forest stands. Model validation efficiency was 0.82–0.89 in predicting basal area and stem volume growth. Iverson et al. (2008) used three climate models to predict potential climate change impacts on future habitat areas for 134 tree species in the northeastern United States, using low and high carbon dioxide emission rates. Predicted opportunities for future habitat expansion generally were greater than constrictions. At the high emission rate, decreasing habitat area was predicted for the six key forest species balsam fir (Abies balsamea), paper birch (Betula papyrifera), red spruce (Picea rubens), black cherry (Prunus serotina), trembling aspen (Populus tremuloides), and bigtooth aspen (Populus grandidentata). A long-term prediction for the northeastern United States was for decrease in the spruce–fir zone and advancement of the oak (Quercus)–hickory (Carya) forest type.
7.8.3.1The Temperature Gap
Climate simulation models predict trends in global air temperature. A number of investigators have concluded that observed temperature trends are significantly lower than the model-predicted trends. These observed trends have been slowly occurring for the last two decades. When the observed temperatures are subtracted from predicted temperatures, the result is a temperature gap. Temperature follows changes in carbon dioxide over time, so there may also be a carbon dioxide gap (Leggett and Ball, 2015, 2018). The significance of and rationale for this cooling and warming are given in later examples of cooling and warming.
7.9Elements of Atmospheric Cooling and Warming by Forests
The roles of elevated carbon dioxide and ambient ozone in tree growth and function in photosynthesis, growth, and biomass accumulation, under varying experimental conditions, have been presented here. Knowledge about physiological responses, such as transpiration, gas exchange, photosynthesis, and respiration, for leaves and young trees in the initial rapid growth phase has been obtained from short-term experiments and is documented. Way et al. (2015) have illustrated confidence levels in tree responses to carbon dioxide and temperature in small-scale experiments (Figure 7.10). It is evident that confidence in results from these experiments only extends for a period of months. The exponential growth phase declines with time, as other factors such as water availability, nutrition, and adaptation occur (Kirschbaum and Lambie, 2015). Extrapolation of results from the exponential growth phase to larger, more mature trees is difficult, as the level of complexity and assumptions increases with tree size and numbers. This has complicated accurate wide-scale assessment of the response of older forest trees to elevated carbon dioxide. This level of assessment requires the use of indirect methods, such as tree ring analysis, flux towers, forest inventory data, models, satellite data, and remote sensing.

Figure 7.10
Conceptual diagram of our confidence in tree responses to elevated CO2 (blue symbols), elevated growth temperatures (red symbols), or the combination of high CO2 and temperature (purple symbols), with higher confidence shown by larger‐sized symbols.
Circles represent photosynthetic responses, squares represent respiration responses, and triangles represent responses of stomatal conductance. While short‐term, leaf‐level responses to CO2 (such as “A/Ci” curves, which depict net CO2 assimilation rate versus calculated substomatal CO2 concentration) are well understood, we have less data on longer‐term CO2 acclimation responses or responses at any time scale at larger spatial scales (such as stand level responses to CO2 from FACE studies), and none that have run for decades or explored large‐scale responses of forest stands to warming.
From D. Way et al., Plant, Cell and Environment, The space-time continuum: the effects of elevated CO2 and temperature on trees and the importance of scaling. Copyright © (2015) by John Wiley & Sons. Adapted by permission of John Wiley & Sons, Inc.
Increased global forest biomass, in response to elevated carbon dioxide, is considered an essential element of partial mitigation of anthropogenic carbon dioxide now and in the future. The IPCC’s Fifth Assessment Report: The Role of Forests advocates for improved forest carbon sinks using “negative emission” techniques, such as reduction of deforestation and land-use change, improved forest management, and planting of new forests (afforestation) (Christ, 2014). Article 5 of the Paris Agreement promotes forest enhancement and conservation as part of a goal to keep long-term global average temperature less than 2 °C (and preferably 1.5 °C) above pre-industrial temperature levels (Climate Focus, 2015). Minimizing deforestation in the tropics is proposed to be promoted by REDD+ and JMA (Joint Mitigation and Adaptation mechanism). Norway, Germany, and the United Kingdom will help to finance REDD+ projects. China, India, and other countries have begun massive afforestation projects (Walberg, 2018).
One of the anticipated climate benefits of large-scale afforestation is removal of anthropogenic carbon dioxide from air in photosynthesis and storage of carbon in wood. As discussed in previous chapters, other factors that affect the influence of forests on climate and temperature include respiration, transpiration and evaporation, vapor pressure deficit, BVOCs, aerosols, ozone, methane and nitrous oxide, water and soil nutrient availability, tree species, and albedo (Bonan, 2008; Lamba et al.2017). Background information about some of these factors is given here and will be followed by examples of research results that support either atmospheric warming or cooling by forests.
7.9.1Photosynthesis and Respiration
As described previously (see Section 4.3.1), photosynthesis is the primary process for carbon fixation and storage. It is expected to increase as carbon dioxide increases, unless limited by soil water availability and by levels of nitrogen and phosphorus in soils. Experimental evidence indicates that elevated carbon dioxide will decrease stomatal opening, and this will reduce transpiration and increase water-use efficiency (Long, 2012; Keenan et al., 2013), although this is questioned by Frank et al. (2015). Rising temperature and ozone, together with drought, are predicted to reduce production of natural plant communities. Some of this may be reduced by increasing carbon dioxide (Long, 2012).
Terrestrial ecosystems (mainly forests) have been estimated to offset approximately 25% of anthropogenic carbon dioxide. This is attributed to a small imbalance between global photosynthesis and respiration, which is greater at night than during the day. Arneth et al. (2017) estimated that approximately 64 Gt of carbon dioxide per year are released to the atmosphere by respiration of terrestrial plants, offsetting approximately half of the total ecosystem GPP. They conclude that this level of emission is six times larger than all fossil fuel carbon dioxide emissions.
7.9.2Transpiration and Forest Water Cycle
Transpiration is a key process in atmospheric cooling (see Section 4.6.2). Increased temperature and carbon dioxide have different effects on transpiration: temperature increases vapor pressure deficits, which can increase rates of transpiration, as warmer air can contain more water vapor; elevated carbon dioxide may partially close stomates, which will reduce rates of release of water vapor by transpiration and reduce surface cooling, which may increase atmospheric warming. Reduced transpiration rates may reduce soil water infiltration and recharge from rain, and reduce atmospheric water vapor, which may reduce precipitation, increase surface water runoff, and affect stream flow (Ellison et al., 2017; Gimeno et al., 2018; Kirschbaum and McMillan, 2018). Ellison et al. (2017) have summarized the effects of the forest water cycle on climate in Figure 7.11.
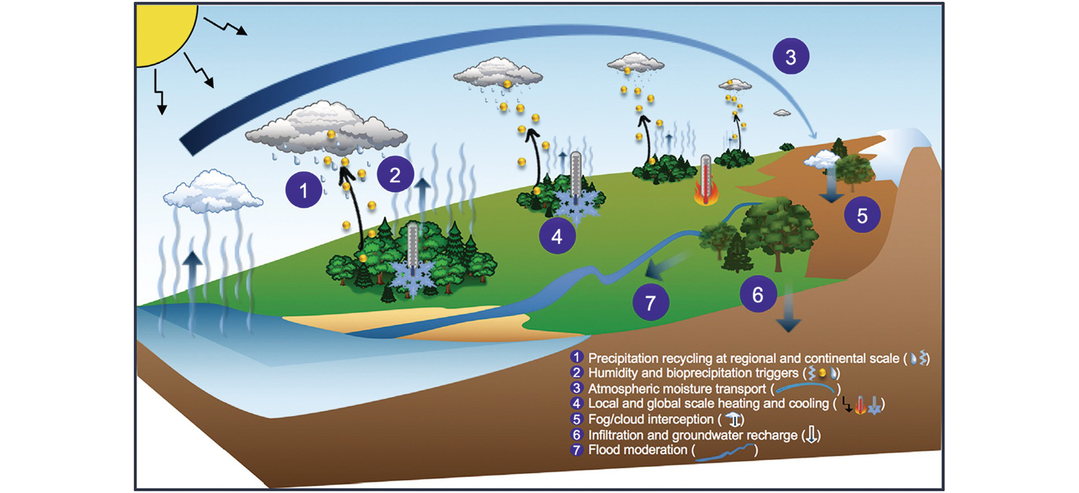
Figure 7.11
Effects of forests on water and climate at local, regional, and continental scales through change in water and energy cycles.
(1) Precipitation is recycled by forests and other forms of vegetation and transported across terrestrial surfaces to the other end of continents. (2) Upward fluxes of moisture, volatile organic compounds, and microbes from plant surfaces create precipitation triggers. (3) Forest-driven air pressure patterns may transport atmospheric moisture toward continental interiors. (4) Water fluxes cool temperatures and produce clouds that deflect additional radiation from terrestrial surfaces. (5) Fog and cloud interception by trees draws additional moisture out of the atmosphere. (6) Infiltration and groundwater recharge can be facilitated by trees. (7) All of the above processes naturally disperse water, thereby moderating floods.
Adapted from Environmental Change 43, D. Ellison et al. Trees, forests and water: cool insights for a hot world, 51–61, Copyright (2017), with permission from Elsevier.
Evaporation is the process of transformation of liquid water to a vapor from any surface. The water does not move through or depend directly on plants. Evaporation rates are affected by sunlight and temperature. Evaporation from wet canopy leaves and moist soils affects long-term water balance and hydrology (Kirschbaum and McMillan, 2018).
Evapotranspiration is a collective term that includes transpiration and evaporation. Together with evaporation from oceans, lakes, and streams, evapotranspiration rates affect precipitation. Evapotranspiration and transpiration have sometimes been used interchangeably when only transpiration was intended, resulting in confusion.
Evapotranspiration includes physical evaporation of free water, and evaporation of water via stomatal conductance during transpiration from plant leaves. In many global-scale models, only transpiration is used to estimate global warming or cooling effects by trees and forests. While evapotranspiration may be the overall driver, it is not possible to accurately determine the magnitude and importance of the role of transpiration in warming or cooling. This is unfortunate and may be misleading. Lawrence et al. (2006) concluded that current knowledge at the time indicated that transpiration was the largest component of evapotranspiration, followed by soil and canopy evaporation. Frank et al. (2015) estimated that 60% of the water from land enters the atmosphere as transpiration. Jasechko et al. (2013) concluded that 80–90% of water flux from the Earth’s surface enters the atmosphere from transpiration. They proposed that climate models should include greater simulations of transpiration, rather than evaporation or evapotranspiration. From this it could be assumed that effects ascribed to evapotranspiration are mostly caused by transpiration.
7.9.3Water-Use Efficiency
One of the physiological benefits for plants from exposure to elevated carbon dioxide is partial stomatal closure, reducing the amount of water needed for plant growth and biomass. This results in increased water-use efficiency (WUE). WUE can be defined as a ratio between water used in metabolism and water lost via transpiration, or as the magnitude of dry biomass production per unit of evapotranspiration (Pallardy, 2008). Increased WUE, due to decreased transpiration, is a major contributor to increased growth in response to elevated carbon dioxide.
Keenan et al. (2013) found large increases in WUE and growth for trees in boreal and temporal regions of North America over the past two decades. They also detected increased photosynthesis, net carbon uptake, and decreasing evapotranspiration (principally transpiration). Together with increased WUE, they concluded that they had identified a “CO2 fertilization effect,” possibly due to partial stomata closure. This would allow maintenance of a steady concentration of carbon dioxide in a leaf, regardless of the external concentration of carbon dioxide, due to increased WUE. Holmes (2014) responded to Keenan et al. (2013) by proposing instead that declining levels of ozone, and of ozone precursors nitric oxide and nitrogen dioxide, in the northeast and Midwest United States might partially account for increases in WUE and decreased transpiration, and that carbon dioxide fertilization was not the complete cause. In reply, Keenan et al. (2014) allowed that ozone might play a role as ozone levels were increasing globally and in the western United States because of precursor transport from Asia, where ozone levels are high.
Frank et al. (2015) used a retrospective analysis of tree ring C13 isotope data for the twentieth century for Quercus and Pinus stands in European forests. Their results led them to oppose the proposal that partial closure of stomata caused by anthropogenic (elevated) carbon dioxide reduces transpiration. They proposed that a warming climate would increase LAI over an increasing growing season with resulting increased transpiration. Partial or complete stomatal closure might occur in controlled experiments, but ambient water vapor content has increased in Europe. They proposed two very interesting possible counteracting effects of elevated carbon dioxide on leaves in relation to transpiration:
1.Increased transpiration would increase latent heat loss and reduce surface temperature;
2.Increased transpiration could increase warming through feedbacks from water vapor and soil hydrology changes.
7.9.4Albedo
Earth surfaces absorb and reflect incoming radiation during the day and reradiate some back to space at night. Albedo (see Section 4.6.1) is a measure of the degree of reflection, which determines the extent of surface absorption and heat retention. Clean white new snow has an albedo close to 1 and may reflect nearly all incoming light. Albedo values change with the seasons and for types of vegetation. Conifers have continuous dark color, and deciduous trees have somewhat less dark color when in leaf. Betts and Ball (1997) measured albedo in a boreal forest in Canada. Average albedo in summer for in-leaf aspen (Populus tremuloides) was 0.15, while spruce (Picea mariana) and pine (Pinus banksiana) sites averaged 0.083. Winter average albedo values with snow under canopies were 0.21 for leafless aspen, 0.15 for pine, and 0.11 for predominate spruce, with an average for conifers of 0.11. Albedo for forests increases in winter when snow under canopies is present. It was concluded that the albedo of conifer sites in winter would rarely reach 0.30. By contrast, average albedo values for grasslands in the area were 0.20 in summer and 0.75 when covered with snow in winter.
7.9.5Biogenic Volatile Organic Compounds and Clouds
BVOCs, such as isoprene and monoterpenes (see Section 4.5), are emitted naturally by tree leaves, especially conifers, often in response to increasing air temperatures to prevent internal leaf damage. They affect several important aspects of the atmosphere. BVOCs rapidly oxidize in the atmosphere to form suspended sulfur and nitrogen aerosol particles, which reflect incoming light and may provide some atmospheric cooling (Spracklen et al., 2008; Penuelas et al., 2009). Oxidation of BVOCs may result in cloud condensation nuclei and formation of high clouds that may cool the Earth’s atmosphere. BVOCs may also participate in the photochemical oxidant cycle (see Section 3.7) in warm months to enhance ozone production, which can have negative effects on tree growth and biomass. Ozone is the third most important reradiative greenhouse gas, and it slows the breakdown of methane, also an important greenhouse gas (Penuelas et al., 2009; Unger, 2014).
7.9.6Forest Carbon Sinks
In many global simulations and satellite assessments of global greening, increased responses are concluded to arise from all vegetation: that is, all plant forms and communities, from grasslands to shrubs to trees, and from tropical forests to boreal forests (Lapola et al., 2008). Interpreting what the collective term “vegetation” means in terms of trees and forests can be difficult. There are currently 3.04 trillion trees on the planet, covering 30% of the terrestrial land surface (Crowther et al., 2015). Forests provide approximately 50% of GPP and approximately 45% of stored carbon on and in land (Bonan, 2008). It would appear from this that, in terms of the global carbon cycle, trees play the major role in cooling and warming the planet (Schimel et al., 2015). This is encouraging, as photosynthesis is the major mechanism for removal of carbon dioxide. Trees account for most of the carbon capture and long-term storage in terrestrial ecosystem. The expected outcome is that they represent a substantial negative feedback to atmospheric carbon dioxide concentrations, offering carbon sequestration and some potential mitigation of global temperature increase. Whether this is occurring, and to what extent, remains a large uncertainty for predicting future temperatures and climate change (Schimel et al., 2015).
Tropical forests of the world, especially the Amazon rainforest, are assumed to be the largest terrestrial sinks for carbon from carbon dioxide. From experimental evidence, Schimel et al. (2015) expected that rising current carbon dioxide levels would increase global carbon dioxide uptake, primarily by trees, and storage in long-term sinks, especially in the tropics. Using simulation and other models and atmospheric estimates, they reported significant carbon dioxide uptake by tropical forests. By combining results from tropical forests and extratropical areas, they suggested that increasing carbon dioxide caused as much as 60% of the current terrestrial carbon sink.
Baccini et al. (2017) used 12 years of satellite data to measure live woody vegetation in tropical areas of America, Asia, and Africa. Gains from growth were compared with losses from deforestation and disturbances. They concluded that the forests they had evaluated went from being carbon sinks to carbon sources. Brienen et al. (2015) used historical evaluation of long-term plots to conclude that the Amazon carbon sink was in decline. The rate of biomass increase declined by a third since the 1990s, and mortality was increasing.
Elevated carbon dioxide is well known to stimulate growth and carbon sequestration of young trees in experiments (Korner, 2017). How long this continues in older trees under forest conditions, especially in the tropics, is less well known (Bugmann and Bigler, 2011). Brienen et al. (2015) concluded that tree longevity in the Amazon was shortened, especially for fast-growing trees, resulting in “shorter residence time” for carbon in trees. Bugmann and Bigler (2011) modeled growth responses to elevated carbon dioxide and changes in tree longevity for 141 temperate tree species. Their conclusion was that any growth stimulation mediated by elevated carbon dioxide would be offset by factors that reduced tree longevity, reducing forest mitigation. Korner (2017) views tree longevity as essential to increase stored carbon. Faster tree growth will not result in greater carbon sequestration.
7.10Role of Forests in Warming and Cooling the Atmosphere
There is considerable interest at local, national, and global levels in the possible role of forests in cooling or warming the atmosphere, and what effects this would have on climate change. Given the size and complexity of forests, indirect assessment methods, such as the models, flux towers, satellite imaging, and remote sensing described in this chapter are necessary. Empirical data from large, long-term measurement studies in field plots are also available. Researchers have used combinations of methods to pursue aspects of the role of forests in cooling and warming the atmosphere, often in relation to forest types and latitudinal locations, and to draw conclusions or make predictions. Afforestation, deforestation, forest disturbance, tree physiology, tree nutrition, tree species and longevity, and albedo are all factors.
7.10.1Influence of Forest Characteristics
Bonan (2008) published an extensive, well-illustrated review of the benefits of climate forcing and feedbacks by tropical, temperate, and boreal forests, with emphasis on albedo and evapotranspiration, the carbon cycle, and changes in forest cover and forest–atmosphere interactions. Using results from atmospheric and climate simulation models, he examined the role of forests in cooling and warming the atmosphere. This review is widely cited in other papers.
7.10.1.1Tropical Forests
Tropical forests were estimated to contain approximately 25% of terrestrial carbon and account for approximately 33% of total NPP. Tropical forests are considered to be somewhere between carbon-neutral, owing to carbon release from deforestation, and carbon sinks, owing to extensive carbon uptake by intact undisturbed forests. Low albedo of trees causes moderate warming, offset by high rates of evapotranspiration, which cools air and affects precipitation rates. A combination of carbon dioxide removal and evapotranspiration provides negative climate forcing. Deforestation, carbon sink reduction, fires, and drought will reduce negative climate forcing.
7.10.1.2Boreal Forests
Many trees in boreal forests are dark-colored conifers that experience short growing seasons, resulting in only moderate gain and storage. Albedo numbers for conifers are low, resulting in positive forcing and warming. Evaporative cooling is low, also increasing warming. Considerable carbon is stored in soil and wetland. Boreal forests are at risk from fires and insect infestations.
7.10.1.3Temperate Forests
Temperate forests contain approximately 20% of plant biomass and approximately 10% of stored carbon. Forests may be mostly deciduous, mostly coniferous, or mixtures. In general, forests have lower albedo than croplands. They may warm air in summer, which may be offset by moderate evaporative cooling and strong carbon sequestration. The effects of low albedo in winter interact with evapotranspiration in summer to determine mean annual temperature. Uncertainty prevails in predicting the extent of net climate forcing by temperate forests. Land-use change may reduce the extent of these forests.
7.11Evidence for the Role of Forests in Cooling and Warming the Atmosphere
Gibbard et al. (2005) modeled the potential effects of replacement of forests with grassland or crops, and the reverse. They concluded that replacing grassland and crops with trees would reduce albedo and result in a global mean warming of 1.3 °C, similar to the effect caused by elevated carbon dioxide. Replacing trees with grassland and crops would increase albedo and would cool temperatures by 0.4 °C.
Bala et al. (2007) modeled the effects of global deforestation on air temperature. Deforestation results in release of carbon stored in trees and soils, causing a warming effect. They proposed that increased albedo and changes in evapotranspiration would offset the warming, resulting in cooling. Their results questioned the climate benefits of afforestation and tree planting programs. Together with conclusions by Gibbard et al. (2005), their results led to many articles in popular media saying that climate is cooler without trees.
Canopy transpiration plays a major role in determining the air cooling and warming effects of forests (Cao et al., 2010). Increasing carbon dioxide has been shown experimentally to increase photosynthesis, plant growth, and biomass by partially closing stomata, reducing transpiration and increasing water-use efficiency. This has stimulated research on the effects that reduction of transpiration might have on forest cooling or warming, and soil water runoff. Methods used include models, observations and empirical data, satellite imagery, and combinations of these.
Cao et al. (2010) used simulation models to assess the future effects of elevated carbon dioxide (800 ppm): it reduced stomatal aperture, which affected canopy transpiration and soil evaporation, reducing the evaporative cooling effect of the forest. Water vapor in air was lower, which affected low cloud levels and in turn affected net surface radiative fluxes, resulting in air temperature increase. They termed this result, from partial stomatal closure by elevated carbon dioxide, “CO2 physiological forcing”. Increased surface water runoff removed water that might have been used in transpiration for air cooling. In 2010, they estimated that elevated carbon dioxide caused a global reduction in canopy transpiration of 8% (revised from 16% in 2009).
China has been converting cropland and marginal land to massive tree plantations since the 1980s. Peng et al. (2014) considered how increased land surface temperature from decreased albedo from the trees was countered by cooling effects of the trees, due to increased evapotranspiration (mainly transpiration). Satellite measurements of forest areas and adjacent grassland or non-forested areas were used to measure land surface temperatures. Afforestation reduced average daytime temperature by approximately 1.1 °C; nighttime temperature was increased by approximately 0.2 °C. Increased evapotranspiration was concluded to have caused the cooling. In dry regions, nighttime warming increased and offset daytime cooling for net warming of land surface temperature.
Ban-Weiss et al. (2011) examined the changes in surface latent heat and sensible heat by evapotranspiration from trees and forests. Evapotranspiration changes sensible heat to latent heat during evaporation of water. Latent heat flux to the atmosphere results in the cooling termed evaporative cooling. Water vapor eventually condenses, linking it with the hydrological cycle. They concluded that evaporative cooling was global, rather than local.
As mentioned above, partial stomatal closure in response to elevated carbon dioxide reduces transpiration of water vapor to the air. This can cause reduction in low cloud cover and a decrease in latent heat flux transfer to the atmosphere, resulting in warming (Cao et al., 2010). Doutriaux-Boucher et al. (2009) used a climate–carbon-cycle model, with twelve 5-year experiments with doubled or quadrupled carbon doxide at the start of the experiments, to determine climate feedback. In less than a year, the influence of elevated carbon dioxide on stomatal conductance and transpiration resulted in a reduction in low cloud cover, increasing the incidence of incoming shortwave solar radiation. They estimated that this was equivalent to a 10% increase in radiative forcing, which resulted in warming.
Lee et al. (2011) used 33 FLUXNET towers close to forest sites to compare nighttime and daytime temperatures in cleared land near the towers with adjacent forests at higher altitudes in the United States and Canada. They found that open-air areas cooled the air at night more than forests in both northern and southern latitudes. Forests were warmer at night. They attributed this to air turbulence from trees drawing down warm air from above.
Shen et al. (2015) modeled the effects of increased vegetation growth on air cooling on the Tibetan Plateau. Compared to native grasslands, albedo for vegetation was reduced, and warming may have increased. Negative feedback from evapotranspiration resulted in cooling from vegetation, reducing atmospheric warming. Removal of vegetation and restoration of natural grasslands would increase cooling with higher albedo.
Using satellite data, Alkama and Cescatti (2016) investigated how changes in forest cover affect air temperature. Forest losses increase diurnal temperature variations and increase mean and maximum air temperatures. Tropical deforestation increases surface albedo, but also reduces evapotranspiration, and this may offset the air cooling due to increased albedo. High winter snow in deforested boreal areas could lead to climate cooling due to the high snow albedo. They compared the effects of variations of forest cover, from 2003 to 2012, on biophysical warming to the biogeochemical emissions of carbon dioxide from land-use change. They found that the changes in forest cover produced a mean warming corresponding to 18% of the carbon dioxide emissions. Changes in forest cover affect local climate.
Global satellite data were used by Schultz et al. (2017) who investigated the biophysical effects of deforestation on diurnal asymmetry of surface temperature response. Daytime warming after deforestation was due primarily to differences in absorbed solar radiation and latent heat flux, and was strongest in deforested tropical areas. Nighttime cooling was due to turbulence in forests and release of forest-stored heat; it was strongest in deforested boreal areas where open land is cooler than forests.
Li et al. (2015) felt that repeated satellite observations were preferable to global climate models to determine local cooling and warming effects on a global scale. They used extensive MODIS satellite data to investigate biophysical effects of forests on local land surface temperature, evapotranspiration, and albedo, comparing forests with grasslands. Latitudinal and diurnal features were determined. In general, daytime cooling was evident in most forests, when compared to open land, and was stronger in the tropics than boreal regions. Their results are summarized below:
|
Tropics 20° S to 20° N |
Largest year-long cooling |
|
Little night warming |
|
|
Mid-latitudes 20° N to 50° N |
Annual net cooling |
|
Cooling in summer, moderate warming in winter |
|
|
Greatest night warming region |
|
|
Boreal 50° N to 90° N |
Strong warming in winter, moderate summer cooling |
|
Net annual warming |
Forests in general have lower albedo and absorb more daytime shortwave radiation, which can result in warming. Depending on latitudinal location, evapotranspiration may increase latent heat loss and offset warming. This effect is strongest in tropical forests. Albedo effects increase with latitude, while the effects of evapotranspiration decrease (Li et al., 2015). Betts (2000) identified two opposing forces that determine the effects of boreal forests on climate change: albedo and carbon sequestration. Low albedo would cause positive radiative forcing and warming, which could offset the negative radiative forcing expected from increased carbon sequestration. Some boreal forests might contribute to an increase in global warming, rather than decreasing it. Swann et al. (2010) used a global climate model to estimate the effects of north-expanding ranges of deciduous trees at high altitudes. They modeled the effects of addition of deciduous trees to bare ground at northern latitudes, and found that increased transpiration from the increased forest areas exerted a negative forcing effect that was 1.5 times that of the positive forcing effect of albedo. They also concluded that warming from additional water vapor in air would melt sea ice, resulting in positive forcing by changes in ocean albedo and surface evaporation.
Spracklen et al. (2008) used a global atmospheric model to considered the role of BVOCs in cooling and warming in boreal forests. BVOCs (see Section 4.5) are short-lived and become high cloud condensation nuclei. High clouds reflect incoming shortwave solar radiation. This results in “dimming” (see Section 1.3) that increases photosynthesis and carbon fixation, and creates a cooling effect. They referred to this as a homeostatic cooling effect for cold climates. Unger (2014) proposed that continuing large-scale deforestation for cropland expansion would reduce BVOCs from trees, and that this would result in global climate cooling. Deforestation releases stored carbon to the atmosphere, which causes warming. It also greatly increases surface albedo, which results in cooling. BVOC emissions, mainly isoprene, also promote the formation of ozone and prolong atmospheric residence time for methane. Both ozone and methane are strong greenhouse gases. Deforestation reduces BVOCs, increases release of stored carbon, increases the strength of surface albedo, and reduces ozone formation and methane residence time. Unger concludes that this results in a net global cooling effect.
Tang et al. (2018) conducted a detailed analysis of the effects of forests on temperature in relation to seasons and background climate in Europe. They compared land surface temperatures between forest and adjacent open areas for 48 sites near flux towers and examined the influence of local background temperatures on forest responses. Their general conclusions were that forests in northeast Europe increased air temperature and decreased temperature in other areas. In warm seasons, forest cooling occurred during daytime. In cold seasons, warming occurred at night. The cooling effect of forests was strongest for high background temperatures and lowest at cool temperatures. Background temperatures affected the spatiotemporal distribution of differences in albedo and evapotranspiration. During daytime, forests are likely to cool local temperature through elevated latent heat flux. At night, forests may store heat, resulting in local increased temperature. Over time, differences in soil moisture may affect evapotranspiration. Changes in soil color and wetness may affect albedo. Differences between open land and forest may decrease.
Kirschbaum and McMillan (2018) considered that transpiration rates were affected by biogeophysical factors such as air temperature and water pressure deficits, and by plant factors that included canopy leaf area and stomatal conductance (see Sections 4.6 and 7.9) . They proposed that two opposing forces would affect transpiration rates in future climate: increasing air temperatures will enhance transpiration rates due to increasing vapor pressure deficits; or partial stomatal closure by elevated carbon dioxide will reduce water vapor from leaves, decreasing rates of transpiration and increasing water-use efficiency. Using summary empirical evidence from numerous experiments, they developed simulations for case studies for the twenty-first century for six locations, from tropical to boreal forests, to estimate the effects of increasing air temperature and elevated carbon dioxide on transpiration rates. For most locations, reduction in stomatal conductance caused by carbon dioxide reduced transpiration rates more than future air warming increased it. Temperature increased the length of the growing season and increased transpiration for boreal and temperate forests.
For the past two decades, it has been noticed that there are trends in differences between observed and predicted air temperatures. This has been termed the global atmospheric temperature slowdown. When observed temperatures are subtracted from modeled expected temperatures, a temperature gap is revealed. Temperature does not reflect current carbon dioxide, but follows the change in carbon dioxide over time. Lower than predicted temperatures also indicate lower carbon dioxide than predicted, suggesting a carbon dioxide gap as well. The rationale for the temperature and carbon gaps is that enhanced “global greening” has significantly increased global uptake of carbon dioxide beyond what was predicted, accompanied by evapotranspiration (mostly transpiration) (Leggett and Ball, 2015, 2018).
There is evidence from satellite observations and models for global greening, a slow long-term increase in terrestrial vegetation. On the assumption that it is caused by steadily increasing concentrations of carbon dioxide, it is also sometimes known as the carbon dioxide fertilization effect. Among many papers describing global greening is one by Zhang et al. (2018). Using satellite imaging and models, they proposed that since 1982, global greening has slowed the increase in average global air temperature by approximately 0.09 °C. LAI increase, resulting in a 70% increase in evapotranspiration that offset the warming effects of increased albedo, was determined to be the cause. LAI and evapotranspiration increased in boreal areas, Europe, India, Eurasia, Northern Amazonia, and the Sahel, but not in eastern North America and East Asia. Their major conclusion was that global greening had reduced global land surface warming by 12% during the past 30 years.
Leggett and Ball (2015, 2018) approached an understanding in a similar yet different way. Rather than use LAI as a response surface, they used satellite measurements of global vegetative reflectance, using NDVI (Normalized Difference Vegetation Index), to measure global terrestrial photosynthesis. Close correlation was found between increasing NDVI and the trends of lower-than-modeled temperature (the temperature gap) and carbon dioxide (the carbon dioxide gap). They attributed this to increased evapotranspiration by vegetation. They also included data on ocean heat in their models and concluded that the ocean heat sink was a significant factor.
7.12Summary
This chapter has focused on the methods used to provide the knowledge base for determining the extent of the role of forests in cooling or warming the atmosphere. Seedlings and small trees are useful in controlled experiments with elevated carbon dioxide in various types of chambers, but extrapolation or scaling up of results is not possible. Results from longer-term field chamber and FACE experiments have more relevance, but also lack relation to mature trees in forests. The effects of elevated carbon dioxide on stomatal conductance, transpiration, water-use efficiency, acclimation, and growth and biomass accumulation by young trees, as well as soil nutrient limitations and other factors, were determined in these experiments. Dendrochronology or tree ring analysis allows recreation of past events, using older, more mature trees.
Re-examination of historical forest tree inventory data has provided long-term trends for forests. Indirect methods, such as flux towers, satellite imagery, simulation models, and combinations of methods are required to predict large-scale forest responses to warming and elevated carbon dioxide. Physiological considerations include photosynthesis, evapotranspiration (mostly transpiration), tree longevity, and BVOCs. Physical factors include temperature, albedo, aerosols, and clouds. Results from flux towers, satellite imagery, and models indicate that forest tree type and latitudinal location, season, and time of day are factors that determine how effective forests are in cooling and warming the atmosphere.
Most of what we know about the role of forests in cooling and warming the atmosphere comes from the results of simulation modeling and satellite imagery. From these, it has been concluded that tropical forests are most likely the major source of carbon capture and atmospheric cooling. Boreal forests are more likely to warm the atmosphere. Temperate forests may cool in summer, but this is uncertain.
Cooling and warming are influenced by albedo and transpiration. Low albedo could cause warming; and partial stomatal closure, in response to elevated carbon dioxide, could decrease transpiration and cause warming. Increases in global vegetation (global greening) during the last 30 years has been estimated to have caused a reduction in global temperature and carbon dioxide levels below their model-estimated expected levels, resulting in cooling. Carbon dioxide removal by photosynthesis and resulting increased transpiration are alleged to be the causes.
REFERENCES
Alkama, R. and Cescatti, A. 2016. Biophysical climate impacts of recent changes in global forest cover. Science 351: 600–603.
Arneth, A., Sitch, S., Pongratz, J. et al. 2017. Historical carbon dioxide emissions caused by land-use changes are possibly larger than assumed. Nature Geoscience 10: 79–84. doi: 10.1038/NGEO2882.
Arp, W. J. 1991. Effects of source–sink relations on photosynthetic activity acclimation to elevated CO2. Plant, Cell and Environment 14: 869–875.
Ashraf, M. I., Meng, F.-R., Bourque, C. P.-A. and MacLean, D. A. 2015. A novel modelling approach for predicting forest growth and yield under climate change PLoS One 10: e0132066. doi: 10.1371/journal.pone.132066.
Asshoff, R., Zotz, G. and Korner, C. 2006. Growth and phenology of mature temperate forest trees in elevated CO2. Global Change Biology 12: 848–861. doi: 10.1111/j.1365-2486.01133.x.
Baccini, A., Walker, W., Carvalho, L. et al. 2017. Tropical forests are a net carbon source based on aboveground measurements of gain and loss. Science. doi: 10.1126/scienceaam5962.
Bader, M. K.-F., Leuzinger, S., Keel, S. G. et al. 2013. Central European hardwood trees in high-CO2 future: synthesis of an 8-year forest canopy CO2 enrichment project. Journal of Ecology 101: 1509–1515. doi: 10.1111/1365-2754.12149.
Bala, G., Caldeira, K., Wickett, M. et al. 2007. Combined climate and carbon-cycle effects of large-scale deforestation. Proceedings of the National Academy of Sciences. doi: 10.1073/pnas.0608998104.
Baldocchi, D. D. 2003. Assessing the eddy covariance technique for evaluating carbon dioxide exchange rates of ecosystems: past, present and future. Global Change Biology 9: 1–14.
Baldocchi, D. D. 2014. Measuring fluxes of trace gases and energy between ecosystems and the atmosphere – the state and future of the eddy covariance method. Global Change Biology 20: 3600–3609. doi: 10.1111/gcb.12649.
Ban-Weiss, G. A., Bala, G., Cao, L., Pongratz, J. and Caldeira, K. 2011. Climate forcing and response to idealized changes in surface latent and sensible heat. Environmental Research Letters 6: 034032.
Bazzaz, F. A., Miao, S. L. and Wayne, P. M. 1993. CO2-induced growth enhancements of co-occurring tree species decline at different rates. Oecologia 96: 478–482.
Betts, A. K. and Ball, J. H. 1997. Albedo over the boreal forest. Journal of Geophysical Research 102: 28901–28909.
Betts, R. A. 2000. Offset of the potential carbon sink from boreal forestation by decreases in albedo. Nature 408: 187–190.
Bochenek, Z., Ziolkowski, D., Bartold, M., Orlowska, K. and Ochtra, A. 2018. Monitoring forest diversity and the impact of climate on forest environment using high-resolution satellite images. European Journal of Remote Sensing 51: 166–181. doi: 10.1080/22797254.2017.1414773.
Bonan, G. B. 2008. Forests and climate change: forcings, feedbacks, and the climate benefits of forests. Science 320: 1444–1489.
Bortier, K., DeTemmerman, L. and Ceulemans, R. 2000. Effects of ozone exposure in open-top chambers on poplar (Populus nigra) and beech (Fagus sylvatica): a comparison. Environmental Pollution 109: 509–516.
Bowman, D. M. S., Brienen, R. J. W., Gloor, E., Phillips, O. L. and Prior, L. D. 2013. Detecting trends in tree growth: not so simple. Trends in Plant Science 18: 11–17.
Brienen, R. J. W., Phillips, O. L., Felpausch, T. R. et al. 2015. Long-term decline of the Amazon carbon sink. Nature 519: 344–348. doi: 10.1038/nature14283.
Bugmann, H. and Bigler, C. 2011. Will CO2 fertilization effect in the forests be offset by reduced tree longevity? Oecologia 165: 533–544. doi: 10.1007/s00442-010-1837-4.
Burba, G., Madsen, R. and Feese, K. 2013. Eddy covariance method for CO2 emission measurements in CCUS applications: principles, instrumentation and software. Energy Procedia 40: 329–336.
Burton, A. J. 2014. Final Technical Report for the final phase of the AspenFACE Project. www.osti.gov/biblio/1135783 (accessed 03/04/2018).
Butler, S. M., Melio, J. M., Johnson, J. E. et al. 2102 Soil warming alters nitrogen cycling in a New England forest: implications for ecosystem function and structure. Oecologia 168: 819–828.
Calatayud, V., Cervo, J. and Sanz, M. J. 2007. Foliar, physiological and growth responses of four maple species exposed to ozone. Water, Air and Soil Pollution 185: 239–254 doi: 10.1007/s11270-007-9446-5.
Camarero, J. J., Gazol, A., Galvan, J. D., Sangues-Barreda, G. and Guttiererez, E. 2015. Disparate effects of global-change drivers on mountain conifer forests; warming-induced growth enhancement in young trees vs. CO2 fertilization in old trees in wet sites. Global Change Biology 21: 738–749. doi: 10.1111/gcb.12687.
Campioli, M., Malhi, Y., Vicca, S. et al. 2016. Evaluating the convergence between eddy-covariance and biometric methods for assessing carbon budgets of forests. Nature Communications 7: 13717. doi: 10.1038/ncomms13717.
Cao, l., Bala, G., Caldeira, K., Nemani, R. and Ban-Weiss 2010. Importance of carbon dioxide physical forcing to future climate change. Proceedings of the National Academy of Sciences 107: 9513–9518. www.pnas.org/cgi/doi/10.1073/pnas.0913000107.
Carriero, G., Emiliani, G., Giovannelli, A. et al. 2015. Effects of long-term ambient ozone exposure on biomass and wood traits in poplar treated with ethylenediurea (EDU). Environmental Pollution 206: 575–581. doi: 10.1016/j.envpol.2015.08.014.
Christ, R. 2014. IPCC Fifth Assessment Report: The Role of Forests. IPCC. www.unece.org.
Chung, H., Muraoka, H., Nakamura, M. et al. 2013. Experimental warming studies on tree species and forest ecosystems: A literature review. Plant Research 126: 447–460. doi: 10.1007/s10265-013-0565-3.
Climate Focus. 2015. Forest and land use in the Paris Agreement. www.climatefocus.com.
Cole, C. T., Anderson, J. E., Lindroth, R. L. and Walker, D. M. 2010. Rising concentrations of atmospheric CO2 have increased growth in natural stands of quaking aspen (Populus tremuloides). Global Change Biology 16: 2186–2197. doi: 10.1111/j.1365-2486.2009.02103.x.
Crowther, T. W., Anderson, J. E. and Bradford, M. A. 2015. Tree mapping density at a global scale. Nature 525: 201–205. doi: 10.1038/nature14967.
Davis, D. D. and Skelly, J. M. 1992. Foliar sensitivity of eight eastern hardwood tree species to ozone. Water, Air and Soil Pollution 62: 269–277.
de Dios, V., Mereed, T. E., Ferrio, J. P., Tissue, D. T. and Voltas, J. 2016. Intraspecific variation in juvenile tree growth under elevated CO2 alone or with O3: a meta-analysis. Tree Physiology 36: 682–693. doi: 10.1093/treephys/tpw026.
Doutriaux-Boucher, M., Webb, M. J., Gregory, J. M. and Boucher, O. 2009. Carbon dioxide induced stomatal closure increases radiative forcing via rapid reduction in low cloud. Geophysical Research Letters 36: L02703. doi: 10.1020/2008GK036273.2009.
Drake, J. E., Macdonald, C. A., Tjoelker, M. G. et al. 2016. Short-term carbon cycling responses of a mature eucalypt woodland to gradual stepwise enrichment of atmospheric CO2 concentration. Global Change Biology 22: 380–390. doi: 10.1111/gcb.13109.
Ellison, D., Morris, C. E., Locatelli, B. et al. 2017. Trees, forests and water: Cool insights for a hot world. Global Environmental Change 43: 51–61. doi: 10.1016/j.glovencha.2017.02.0002.
Frank, D. C., Poulter, B., Saurer, M. et al. 2015. Water-use efficiency and transpiration across European forests during the Anthropocene. Nature Climate Change 5 : 579–583. doi: 10.1038/nclimate2614.
Gazol, A., Camarero, J.J., Gutieirrez, E. et al. 2015. Distinct effects of climate warming on populations of silver fir (Abies alba) across Europe. Journal of Biogeography 42: 1150–1162. doi: 10.1111/jbi.12512.
Gerhart, L. M. and Ward, J. K. 2010 Plant responses to low [CO2] of the past. New Phytologist 188: 674–695. doi: 10.1111/j.1469-8137.2010.03441.x.
Gibbard, S., Caldeira, K., Bala, G., Phillips, T. J. and Wickett, M. 2005. Climate effects of global land cover change. Geophysical Research Letters 32: L23705. doi: 10.1029/2005GL0245550.2005.
Gimeno, T. E., McVicar, T. R., O’Grady, A. P., Tissue, D. T. and Ellsworth, D. S. 2018. Elevated CO2 did not affect the hydrological balance of a mature Eucalyptus woodland. Global Change Biology. doi: 10.1111/gcb.14139.
Global Forest Watch. 2015. New satellite data reveal massive tree cover loss in Russia and Canada. www.wri.org/news/2015/04/release-new-satellite-data-reveal-massive-tree-loss-russia-and-canada (accessed 07/03/2018).
Groenendijk, P., van der Sleen, P., Vlam, M. et al. 2015. No evidence for consistent long-term growth stimulation of 13 tropical tree species: results from tree-ring analysis. Global Change Biology 21: (10). https://doi.org/10.1111/gcb.12955.
Grulke, N. E. and Miller, P. R. 1994. Changes in gas exchange characteristics during the life span of giant sequoia: implications for response to current and future concentrations of atmospheric ozone. Tree Physiology 14: 659–668.
Hall, M., Rantfors, M., Slaney, M., Linder, S. and Wallin, G. 2009. Carbon dioxide exchange of buds and developing shoots of boreal Norway spruce exposed to elevated or ambient CO2 concentration and temperature in whole tree chambers. Tree Physiology 29: 467–481. doi: 10.1093/treephys/tpn047.
Hattenschwiler, S. and Korner, C. 2000. Tree seedling responses to in situ CO2 enrichment differ among species and depend on understory light availability. Global Change Biology 6: 213–226.
Haworth, M., Hoshika, Y. and Killi, D. 2016. Has the impact of rising CO2 on plants been exaggerated by meta-analysis of free air CO2 enrichment studies? Frontiers in Plant Science 7: article 1153.
Heagle, A. S., Body, D. E. and Heck, W. W. 1973. An open-top field chamber to assess the impact of air pollution on plants. Journal of Environmental Quality 2: 365–368.
Hickler, T., Smith, B., Prentice, C. et al. 2008. CO2 fertilization in temperate FACE experiments is not representative of boreal and tropical forests. Global Change Biology 14: 1531–1542. doi: 10.1111/j.1365-2486.2008.01598.x.
Holmes, C. D. 2014. Air pollution and forest water use. Nature 507: E1–E2. doi: 10.1038/nature13113.
Hopkinson, C., Chasmer, L., Barr, A. G. et al. 2016. Monitoring boreal forest biomass and carbon storage change by integrating airborne laser scanning, biometry and eddy covariance data. Remote Sensing of the Environment 181: 82–95. doi: 10.1016/jrse2016.04.010.
Hoshika, Y., Pecori, F., Conese, I. et al. 2013. Effects of a three-year exposure to ambient ozone on biomass allocation in poplar using ethylenediurea. Environmental Pollution 189: 299–303.
Iverson, L., Prasad, A. and Matthews, S. 2008. Modeling potential climate change impacts on the trees of the northeastern United States. Mitigation and Adaptation Strategies for Global Change 13: 517–540. doi: 10.1007/s11027-007-9129-y.
Jasechko, S., Sharp, Z. D., Gibson, J. L. et al. 2013. Terrestrial water fluxes dominated by transpiration. Nature 496: 347–350. doi: 10.1038/nature11983.
Karnosky, D., Tallis, M., Darbah, J. and Taylor, G. 2007. Direct effects of elevated CO2 on forest tree productivity. In: Forestry and Climate Change, eds J. Innes, G. Hickey and H. Hoen. Cambridge, MA: CABI Publishing, pp. 136–142.
Keane, K. D. and Manning, W. J. 1988. Effects of ozone and simulated acid rain on birch seedling growth and mycorrhizal associations. Environmental Pollution 52: 55–65.
Keeling, R. 2008. Recording Earth’s vital signs. Science 319: 1771–1772. doi: 1.1126/science.1156761.
Keenan, T. F., Hollinger, D. Y., Bohrer, G. et al. 2013. Increase in forest water-use efficiency as atmospheric carbon dioxide concentrations rise. Nature 499. doi: 10.1038/nature 12291.
Keenan, T. F., Hollinger, D. Y., Bohreer, G. et al. 2014. Reply to Holmes: Comment on ‘Increase in forest water-use efficiency as atmospheric carbon dioxide concentrations rise’ [Nature. 2013] ‘Air pollution and forest water use’ [Nature. 2014]. Nature 507: E2–E3. doi: 10.1038/nature13114.
King, J. S., Kubiske, M. E., Pregitzer, K. S. et al. 2005. Tropospheric O3 compromises net primary production in young stands of trembling aspen, paper birch, and sugar maple in response to atmospheric CO2. New Phytologist 168: 623–636.
Kirschbaum, M. U. F. and Lambie, S. M. 2015. Re-analysis of plant CO2 responses during the exponential growth phase: interactions with light, temperature, nutrients and water availability. Functional Plant Biology 42: 989–1000. doi: 10.1071/FP15103.
Kirschbaum, M. U. F. and McMillan, A. M. S. 2018. Warming and elevated CO2 have opposing influences on transpiration. Which is more important? Current Forestry Reports 4: 51–71. doi: 10.1007/s40725–018-0073-8.
Klein, T., Bader, M.-F., Leuzinger, S. et al. 2016. Growth and carbon relations of mature Picea abies trees under 5 years of free-air CO2 enrichment. Journal of Ecology 104: 1720–1733.
Korner, C. 2017. A matter of tree longevity. Science 355: 130–131. doi: 10.1126/science.aaa/2449.
Kovenock, M. and Swann, A. L. S. 2018. Leaf trait acclimation amplifies simulated climate warming in response to elevated carbon dioxide. Global Biogeochemical Cycles 32. doi: 10.1029/2018GB005883.
Kubiske, M. E., Quinn, V. S., Marquardt, P. E. and Karnosky, D. F. 2007. Effects of elevated CO2 and/or O3 on intra- and interspecific competitive ability of aspen. Plant Biology 9: 342–355. doi: 10.1055/s-2006-924760.
Lamba, S., Hall, M., Rantfors, M. et al. 2017. Physiological acclimation dampens initial effects of elevated temperature and atmospheric CO2 concentration in mature boreal Norway spruce. Plant, Cell and Environment. doi: 10.1111/pce.13097.
Lapola, D. M., Oyama, M. D., Nobre, C. A. and Sampaio, G. 2008. A new world natural map for global change studies. Annals of the Brazilian Academy of Sciences 80: 397–408.
Lawrence, D. M., Thornton, P. M., Oleson, W. and Bonan, G. B. 2006. The partitioning of evapotranspiration, soil evaporation and canopy evaporation in GCM: impacts on land–atmosphere interaction. Journal of Hydrometerology 8. doi: 10.1175/JHM596.1.
Lee, X., Goulden, M. L., Hollinger, D. Y. et al. 2011. Observed increase in local cooling effect of deforestation at higher latitudes. Nature 479: 384–387 doi: 10.1038/nature10588.
Leggett, L. M. W. and Ball, D. A. 2015. Granger causality from changes in level of atmospheric CO2 to global surface temperature and the El Nino–Southern Oscillation, and a candidate mechanism in global photosynthesis. Atmospheric Chemistry and Physics 15: 11571–11592. doi: 10.5194/acp-15-11571-2015.
Leggett, L. M. W. and Ball, D. A. 2018. Evidence that the global transpiration makes a substantial contribution to the global atmospheric temperature slowdown. Theoretical and Applied Climatology doi: 10.1007/s00704-18-2387-7.
Leuzinger, S. and Korner, C. 2007. Water savings in mature deciduous forest trees infer elevated CO2. Global Change Biology 13: 2498–2508. doi: 10.1111/j.1365.2007.01467.x.
Li, P., Feng, Z., Catalayud, V. et al. 2017. A meta-analysis on growth, physiological, and biochemical responses of woody plant species to ground-level ozone highlights the role of plant functional types. Plant, Cell and Environment 40: 2369–2380. doi: 10.1111/pce.13043.
Li, Y., Zhao, M., Motesharrei, S., Mu, Q., Kalnay, E. and Li, S. 2015. Local cooling and warming effects on forests based on satellite observations. Nature Communications. doi: 10.1038/ncomm7603.
Long, S. P. 2012. Virtual special issue (VSI) on mechanisms of plant response to global atmospheric change. Plant, Cell and Environment 35: 1705–1706. doi: 10.1111/j.1365-3040.2012.02589.x.
Luyssaert, S. and Cornelissen, J. H. C. 2018. Forests in flux as climate varies. Nature 556: 35–36.
Lyons, D. A., Arvanitdis, C., Blight, A. J. et al. 2016. There are no whole truths in meta-analyses: all their truths are half-truths. Global Change Biology 22: 968–971. doi: 10.1111/gcb.12989.
Manning, W. J. 2000. Use of protective chemicals to assess the effects of ambient ozone on plants. In: Environmental Pollution and Plant Responses, eds. S. B. Agrawal and M. Agrawal. Boca Raton: Lewis, pp. 247–258.
Manning, W. J. 2005. Establishing a cause and effect relationship for ambient ozone exposure and tree growth in the forest: progress and an experimental approach. Environmental Pollution 137: 443–454. doi: 10/1016/j.envpol.2005.01.031.
Manning, W. J. and Krupa, S. V. 1992. Experimental methodology for studying the effects of ozone on crops and trees. In: Surface Level Ozone Exposures: Effects on Vegetation, Lefohn, ed. A. S. Chelsea. MI: Lewis Publishers, Chapter 4, pp. 93–148.
Manning, W. J., Flagler, R. B. and Frenkel, M. 2003. Assessing plant response to ambient ozone: growth of ozone-sensitive loblolly pine seedlings treated with ethylenediurea or sodium erythorbate. Environmental Pollution 126: 73–81. doi: 10.1016/S0269-7491 (03)00141-6.
Manning, W. J., Paoletti, E., Sandermann, H. Jr. and Ernst, D. 2011. Ethylenediurea (EDU): a research tool for assessment and verification of the effects of ground level ozone on plants under natural conditions. Environmental Pollution 150: 3283–3293. doi: 10.1016/j.envpol.2011.07.005.
Matyssek, R., Bahnweg, G., Ceulemans, R. et al. 2007. Synopsis of the CASIROZ case study: carbon sink strength of Fagus sylvatica L. in a changing environment – experimental risk assessment of mitigation by chronic ozone impact. Plant Biology 9: 163–180. doi: 10.1055/s-2007-964883.
Medlyn, B. E., Duursma, R. A. and Zeppel, J. B. 2011. Forest productivity under climate change: a check-list for evaluating model studies. WIRES Climate Change 2: 332–355.
Nabuurs, G.-J., Lindner, M., Verkerk, P. J. et al. 2013. First signs of carbons sink saturation in European forest biomass. Nature Climate Change. doi: 10.1038/nclimate1853.
NASA. 2000. Measuring vegetation (NDVI and EVI). https://earthobservatory.nasa.gov/Features/MeasuringVegetation (accessed 14/10/2017).
NCAR. 2017. Climate Data Guide FLUXNET. https://climatedataguide.ucar.edu/climate-data/fluxnet (accessed 02/09/2017).
Norby, R. J., Edwards, N. T., Riggs, J. S. et al. 1997. Temperature-controlled open-top chambers for global change research. Global Change Biology 3: 259–267.
Overdieck, D. 2016. Research methods. In: CO2, Temperature and Trees – Experimental Approaches. Ecological Research Monographs. Dordrecht: Springer, Chapter 2.
Pallardy, S. G. 2008. Photosynthesis. In: Physiology of Woody Plants. New York: Academic Press, pp. 107–167.
Peck, S. L. 2000. A tutorial for understanding modeling papers for the nonmodeler. American Entomologist 46: 40–49.
Peng, S.-S., Pioa, S., Zeng, A. et al. 2014. Afforestation in China cools local land surface temperature. Proceedings of the National Academy of Sciences 111: 2915–2919. doi: 10.1073/pnas.1315126111.
Penuelas, J., Rutishauser, T. and Filella, I. 2009. Phenology feedbacks on climate change. Science 324: 887–888. doi: 10. 1126/science.1173004.
Pepin, S. and Korner, C. 2002. Web-FACE: a new canopy free-air CO2 enrichment system for tall trees in mature forests. Oecologia 133: 1–9. doi: 10.1007/s00442-002-1088-3.
Peters, R. L., Groenendijk, P., Vlam, M. and Zuidema, P. A. 2015. Detecting long-term growth trends using tree rings: a critical evaluation of methods. Global Change Biology 21: 2040–2054. doi: 10.111/gcb.2826.
Pye, J. M. 1988. Impact of ozone on the growth and yield of trees: a review. Journal of Environmental Quality 17: 347–360.
Reich, P. B. and Lassoie, J. P. 1985. Influence of low concentrations of ozone on growth biomass partitioning and leaf senescence in young hybrid poplar plants. Environmental Pollution 39: 39–51. doi: 10.1111/j.1461-0248.2008.01172.x.
Reich, P. B., Sendall, K. M., Rice, K. et al. 2015. Geographic range predicts photosynthetic and growth responses to warming in co-occurring tree species. Nature Climate Change. doi: 10.1038/nclimate2497.
Reich, P. B., Sendall, K. M., Stefanski, A. et al. 2016. Boreal and temperate trees show strong acclimation of respiration to warming. Nature. doi: 10.1038/nature17142.
Rey, A. and Jarvis, 1998. Long-term photosynthetic acclimation to increased atmospheric CO2 concentration in young birch (Betula pendula) trees. Tree Physiology 18: 441–450.
Roberntz, P. and Stockfors, J. 1998. Effects of elevated CO2 concentration and nutrition on net photosynthesis, stomatal conductance and needle respiration of field-grown Norway spruce trees. Tree Physiology 18: 233–241.
Rogers, B. M., Solvik, K., Hogg, E. H. et al. 2017. Detecting early warning signals of tree mortality in boreal North America using multiscale satellite data. Global Change Biology. doi: 10.1111/gcb.14107.
Samuelson, L. and Kelly, J. M. 2001. Scaling ozone effects from seedlings to forest trees. New Phytologist 149: 21–41.
Schimel, D., Stephens, B. B. and Fisher, J. 2015. Effect of increasing CO2 on the terrestrial carbon cycle. Proceedings of the National Academy of Sciences 112: 436–441. doi: 10.1073/pnas.1407302112.
Schultz, N. M., Lawrence, P. J. and Lee, X. 2017. Global satellite data highlights the diurnal asymmetry of the surface temperature response to deforestation. Journal of Geophysical Research: Biogeosciences 122: 903–917. doi: 10.1002/2016/jG003653.
Shen, M., Piao, S., Jeong, S.-J. et al. 2015. Evaporative cooling over the Tibetan Plateau induced by vegetation growth. Proceedings of the National Academy of Sciences 112: 9299–9304. doi: 10.1073/pnas.15044418112.
Sigurdsson, B. D., Medhurst, J. L., Wallin, G., Eggertsson, O. and Linder, S. 2013. Growth of mature boreal Norway spruce was not affected by elevated [CO2] and/or air temperature unless nutrient availability was improved. Tree Physiology 33: 1192–1205. doi: 10.1093/treephys/tpt043.
Smith, W. K., Reed, C., Cleveland, C. C. et al. 2015. Large divergence of satellite and Earth system model estimates of global terrestrial CO2 fertilization. Nature Climate Change 6: 306–310. doi: 10.1038/nclimate2879.
Spracklen, D. V., Bonn, B. and Carslaw, R. S. 2008. Boreal forests, aerosols and the impact on clouds and climate. Philosophical Transactions of the Royal Society A 366 : 4613–4626.
Sun, Y., Frankenberg, C., Wood, J. D. et al. 2017. OCO-2 advances photosynthesis observation via solar-induced chlorophyll fluorescence. Science 358 eaam5747. doi: 10.1126/science.aam5747.
Swann, A., Fung, I. Y., Levis, S., Bonan, G. B. and Doney, S. C. 2010. Changes in Arctic vegetation amplify high-latitude warming through the greenhouse effect. Proceedings of the National Academy of Sciences 107: 1295–1300. doi: 20.1073/pnas.0913846107.
Talhelm, A. F., Pregitzer, K. S., Kubiske, M. E. et al. 2014. Elevated carbon dioxide and ozone alter productivity and ecosystem carbon content in northern temperate forests. Global Change Biology 20: 2492–2504. doi: 10.1111/gcb.12564.
Tang, B., Zhao, X. and Zhao, W. 2018. Local effects of forests on temperatures across Europe. Remote Sensing 10. doi: 10.13390/rs10040529.
Tang, Y., Chen, A. and Zhao, S. 2016. Carbon storage and sequestration of urban street trees in Beijing, China. Frontiers in Ecology and Evolution 4: article 53. doi: 10.3389/fevo.2016.00053.
Tjoelker, M. G., Oleksen, J. and Reich, P. B. 1998. Seedlings of five boreal tree species differ in acclimation of net photosynthesis to elevated CO2 and temperature. Tree Physiology 18: 715–726.
Ueyama, M., Iwata, H. and Harazono. 2013. Autumn warming reduces the CO2 sink of a black spruce forest in interior Alaska based on a nine-year eddy covariance measurement. Global Change Biology 20: (4) https://doi.org/10.1111/gcb.12434.
van der Sleen, P., Groenendijk, P., Viam, M. et al. 2014. No growth stimulation of tropical trees by 150 years of CO2 fertilization but water-use efficiency increased. Nature Geoscience 8: 24–28. doi: 10.1038/ngeo2313.
Walberg, E. 2018. Forests in Paris: how trees factor into global climate decisions. Manomet Newsletter. www.manomet.org/publication/forests-in-paris-how-trees-factor-into-global-climate-decisions/ (accessed 08/04/2018).
Warren, J. M., Jensen, A. M., Medlyn, B. E., Norby, R. J. and Tissue, D. T. 2014. Carbon dioxide stimulation of photosynthesis in Liquidambar styraciflua is not sustained during a 12-year field experiment. AoB Plants 7: plu074. doi: 10.1093/aobpla/plu074.
Way, D.A., Oren, R. and Kroner, Y. 2015. The space-time continuum: the effects of elevated CO2 and temperature and the importance of scaling. Plant, Cell and Environment 38: 6. doi: 10.1111/pce.12527.
Wieloch, T., Ehlers, I., Jun, Y. et al. 2018. Intramolecular 13C analysis of tree rings provides multiple plant ecophysiology signals covering decades. Scientific Reports 8: 5048. doi: 10.1038/s41598-018-23422-2.
Wittig, V. E., Ainsworth, E. A., Naidu, S. L., Karnosky, D. F. and Long, S. P. 2009. Quantifying the impact of current and future tropospheric ozone on tree biomass, growth, physiology and biochemistry: a quantitative meta-analysis. Global Change Biology 15: 396–424. doi: 10.1111/j.1365-24586.2008.01774.x.
Zhang, T., Niinemets, U., Sheffield, J. and Lichstein, J. 2018. Shifts in tree functional composition amplify the response of forest biomass to climate. Nature 556: 99–102. doi: 10.1038/nature 26152.
Zhang, Z. 2015. Tree-ring, a key ecological indicator of environment and climate change. Ecological Indicators 51: 107–116. doi: 10.1016/j.ecolind.2014.07.042.