CHAPTER 12
By the mid-nineteenth century, quantifying events and experiences were everywhere for nearly everyone. Statistical and probability information popped up in many parts of daily life, including accurate oceanic navigation, market-based economic activity, and governmental functions, such as city planning and having a sophisticated military organization. Questions of astronomy (i.e., learning the orbits of celestial bodies) as well as those of geodesy (i.e., estimating the size of the earth’s circumference and determining the distance between towns) were informed by reasonably reliable probability calculations. This flood of numeracy meant that people were beginning to interact with a quantitative environment with almost routine frequency. Still, however, the frequent contact with quantifying events did not, by itself, cause people to transform their worldview—but this momentous paradigm shift was just around the corner.
Two related watershed events started the transformation to a quantifying worldview for Everyman. This evolution in worldview was qualitatively different from exposing people to more and more quantitative events, although that had a lot to do with it. Instead, it was the start of a reformed thinking: a new way of seeing the world and one’s place in it. Indeed, our very sense of “self” was transformed. These two momentous events were (1) developments in transportation that made it relatively easy for large numbers of people to travel farther and farther distances from their hometown and (2) the tremendous economic expansion of the time, which led shortly to a full-blown industrial revolution, first in England and then later in America.
Transportation for masses of people was advanced at this time by building suitable road systems to replace muddy horse and cart paths. And, at almost the same time these roads were being built, public passage made a second leap forward with the introduction of powered passenger trains, made possible by the invention of the steam engine. (Rudimentary “trains” did exist before the steam engine was invented, but they were mere carts pulled by horses or oxen, and they could only haul a few people for a short distance.) Finally, good roads and trains were themselves fuel for an economic expansion of huge proportions, unlike anything before in history. With the ability to easily travel outside their hometown, people saw a larger world and thought more and more about their place in it.
In related progress, people’s work, their occupations and labors, underwent a revolution of its own. For the first time, the economy was seen as a cohesive whole rather than the separate enterprises of individuals going about their daily labors. Now, people were part of a larger economic system comprising everyone. Suddenly, there was “the economy,” a phrase meant to suggest collective efforts, regardless of how disparate the elements. As such, it became almost reified, taking on a life of its own—a distinct colossus, if you will. For the first time, scientists and governmental researchers began to systematically study the economy with regularity and purpose, and they did so by employing the new methods of probability and statistics.
Further, the economy had rapidly become integral to social and cultural developments, affecting nearly all public aspects of an individual’s sphere of activity. Now, the separate aspects of an individual’s labors were simply subsumed into the “economic engine” of society. The economy was the steam-powered engine of society itself. The colossus was growing so fast that people could scarcely absorb its happenings into their own lives. It directed their interactions with their environment and gave rise to people’s thinking about it as never before.
At first, the economic expansion began modestly, with distinct but still important events, such as establishing stock markets, and a few novel and practical inventions, such as the washing machine. But then—like the energy released from a steam-powered whistle multiplied a millionfold—it took off. The Industrial Revolution began. Some consider its beginning to be marked by the invention of the steam engine and its greatest impact to have been driving steam-powered railways (Figure 12.1). We will look at this period a bit more—specifically, how it affected our route to quantification—in Chapter 13.
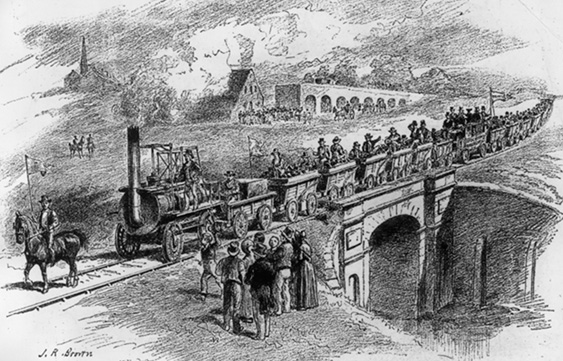
Figure 12.1 Engraving of The Stockton and Darlington Railway, opening day on September 27, 1825
(Source: http://commons.wikimedia.org/wiki/Category:Public_domain)
The Industrial Revolution was more than a plethora of utilitarian inventions. It was consequential in that it began a process of quantitative infusion—a new outlook on the world seeping into the very pores of cognition.
All of these developments had their roots in statistics and probability, as we have seen. Recall a few of the links between advances in society and developments in probability: Newton and Laplace invented a useful calculus that allowed calculations of all kinds, such as determining the weight load for bridges, among countless other applications. Legendre and Gauss independently invented the method of least squares, which was used for determining relationships between geodesic points for accurate oceanic navigation. Then, Gauss offered his much more useful probability density function, which is applicable in research. On a very practical note, Gauss invented the heliotrope, a machine useful for triangulation to determine distances between towns (we saw it in Chapter 9). And, as we learned, Quetelet began to describe with statistical precision l’homme moyen (“the average man”). Babbage invented calculating devices (Difference Engines No. 1 and No. 2 and his analytic computing machine—truly the first computer with a CPU for processing information and a storage area to hold the information). This paved the way for mechanical devices of all sorts, including the steam engine, one of the most important inventions of the nineteenth century.
The important takeaway is that advances in society were not reached independently of mathematical advances; rather, they happened because of these mathematical accomplishments.
The fact that these inventions rapidly became a part of everyday life for nearly all people means that individuals were interacting with them routinely and without any unusual reaction. To an ever-increasing degree, people saw their lives as defined by numbers. Viewing ordinary events as wholly random and unpredictable was a fading perspective. The sense of a quantified worldview had not yet fully set in, but it was filtering into the public’s mindset, rapidly and inexorably.
Hence, our story of how we came to have a quantified worldview and how that fundamentally changed us is not yet complete, but we are on well on our way. For the first time since we began this journey with Isaac Newton and Dr. Johnson, the worldview is truly changing.
* * * * * *
Most readers are aware that Darwin’s 1859 book On the Origin of Species was revolutionary in thought and upset social and cultural mores of the mid-eighteenth century across the globe. In the United States—at the time a country of strong Puritan prudence, as we have already discussed—the book’s impact was perhaps most widely realized through the 1960 Stanley Kramer film Inherit the Wind, a fictionalized Hollywood account of a popular play of the same name. In the movie, the actor Spencer Tracy portrays the defense lawyer for the high-school biology teacher John T. Scopes, who (in real life) was convicted in 1925 of breaking a Tennessee state law by teaching Darwin’s theory of evolution, which states that humankind evolved from lower animals—most directly from the primates. The incident was infamously called the “Scopes Monkey Trial,” and Tracy’s portrayal of Scopes’ lawyer, Clarence Darrow (completed with tussled white hair and a rumpled shirt), is iconic for his impassioned defense speeches.
An opening note to both the play and the movie cautions the audience that this recounting of the trial is done with “literary license” and is not intended to be a “historical documentation” of what really happened. (In fact, later historians and many others have identified the movie’s many inaccuracies, exaggerations, and omissions.) But this cautionary note to audiences was largely ignored. In the public’s mind, the image was set of a man persecuted for teaching the then-modern theory of evolution. It got people arguing about religion’s role in forming one’s view of life, something unusual at the time. I clearly remember these intense discussions because, at the time the movie came out, I was still in high school, and I remember some of them taking place during my high-school biology class!
Darwin’s thesis was indeed well known throughout the United States and beyond, and Darwin is a central player in the story of quantification. Readers will recall that, in Chapter 3, I discussed how observation has played an inventive role in scientific inquiry and that it is the starting point of the journey to quantification. I cited Darwin reporting his findings as an example of this kind of observation. Today, his observational methods are loosely classed as “naturalistic inquiry.”
Darwin justified his theory solely by intuition, relying upon observation as his only scientific tool. In his investigations, he did not employ an empirical methodology, although such was well developed by his time, nor did he engage in any mathematical reasoning, despite probability theory being available to him. He simply observed a natural phenomenon and drew his conclusions.
Modern scholarship is growing increasingly suspicious of Darwin’s authenticity. He is questioned on three fronts. First, he is faulted for his logic on evolutionary development. One critic meticulously identified numerous technical shortcomings in Darwin’s work on evolutionary biology and wrote that he was “skeptical of claims for the ability of random mutation and natural selection to account for the complexity of life” (Gould 2002, 144). A second criticism of Darwin is that his claim of having originated the theory of evolution is easily refuted because, even at the time of his writings, there were numerous documented and well-known forerunners (see Thompson 1981). And the third, and perhaps most serious charge of all, is that Darwin liberally plagiarized several earlier writers on evolution, especially his own grandfather, Erasmus, from whom he “may have borrowed” (Darwin’s own words) many sentences and even whole paragraphs (Bergman 2002). Much of this lack of scholarship was discovered and widely discussed during Darwin’s lifetime, and his scientific contemporaries were exasperated by the fact that his writings included almost no references or attributions.
Still, with wider audiences outside of academic circles, Darwin was popular, and he made much of his livelihood from public speaking about the theory of evolution and his travels to exotic lands. It is almost impossible to overstate his influence for the next one hundred years or more on communal thinking about the origins of humankind. In fact, he is one of the most broadly influential persons of modern time.
An interesting aside is that Darwin’s fame as inventor of the theory of evolution follows a storied pattern of false attribution, wherein scientific discoveries are often credited to a person who is not the actual inventor or discoverer. This is sometimes called “Stigler’s law of eponymy,” after the University of Chicago statistics professor Stephen Stigler (1980), who cites many examples, including Halley’s comet, Hubble’s law, and even the Pythagorean theorem.
Now, in our story, Darwin again serves as an illustration, but this time showing the broadening impact of quantitative thinking on the discipline of sociology. Darwin is following (by nearly a hundred years) the introduction of probability theory into sociology by Tobias Mayer, as well as Quetelet’s and Comte’s “social physics.” Moving quantification into social disciplines is indeed an important part of the quantification story, and, despite his obviously weak scholarship, Darwin’s influence is undeniable in bringing to public awareness the notion of employing scientific inquiry in sociology. By his monumental influence, quantification was moved from being restricted to the physical sciences into the social sciences of human traits and behaviors. The early work of Laplace and Quetelet set the stage for its introduction, but the enormous influence of Darwin made the move complete. Hence, obliquely but importantly, quantification was advanced by Darwin.
This is also the point in our story at which “truth” comes in. We see at this time that the facts of creation are being questioned with the new theory of evolution. But the material significance of such questioning is not in learning new information about humankind’s evolutionary development. Rather, its real meaning lies in the stirrings in our own minds for what constitutes reality as ontological truth. That is, people now began asking, “What is truth?”
With this step in the measuring of uncertainty—that is, quantification—society was beginning to redefine itself. This was a momentous turn, for sure. The worldview of individuals (and collectively, the populace) was thus inclined to being transformed at this time.
* * * * * *
Darwin also plays into our story in yet another way: through his contact with a childhood friend who was also a relative, his half-cousin Francis Galton. Darwin and Galton shared the same grandfather, Erasmus Darwin. The son of Erasmus’s first wife was Charles Darwin’s father. Galton’s mother (Violetta Darwin) was the daughter of Erasmus Darwin by his second wife. Hence, Charles Darwin and Francis Galton were blood relatives. And, as is frequently observed in their photographs, they were rather alike in physical appearance, too.
While Sir Francis Galton was not as influential across a broad population as was Darwin, he was decidedly more consequential in quantitative developments. Certainly, he was the superior scholar and more careful researcher; he was far more productive than his relative.
The scope and quantity of Galton’s accomplishments are almost unbelievable. In brief, he worked primarily in research on intelligence and heritability, where he left a legacy of monumental achievement. Not only did he develop several theories about intelligence, most of which were later verified, he was also the first to employ probability and statistics in their exploration. He was one of the first to examine races and cultures in legitimate scientific investigation, giving rise to ethnography. He also founded psychometrics (the science of measuring mental abilities) as a distinct field of study.
In many of his investigations, he invented new and novel methodologies. For example, he discovered “reversion to the mean,” evolving it into “regression to the mean.” This work led to his inventing “co-relations” as a predecessor to the notion of correlation. He is also responsible for a plethora of meaningful terms in statistics and probability theory, including percentile and various offshoots such as quartile, decile, and ogive. He even worked on fingerprints as a new tool for personal identification, which would be useful in criminology and elsewhere.
He had a feverishly inventive imagination. And, obviously, Galton was an incredibly hard worker, who (you may imagine) would echo Poisson’s comment that “life is work.”
He documented his work in more than 340 scholarly publications, a simply astounding rate of production. His best-known work is Hereditary Genius: An Inquiry into Its Laws and Consequences (Galton 1869). This is the first scholarly study of genius and greatness; it includes Galton’s thoughts on several of his aforementioned studies. The book came relatively early in his career, and the ideas are often immaturely developed, but he would more fully develop many of his ideas in later publications. Several of his papers are of seminal importance to particular topics.
Surprisingly, despite his skill in mathematician, he was not interested in complex mathematics; rather, he focused on practical applications of statistics and probability and employed only simple mathematics in his publications. He almost never included the higher-level mathematics (such as calculus) so often used by his predecessors.
Galton was born in 1822 to a wealthy family living near Birmingham, England. He showed signs of high intellectual ability at an early age, and, by age six, he reportedly knew most of the Iliad and the Odyssey by heart. At school, he was allowed to devise his own curriculum, deciding for himself what books to read and what subjects to study—an unusual freedom at the time. His father wanted him to pursue medicine and become a doctor. During his first program at Birmingham General Hospital and then King’s College, London, he did study medicine, but at Cambridge he grew interested in mathematics and dropped medicine to focus on mathematics and probability theory.
While Galton was still a young man, his father died, leaving him a substantial inheritance. With financial means at his disposal, he began to travel. True to his nature, he was not content to merely sightsee; he used this time to do original work in anthropology and meteorology.
One early trip was to the Middle East and then to southern Africa, where he studied the Bushmen of the Kalahari Desert, which is the largest desert in the world, covering parts of present-day South Africa and neighboring Botswana and Namibia. His study of the Bushmen is an example of early ethnographic research. In particular, he made varying measurements of their physical characteristics and plotted these in a manner similar to the one Quetelet used.
The Bushmen consist of a loose collection of tribes who live simple, peaceful lives in an incredibly hostile environment, following ancient customs and habits. For example, they use broken ostrich egg shells to store rainwater for drinking and are known for going long periods without any water at all. They are nomadic, ranging across the Kalahari region, have no writing, and speak a remarkably complex language made up mostly of distinct clicking sounds that outsiders seem largely incapable of copying.
Their life and customs have been documented in films and books. Readers may recall the movie The Gods Must Be Crazy, a 1980 South African comedy about the Bushmen, one of whom has a funny adventure when he sees an empty Coke bottle fall from the sky (actually, it fell from a plane that was obscured from view by the clouds). More serious study was given by Sir Laurens van der Post—an Afrikaner author, war hero, political adviser to British heads of government, humanitarian, conservationist, and later member of Virginia Woolf’s Bloomsbury Group—in The Lost World of the Kalahari (Van der Post 1958). The book is a wonderful read that takes you on his intense expedition into what was then an almost unexplored region of southern Africa to meet the fascinating Bushmen. The book is—not incidentally—a first-rate work of sociology; and, I might add, exceptionally well written.
Galton’s trips were made in a time ripe for explorers (although the Golden Age of the Explorers was still fifty years off), and his adventures, along with Darwin’s parallel journeys, caught the public’s imagination. Both men gave lectures that were popularly attended. Galton included ethnographic scholarship in his talks, bringing maps and elaborate descriptions of customs and cultures of the native peoples he encountered.
True to his personality and professional interests, he documented these observations in several books, one of which proffered advice to would-be explorers and had the wonderfully interesting title of The Art of Travel: Or, Shifts and Contrivances Available in Wild Countries (Galton 1855). As his travel experiences increased, Galton added information to the book and published subsequent editions. The fifth edition was the most famous and is still in print. Some topics in the table of contents include “Fords and bridges,” “Game, other means of capturing,” and the curious headings “Savages, management of” and “Hostilities.” Figure 12.2 shows a woodcut from the cover which depicts Galton fording a river by hanging onto a horse’s tail. Another African explorer, Samuel Baker, took exception to Galton’s method with this entrancing critique:
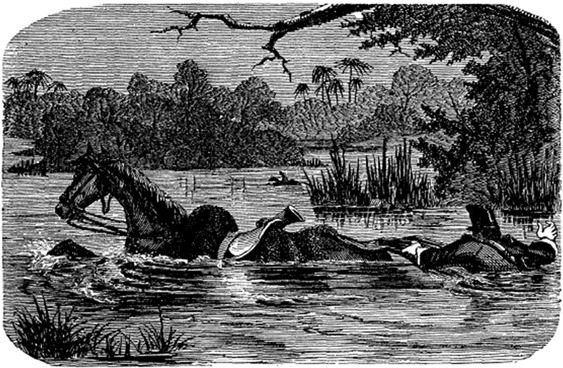
Figure 12.2 Woodcut on cover of Galton’s The Art of Travel
(Source: from, F. Galton, The Art of Travel: Or, Shifts and Contrivances Available in Wild Countries)
In that very charming and useful book by Mr. Francis Galton, The Art of Travel, advice is given for crossing a deep river by holding to the tail of the swimming horse. In this I cannot agree; the safety of the man is much endangered by the heels of the horse, and his security depends upon the length of the animal’s tail. In rivers abounding in crocodiles, which generally follow an animal before they seize, the man hanging on to the tail of the horse is a most alluring bait, and he would certainly be taken, should one of these horrible monsters be attracted to the party. (quoted in Galton Institute 2017)
For his adventurous scientific exploits, Galton was awarded a gold medal from the Royal Geographical Society, an honor that piqued Darwin because he was not similarly recognized. At the time, the Royal Geographical Society had only recently been formalized, being the outgrowth of a dining club in London where members held informal dinner debates to share experiences of their journeys. Like Galton, most of the group’s members were learned men with scholarly achievements, and they emphasized that their adventures were not merely travels to far-off lands but an opportunity to learn about new cultures and geographies. This was quite novel and forward-looking at the time, and it gave a beginning to ethnographic research. The Royal Geographical Society remains one of the most famous learned societies for advancing scientific adventures. We’ll encounter this noteworthy society again in Chapter 15 when I discuss Shackleton and the Golden Age of the Explorers.
Galton’s interest in ethnographic research led to another curious development of his: fingerprinting and the use of fingerprints for positive identification. He was not the first to suggest looking at fingerprints in police work, but he was an early researcher on the topic. He was among the first to address fingerprinting as a serious field of study. He collected many thousands of them, and, as original work, he engaged probability theory to demonstrate the uniqueness of the individual parts of a fingerprint, including devising a method for deciphering a blurred fingerprint. This groundbreaking work provided law enforcement with a rational basis for their use in identifying individuals.
True to his detailed nature, Galton cataloged his more than 5,000 fingerprint samples by their minute parts, which led him to develop a classification system. His system remains the basis of how fingerprints are cataloged today. His publications on the topic are among the first ever written, and on the cover of one of his works is a picture of his own fingerprints and palm prints.
In his academic study of fingerprints, Galton employed probability in a field where no one else had previously thought to do so. Quantification was indeed advancing in unexpected ways.
* * * * * *
I have already mentioned Galton’s first major work, Hereditary Genius, and now we look at this work more carefully. It is one of the most renowned books of the nineteenth century. The ideas that Galton put forth in it—about intelligence and about heredity and its possible effect on human behavior—are hugely influential still today. Nearly all work in the field of behavioral genetics and substantial inroads into today’s research on many forms of cancer directly stem from it. His innumerable contributions to this early study of intelligence are carefully recounted in a 2002 book by the Galton scholar Arthur Jensen (himself a man of astounding intellect—on par with his subject). Nor is Jensen the only one to extol Galton’s many accomplishments. His friend and early biographer, Karl Pearson (whom we’ll see again in Chapter 13), describes Galton and his work in almost adoring terms. Clearly, Galton was an extraordinary individual.
Galton was particularly interested in studying variation in social phenomena and human characteristics, and he intended to further the work of Quetelet, especially in sociology. He thought that variability in human features (both physical and cognitive) could be best explored from the perspective of the normal distribution. Remember, back then it was still called the “law of error,” and this phrasing figured prominently in Galton’s thinking. In a departure from the ideas of Laplace and Quetelet, who used the mean value for certain human characteristics because it represented what was average or “normal.” Galton thought that the key to understanding human behavior lay in studying deviations from the mean.
To do this, he first needed to map a given human physical characteristic, like height or eye color, or mental ability, like a certain amount of short-term memory, on a normal distribution. He began his investigations by considering whether the ability was present in a particular individual. Recall, this is a binomial: yes or no. So, Galton wanted to examine a distribution of this binomial for many individuals. Of course, he studied the pioneering work of Gauss, who showed that the binomial expansion, by the central limit theorem, eventuates to a normal distribution. But Galton wanted to see it in actuality. Recall that Gauss’s proof was done theoretically with calculus and only existed on paper. Galton wanted to demonstrate it practically.
We saw earlier in Chapter 7, in following the work of Quetelet for specifying a predictable distribution, that Galton thought Quetelet was onto something important. One famous example of this in Hereditary Genius is his application of it to measuring intelligence. Galton glowingly described Quetelet’s system with its measurements of the heights of conscripts and reasoned that it must also apply to intelligence and IQ measurements. He said,
Now, if this be the case with stature, then it will be true as regards every other physical feature—as circumference of head, size of brain, weight of grey matter, number of brain fibres, &c.; and thence, by a step on which no physiologist will hesitate, as regards mental capacity. This is what I am driving at; that analogy clearly shows there must be a fairly constant average mental capacity in the inhabitants of the British Isles, and that the deviations from that average—upwards towards genius, and downwards towards stupidity—must follow the law that governs deviations from all true averages. (Galton 1869, 31–2)
This was quite a remarkable statement, even for the time—and one wholly unsupported by empirical evidence for this variable. So, for his experimentation, he invented a “machine” (as it was thusly called, though it looked more like a board game) named “Galton’s bean machine,” although in most of his writings Galton called it a “quincunx.” As a noun, “quincunx” is an arrangement of five things in a square or rectangle, with one at each corner and one in the middle. The next two figures (Figures 12.3 and 12.4) illustrate Galton’s bean machine. The first, Figure 12.3, shows the original drawings of several versions of his machine, although he probably built only the first version.
Figure 12.3 Galton’s bean machine: (a) the quincunx, (b) the double quincunx, (c) the convergence quincunx
(Source: from F. Galton, Hereditary Genius: An Inquiry into its Laws and Consequences)
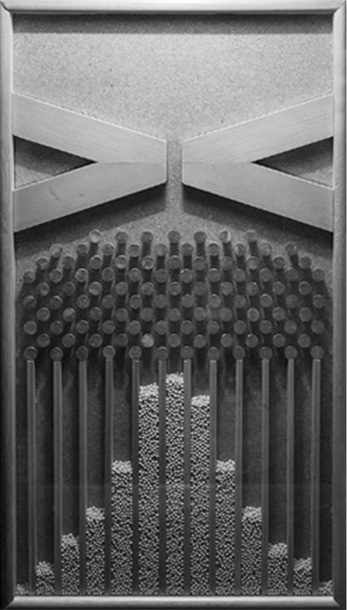
Figure 12.4 Working model of Galton’s bean machine, “the quincunx”
(Source: http://commons.wikimedia.org/wiki/Category:Public_domain)
Far beyond just a clever invention, the notion of making a working model to test his ideas is still considered revolutionary today. The respected statistics historian Stigler claims, “Galton’s quincunx was a brilliant conception” and, further, that “it is simply one of the greatest mental experiments in the history of science” (Stigler 1989, 74).
The second figure (Figure 12.4) shows a working model of Galton’s bean machine and so makes it easier to understand how it works. In the quincunx, one drops balls or beans at the top of the board, one at a time. A ball rolls through a narrow chute and into a field of randomly placed pins. As in a modern-day pinball machine, the ball bounces back and forth randomly among the pins until it exits at the bottom, falling into one or another channel (there are about fifteen channels). Any single ball could roll into any channel, thus demonstrating the random nature of an independent trial in an experiment. The several balls dropped into the machine are like many coin tosses or many independent trials of any experiment. In the same manner as Bayes’s early experiments with billiard balls rolling to the left or right of a diagram (see Chapter 6, Figure 6.1), the balls in Galton’s machine represent a probability distribution of k successes in n trials.
As we can imagine from viewing the working model (Figure 12.4), after a sufficient number of balls are rolled (trials), the quantities in all the columns assume a Gaussian distribution (the bell-shaped curve). If one were to repeat the whole process (say, the next day), the same bell-shaped distribution would be observed, true to the dictates of the central limit theorem. Hence, whereas Bayes, and then more formally Gauss, provided a calculus proof for the central limit theorem, Galton arranged a physical demonstration of it. Very clever!
Now, with validating evidence in hand that the binomial does indeed represent the normal distribution, as Gauss proved mathematically, Galton devised a novel way to use this information. Remember, he was not interested in identifying the mean of a distribution but in studying its variability. Hence, he turned around the customary interpretation, explaining, “we may work backwards [italics in original], and, from the relative frequency of occurrence of various magnitudes, derive a knowledge of the true relative value of those magnitudes, expressed in units of probable error” (Galton 1875, 37–8). In other words, the normal curve is usually interpreted as yielding data on the most common or prevalent characteristic, as shown in the mean. Galton was interested in using the normal curve to identify the so-called errors, or deviations from the mean. He wanted to express those deviations in terms of their distance from the mean (their magnitude).
To do this, he defined an upper limit for a curve, something he called an “ogive.” An ogive is a curved shape that arcs to a point, like the diagonal arch in Gothic architecture or the part of a bullet that is tapered near its point. When plotting a human characteristic (e.g., short-term memory), he labeled it on the horizontal axis (x-axis) in terms of probable error (i.e., “How likely is it to be above or below the mean?”) and on the vertical axis (y-axis) as percentage in the population, from 1 to 99, or the probability from 0 to 1. When the goal is to measure a particular characteristic for an individual, by Galton’s arrangement, one could read it off the ogive’s curve the percentile for the individual. For example, if the characteristic of interest is height, then knowing that an individual is a certain height, their percentile for height could be determined by just reading the percentile value off the ogive. By this, Galton invented percentiles.
Early in his research, Galton also—and significantly—applied this idea to examining mental abilities rather than just physical features. (At the time, all mental abilities were simply lumped together as “intelligence”). He focused his work on exploring the variable of intelligence in people by taking mental measures with all manner of purpose-built, simple contrivances (such as looking down a row of playing cards for assessing depth perception). He set up an “Anthropometric Laboratory” where he collected many thousands of samples from people. Soon, he began to sort them by crossmatching categories, such as country of origin, sex, race, ethnic heritage, and more. He made all kinds of comparisons between categories, highlighting especially the differences. He noted that one sex or race or country of origin would be higher or lower than another on the variable of intelligence. He was not the first to make these classifications or comparisons, but he was the most well-known researcher to do so and was probably the first to engage probability theory, such as percentiles, for the comparisons. In the temper of that time, such classifying and labeling of individuals was neither uncommon nor considered illegitimate.
In 1884, Queen Victoria proudly supported a special and highly publicized conference, the International Health Exhibition, designed to show the monarch’s concern for the health and general welfare of her subjects. At it, Galton set up his Anthropometric Laboratory, where individuals from all walks of life could come and be tested for intelligence and other physical characteristics, such as depth perception and hearing. Four million people attended the exhibition, and his display was immensely popular. Figure 12.5 shows a photograph of Galton’s Anthropometric Laboratory at the exhibition. Afterwards, he rebuilt his laboratory in Cambridge, where he tested more than 17,000 individuals during the 1880s and 1890s, charging them fourpence each for the first set of meaurements, and threepence thereafter for any subsequent measurements (Galton 1885).
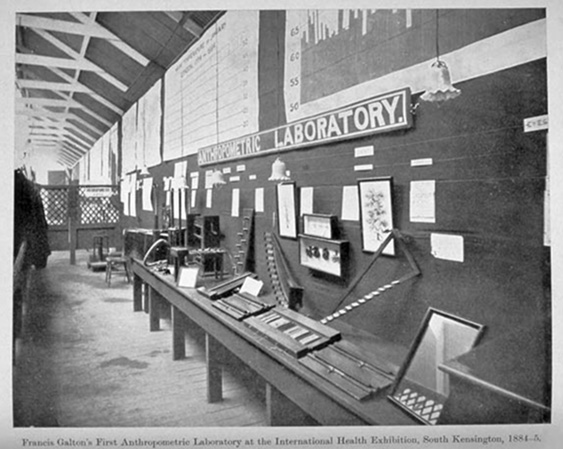
Figure 12.5 Galton’s Anthropometric Laboratory
(Source: from Karl Pearson, The Life, Letters and Labours of Francis Galton)
Then, Galton carried the idea even further. He now wanted to explore how intelligence transfers from one generation to the next: heritability. Following the contemporaneous experiments of the Austrian monk Gregor Mendel, who was experimenting with the genetic tracing of generations of pea plants, Galton turned to looking at heredity as the sole and direct cause of whatever human ability he mapped, such as depth perception or short-term memory.
Most famously (or, infamously), Galton’s mapping of intelligence focused on the differences between his categories of classification. From there, it was only a small step to suppose that humankind could be “improved” by selective mating of humans with the most desirable heritable characteristics. This was his groundbreaking work in founding “eugenics”—a term he probably invented—and the eugenics movement. Initially, Galton meant the term to describe his so-called errors in his observations of intelligence, but its meaning quickly evolved into suggesting improvement of intelligence by selective breeding, sort of like Darwin’s notion for natural selection, only here done not in nature but with humans.
The idea was not controversial at the time, and Galton was certainly not alone in his belief. Others who strongly supported eugenics included Teddy Roosevelt (who wrote a grisly letter about its use to improve humankind), Winston Churchill, George Bernard Shaw, Francis Crick (winner of the 1962 Nobel Prize for discovering DNA), Helen Keller (who, although blind and deaf, was an enthusiastic supporter and called for physicians to be “juries for defective babies”), and Alexander Graham Bell (who served as president of the Second International Congress of Eugenics and chairman of the board of scientific advisers to the Eugenics Record Office). And these leaders had many followers in the movement.
Moreover, the notion for selective breeding of humans was hardly original to Galton. Scholars have traced its origins to ancient Greece, as well as several other countries. Even Plato suggested selective breeding of humans as early as 400 bce. Still, Galton was eugenics’ most prominent advocate during the nineteenth century, and his name is still associated with it today. As we saw from the list of notables above, the eugenics movement was widely accepted across the globe and remained popular long after Galton. It was not until between the world wars, when the Nazis in Europe adopted the idea as rationale for their reign of terror, that the eugenics movement lost advocates and the term assumed a negative connotation. As Nazi atrocities became known, people everywhere abandoned the idea. As example, the journal Eugenics Quarterly became Social Biology and changed its focus entirely to reflect a more informed scholarship.
One Galton scholar informs us that there were two sides to the man, each expressed in a different period of his life. For most of his life and career, Galton was a man of “extraordinary curiosity, inventiveness, and investigative zeal,” but his later years were marred by his enthusiasm for eugenics (Jensen 2002, 145). Jensen argues that we should recognize Galton’s tremendous achievements in the first period but reject the flawed perspective of the second.
Today, the very idea of eugenics is (correctly) considered racist. Regardless of his early advocacy for the eugenics movement, Galton’s work in heritability has led to modern-day studies in genetic biology. Of course, today’s research is not racist, despite its focus on the role of genes in our very composition and functioning. Such work is important in medicine (e.g., much of cancer research is in genetic biology) and elsewhere—work carried on by thousands of scientists, from every background and belief, worldwide.
When offering explanations for his findings, Galton used the phrase “nature and nurture.” He did not invent the alliterative expression, but he did bring it into common use, and it remains associated with him. Even today, “nature versus nurture” is a common expression.
For our interest in how quantification advanced to the general populace, Galton was decidedly important in broadening probability studies. For the most part, he sought to bring a broader view of the normal distribution to social interests and to apply probability to new areas of inquiry, such as intelligence and heritability. He believed that statistics could have a broad impact across nearly all societal studies. Later, such studies assumed the name “psychology.”
He loved the discipline, charmingly saying:
It is difficult to understand why statisticians commonly limit their inquiries to Averages, and do not revel in more comprehensive views. Their souls seem as dull to the charm of variety as that of the native of one of our flat English counties, whose retrospect of Switzerland was that, if its mountains could be thrown into its lakes, two nuisances would be got rid of at once. An Average is but a solitary fact, whereas if a single other fact be added to it, an entire Normal Scheme, which nearly corresponds to the observed one, starts potentially into existence. (Galton 1907, 62–3)
This quote is now rather famous, for both its wit and its insight.
* * * * * *
Finally—for the point of advancing the story of quantification, especially as it moves to a broader audience—I will briefly explain some of Galton’s achievements which were merely mentioned earlier in the chapter. These include (1) his discovery of regression to the mean, (2) his invention of statistical correlation, (3) the founding of psychometrics (although some prefer to credit Sir Ronald Fisher with this—we meet him in Chapter 13), and (4) his formation of the construct of intelligence.
To study the psychological phenomena that fascinated him, Galton moved his Anthropometric Laboratory from its temporary locale at the International Health Exhibition in London to a more permanent facility. He intentionally patterned the rooms with a layout like that of hard-science laboratories. Over the next few years, he brought many thousands of people to his laboratory, where he took all kinds of physical and psychological measurements. Among Londoners, it was a popular spot, and being invited there was quite the novel experience.
Galton’s discovery of regression to the mean came from studies he did in this Anthropometric Laboratory. Working from the samples of measured physical characteristics that he collected and then plotted in various ways, Galton noted a phenomenon that, at first blush, seems ordinary but actually is fraught with statistical complication. He observed that parents usually produce children who are closer in height to the average than they are. In an important 1886 paper titled “Family Likeness in Stature,” he wrote:
It appears from these experiments that offspring did not tend to resemble their parent seeds in size, but to be always more mediocre than they—to be smaller than the parents, if the parents were large; to be larger than the parents, if the parents were very small … The experiments showed further that the mean filial regression toward mediocrity was directly proportional to the parental deviation from it. (Galton 1886, 42)
Stated more clearly, Galton found that adult children’s height tends to be somewhat closer to a mean height than to their parents’ heights: Tall parents often have children somewhat shorter than themselves, and vice versa for short parents. Remember, this was in a day when parents and their offspring likely had roughly the same nutrition throughout their lives. He called the phenomenon “reversion to the mean.” He repeated this point in several others of his publications.
In a paper that became one of his most famous—“Typical Laws of Heredity” (Galton 1877)—he saw this phenomenon as a mathematical problem, and he devised a simple numerical adjustment to the differing heights of the sexes (for both fathers and mothers as well as for sons and daughters) to standardize them and thereby allow for meaningful comparisons. He then plotted these standardized heights and observed the reversion to the mean phenomenon. He concluded that there are two components to height (as summarized in Gorroochurn 2016a, 199):
1.A first component that is unusually extreme and is expected to remain extreme
2.A second component that is not extreme and is expected to remain near the center of the distribution
Galton then went further in his reasoning, this time supplementing it with his familiarity with the central limit theorem. He realized that the phenomenon of characteristics following generations was extant in other variables beyond height. In fact, the same data trend could be observed in most variables, so long as the variable conforms to some statistical assumptions. At this point, he concluded that reversion was not only symmetric but also not limited to inherited characteristics.
His “reversion” was actually an application of the bivariate normal distribution. With this revelation, he changed the name of the phenomenon to regression to the mean, which is the term we use today. Figure 12.6 depicts Galton’s reversion bivariate normal distribution plot of median heights of adult children to parents.
Figure 12.6 Galton’s “reversion” bivariate normal distribution plot of median heights of adult children to parents
(Source: from F. Galton (1886). Regression toward mediocrity in hereditary stature. The Journal of the Anthropological Institute of Great Britain and Ireland, 15, Plate X after 248)
From these mechanisms, he realized that his observations were not limited to the few cases he studied. His sample comprised 205 families, with parents and adult children. Rather, he knew they could be extrapolated to all families whose genetic characteristics were similar to his sample. In addition, he noted that the height relationship did not always follow directly from one generation to the next but sometimes skipped a generation. That is, one could observe the phenomenon better when looking across generations, as from grandparents to adult grandchildren. With this realization, Galton invented the genetic construct of “atavism”—the reappearance in an individual of characteristics of some remote ancestor that have been absent in intervening generations.
Looking deeper into his bivariate normal distribution plot of median heights of adult children to parents, he continued his reasoning, and discovered a “co-relation.” In what is now a well-known quote, he said,
Two variable organs are said to be co-related when the variation of the one is accompanied on the average by more or less variation on the other, and in the same direction. (Galton 1889a, quoted in Gorroochurn 2016a, 206)
Today, such relationships between phenomena (or “variables,” in the language of researchers) seem obvious, but, in Galton’s time, this had not been systematically studied. He noted that the term “co-relation” was close in sound and implication to concepts in heritability, so he changed it to “correlation,” as we call it today. Galton’s statistical exploration was thus a direct evolutionary line from “reversion” to “regression” and then from “co-relation” to “correlation.”
To be clear to those with a technical research perspective, Galton discovered the concept of a correlational relationship and not a true statistical correlation with concomitant mathematical support. The mathematical coefficient of correlation (r) had not yet been invented, although we will see in Chapter 13 that this important piece was soon provided by his friend and colleague Karl Pearson. Important, too, is the fact that Galton almost immediately realized that his correlational relationship does not, ipso facto, imply causation. We know this everywhere today as “correlation is not causation.”
He reached his conclusion mostly by intuition, providing only the simplest of mathematical underpinnings. Nonetheless, Galton’s intuition was spot on, because later researchers confirmed his conclusions by supplying his missing mathematics. His omission of sophisticated mathematics to his discoveries is surprising, because he was trained at Cambridge in mathematics and was certainly capable of handling its complexities.
His understanding of the fact of correlational relationships without causation is what gives depth to his discovery. And, although this is seen by today’s researchers as obvious, it was not so wholeheartedly accepted at first. At the time, Galton’s notion of correlation was taken by careless researchers as causal and applied almost everywhere: to anthropometric measurements, crime, poverty, alcoholism, and more. Some were all too eager to also apply it to Darwin’s weak observations, hoping to supply a semblance of proof for Darwin’s theory that he himself did not.
Galton warned against this misinterpretation of his work on correlation and was supported by another influential contemporary evolutionary biologist and founder of biometry, Raphael Weldon. Weldon was a strong admirer of Galton’s work and vehemently criticized the sloppy research of others who misapplied it. And, in a critique of Darwin, Weldon said that Darwin missed an opportunity, because “the problem of animal evolution is essentially a statistical problem” and not one of simple observation (quoted in Pearson 1938, 26). He argued that a correlational relationship alone would not substitute for solid empirical support.
Galton apparently conceived of the correlation concept in a sudden realization—an “aha moment.” He charmingly recounts this instant in his memoir:
As these lines are being written, the circumstances under which I first clearly grasped the important generalization that the laws of heredity were solely concerned with deviations expressed in statistical units, are vividly recalled to my memory. It was in the grounds of Naworth Castle, where an invitation had been given to ramble freely. A temporary shower drove me to seek refuge in a reddish recess in the rock by the side of the pathway. There the idea flashed across me, and I forgot everything else for a moment in my great delight. (Galton 1908, 300)
Some historians note that as an older man, Galton’s memory may have been in error (or perhaps the lapse is in Fisher’s biography of Galton, when he retells the story), as a careful review of the evidence suggests that he actually came to his discovery somewhat earlier, in a different place (Stigler 1989, 73–4). Still, the tale’s essentials are not in dispute: Galton invented correlation, and he did so in a moment of revelation.
* * * * * *
Combining his invention of correlation with his prior work on intelligence, Galton came to one of his most lasting influences: a singular focus on the accuracy of the instruments he was using to make his mental appraisals. Recall from Chapter 3 that, even as early as Galileo, scientists were attentive to the accuracy of their data. Galton was one of the first, however, to apply probability to systematically study errors in observations in social physics. He thus developed a whole new discipline: that of “psychometrics.” In fact, Galton is often credited with being the “father of psychometrics,” although this honor is variously attributed to others, too.
Psychometrics is the science of measuring unobservable individual characteristics, such as achievements, attitudes, opinions, and the like. Today, appraisal of most mental attributes is referred to as studying “latent traits,” although often psychometricians and psychologists make further labels for talents and other human attributes that are clearly cognitive but can also be behaviorally exhibited, such as playing a piano.
In Chapter 16, we explore psychometrics itself as an independent field of research; however, for introduction, the following notes are important. In practice, psychometrics is mostly focused on the construction and analysis of measurement instruments, especially as they concern validity and reliability in collecting data on latent traits. Today, the terms “validity” and “reliability” are taken to mean the appropriate and meaningful interpretation and use of scores yielded by a measure. They are not characteristics inherent in an instrument itself. In other words, a test instrument, independent of context, is neither valid nor reliable; rather, these properties are imbued in the decisions made on the basis of the yielded scores. Technically, validity is a sophisticated notion with independent properties, and reliability is subsumed under it, indicating a degree of mathematically verifiable consistency (see Osterlind 2010). Addressing psychometric questions typically involves sophisticated statistics that overlap with probability theory.
We see that, overall, Galton was someone who appreciated statistics not only for its utility but also for its elegance. As he said in his impactful work Natural Inheritance,
I find [statistics] full of beauty and interest. Whenever they are not brutalised, but delicately handled by the higher methods, and are warily interpreted, their power of dealing with complicated phenomena is extraordinary. (Galton 1889b, 62)
The fact that Galton moved research on intelligence into realms of empiricism and that such work was then being published in America is early evidence of quantification spreading to the New World. Developments in probability and the movement to quantification had finally moved across the pond.