![]()
Here included are various specific tools in one convenient place: all the formulas for applying Bayes's Theorem; the Canon of Probabilities for easing selection of a fortiori probability estimates; and a flow chart for applying Bayesian reasoning without any numbers or math at all (useful only in simple cases).
FORMULAE
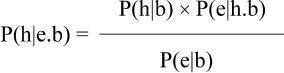
The short form of Bayes's Theorem reads:
Which in more advanced mathematical notation reads:
But this actually represents (and mathematically translates to) the long form:
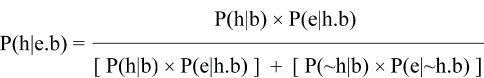
Which represents the logic:
“given all we know so far, then…”
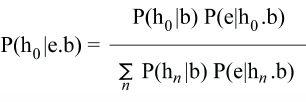
And when comparing more than two hypotheses, the long form can be expanded to:
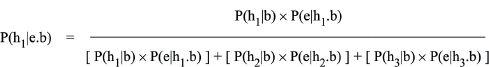
Which compares three hypotheses. If you want to compare more than three hypotheses, just add as many boxes to the denominator as you need (i.e., repeat the “[P(h3|b) × P(e|h3.b)]” box for h4, and so on); and remember that all P(hn|b) must sum to 1.
THE ODDS FORM
You can also represent Bayes's Theorem in the form of calculating the odds of something being true rather than the probability, and some prefer this form, as it more clearly separates the prior odds from the weight of the evidence, and shows more clearly how it is the ratio of probabilities that matters rather than the actual probabilities themselves; while others find this approach more complicated and confusing. But if you want to work with odds, the equation becomes:
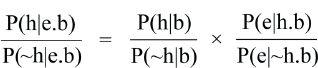
To illustrate how this form would be used, if the priors are 0.75 and 0.25 in favor of h, then the “prior odds” of h are 3:1, and if the evidence is 100% expected on h but the same evidence would only result half the time on ~h, then the odds favoring h are 2:1 (representing the weight of the evidence, i.e., how strongly it supports h), and then the total odds that h is true would be 6:1 (3 × 2). In other words: (0.75/0.25) × (1/0.5) = 3/1 × 2/1 = 3 × 2 = 6, which is 6/1, or just 6:1, which is P(h|e.b) in ratio to P(~h|e.b). The odds are then six to one that h is true. This form is convenient if you can more readily estimate the odds than the probabilities (e.g., if you are sure going in that h is three times more likely than ~h, but you aren't sure what either prior probability actually is; or if you don't know how likely the evidence is but are sure the evidence is twice as likely on hthan on ~h; or both).
For convenience, the most common and useful mathematical symbols are:
= (equals)
> (greater than)
< (less than)
>> (much greater than)
<< (much less than)
>>> (very much greater than)
<<< (very much less than)
≥ (greater than or equal to)
≤ (less than or equal to)
≈ (approximately equal to)
→ (approaching)†
†That last symbol can also mean other things in different contexts: in contexts pertaining to causal sequence it means ‘and then’ or ‘causes’; and pertaining to logical entailment, ‘entails.’
CANON OF PROBABILITIES
“Virtually Impossible” = 0.0001% (1 in 1,000,000) = 0.000001
“Extremely Improbable” = 1% (1 in 100) = 0.01
“Very Improbable” = 5% (1 in 20) = 0.05
“Improbable” = 20% (1 in 5) = 0.20
“Slightly Improbable” = 40% (2 in 5) = 0.40
“Even Odds” = 50% (50/50) = 0.50
“Slightly Probable” = 60% (2 in 5 chance of being otherwise) = 0.60
“Probable” = 80% (only 1 in 5 chance of being otherwise) = 0.80
“Very Probable” = 95% (only 1 in 20 chance of being otherwise) = 0.95
“Extremely Probable” = 99% (only 1 in 100 chance of being otherwise) = 0.99
“Virtually Certain” = 99.9999% (1 in 1,000,000 otherwise) = 0.999999
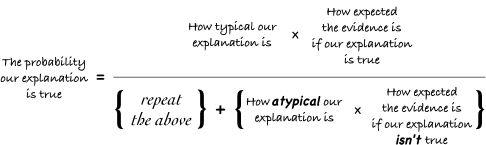
BAYESIAN REASONING WITHOUT MATH
Reproduced from Sources of the Jesus Tradition, ed. R. Joseph Hoffmann (Amherst, NY: Prometheus Books, 2010), with a colloquial version following (on page 288):
Bayesian Flowchart
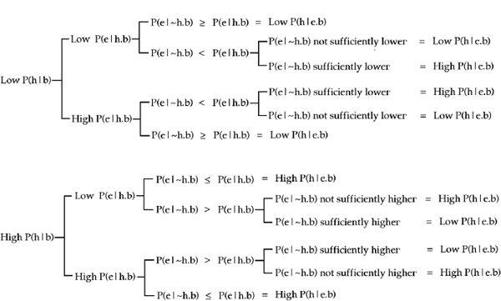
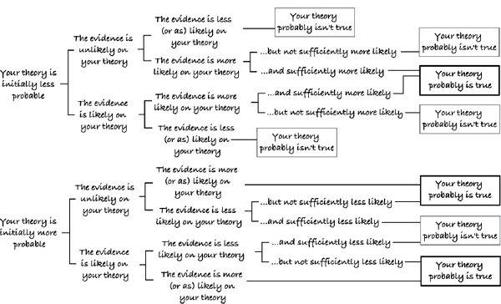
This chart (presented here in two forms, formal and informal) represents the complete logic of Bayes's Theorem (for two competing hypotheses), which can be used with nonnumerical declarations of relative likelihood at each step. All you must decide at each stage is which is more likely than the other. The answer leads you to the next decision, until you get an answer. For example, the first decision: is the hypothesis inherently more likely than not? If yes, it has a high prior; if not, a low prior. The second decision: is the evidence more likely on your hypothesis, or not? And so on.
To use either chart, the terms “Low” and “Unlikely” mean lower than 50% (< 0.50), and “High” or “Likely” mean higher than 50% (> 0.50), although when P(e|h.b) = 50% (i.e., when the evidence is no more likely than unlikely), then treat it as “High” (i.e., likely) if P(h|b) is “High,” and “Low” (i.e., unlikely) if “Low,” accordingly. “Sufficiently lower” and “sufficiently less likely” (or “sufficiently higher” and “sufficiently more likely”) mean P(e|~h.b) is lower (or higher) than P(e|h.b) by enough to overcome the prior probability (and thus produce a conclusion contrary to what the prior probability alone would predict), though there is hardly any principled way to determine this without returning to the math. To read the results on the formalized chart, a high P(h|e.b) means your hypothesis is more likely true; a low P(h|e.b), more likely false (and the higher or lower, the more likely either way). Both charts are identical, it's just that one uses the formal terms and symbols, the other, plain English.
The one circumstance not represented on the flowchart is when P(h|b) = 50% (and therefore is neither “High” nor “Low,” i.e., neither hypothesis is “initially more probable” than the other). In that event the hypothesis with the higher P(e|b) is more likely true (i.e., the one for which the evidence is more likely), and if both hypotheses are equal on that measure as well, then the hypothesis is as likely as not (the outcome is simply 50/50).
![]()
NIF = Richard Carrier, Not the Impossible Faith: Why Christianity Didn't Need a Miracle to Succeed (Raleigh, NC: Lulu.com, 2009).
SGG = Richard Carrier, Sense and Goodness without God: A Defense of Metaphysical Naturalism (Bloomington, IN: AuthorHouse, 2005).
TCD = John Loftus, ed., The Christian Delusion: Why Faith Fails (Amherst, NY: Prometheus Books, 2010).
TCDs = Richard Carrier, “Christianity Was Not Responsible for Modern Science,” TCD, pp. 396–419.
TCDw = Richard Carrier, “Why the Resurrection Is Unbelievable,” TCD, pp. 291–315.
TEC = John Loftus, ed., The End of Christianity (Amherst, NY: Prometheus Books, 2011).
TECd = Richard Carrier, “Neither Life nor the Universe Appear Intelligently Designed,” TEC, pp. 279–304, 404–14.
TECm = Richard Carrier, “Moral Facts Naturally Exist (and Science Could Find Them),” TEC, pp. 333–64, 420–29.
TECs = Richard Carrier, “Christianity's Success Was Not Incredible,” TEC, pp. 53–74, 372–75.
TET = Robert Price and Jeffery Lowder, ed., The Empty Tomb: Jesus Beyond the Grave (Amherst, NY: Prometheus Books, 2005).
TETb = Richard Carrier, “The Burial of Jesus in Light of Jewish Law,” TET, pp. 369–92.
TETs = Richard Carrier, “The Spiritual Body of Christ and the Legend of the Empty Tomb,” TET, pp. 105–232.
TETt = Richard Carrier, “The Plausibility of Theft,” TET, pp. 349–68.