3
Apart from theoretical considerations, images of the Cosmic Microwave Background Radiation are the earliest evidence for the character of the Universe – the equivalent of a hazy ultrasound scan of a baby in the womb, who will develop into an adult. The patches in the CMB are hotter and cooler areas, but also rarefied holes or denser condensations. They represent the earliest-known structures. Everything in our environment that we know and cherish developed from the slightly denser blobs – they are the basis for our existence and the ultimate trigger for our interest in what the Universe contains. Eventually those blobs turn into, for example, the human relationships of our own lives.
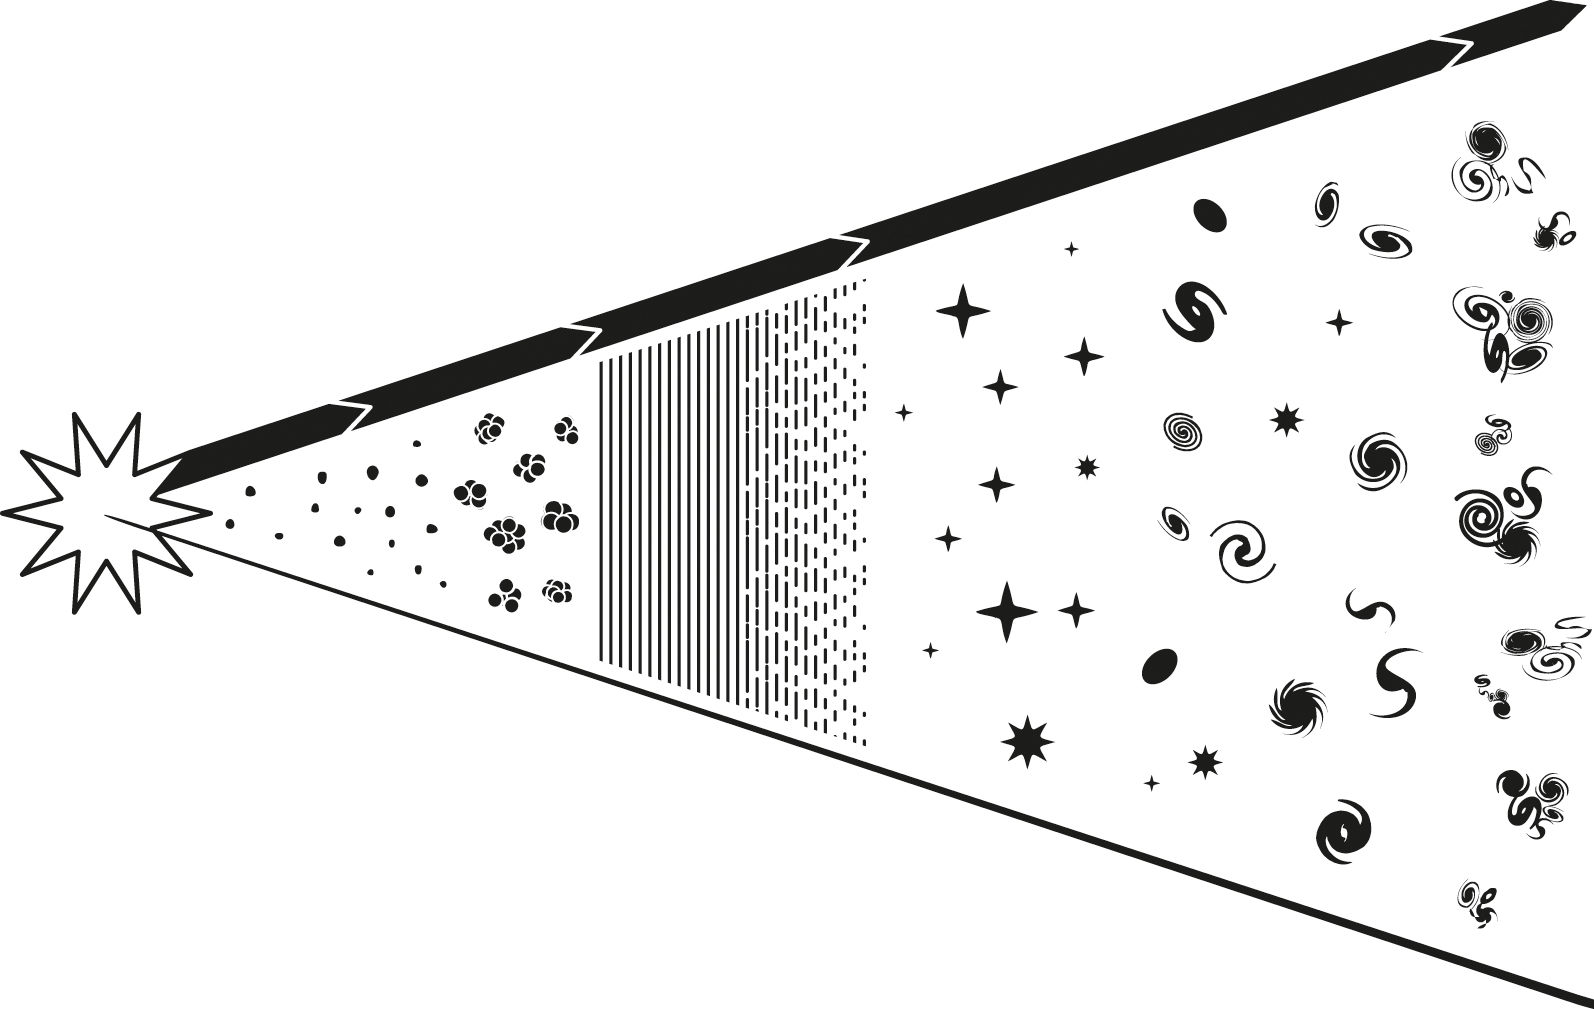
The Big Bang created matter, dark matter and radiation. The radiation faded away, and stars formed in small galaxies, which merged to make larger ones. Galaxies then congregated into groups and clusters of galaxies.
Randomness and pattern in the early universe
What happened all those billions of years ago was that a slight excess in the density of a blob, an excess both of ordinary matter and dark matter, caused an inward, attractive gravitational force on the material surrounding the blob. This drew the extra material inwards and caused the blob to condense further. Thus, the blob grew in both mass and density. The development of the blobs evolved into a web of lumpy filaments connecting the larger blobs.
Over the first 200 million or 300 million years of the life of the Universe, the blobs and the filaments went on to form concentrated masses of matter – intergalactic clouds of dark matter and a mixture of hydrogen and helium. The matter and the dark matter cooperated, the one helping the other: the dark matter dragged in the matter and the matter augmented the inward gravitational attraction of the dark matter. The matter also resisted the gravitational force with an outward pressure. The most massive blobs were to form the largest structures in the Universe: clusters of galaxies. Within the clusters, further concentrations formed galaxies, within which developed stars and planetary systems – and ultimately ourselves. Galaxies also formed mostly in the filaments.
Although the blobbiness in the CMB is random, in the sense that there was apparently no regular pattern, it does have some discernible general characteristics: the blobs have a typical size and separation. This is the result of a marvellous effect called acoustic oscillations: the early Universe rang with sound! It did not play just a single note, such as a flute would make, but a range of notes, somewhat similar to the sound that would be created by a trickle of sand falling onto a drum. The notes have persisted to this time as a faint whisper discernible in the arrangement of galaxies, just as the sand would collect preferentially in various places on the drumskin.
The pattern of notes has been brought out in a statistical analysis of the CMB called cross-correlation. Imagine a simplified pattern, in which the CMB is made of bright and dark squares, like a chessboard, with the white representing the bright areas and the black the dark areas. Choose two points that are a certain distance apart and multiply their brightness together: if one point is in a white square (call its brightness 1) and the other is also in a white square, the cross-correlation is 1 × 1 = 1. All the pairs of points that lie within the white squares will produce the same result. But if the second point falls within a black square (brightness 0), the cross-correlation is 1 × 0 = 0. Repeat this with all the points that are at the same separation, then add up all the cross-correlation products. Now do it all again starting with a different point. When you have done this with all the possible starting points, choose a different separation and repeat the process. Now plot the cross-correlation as a function of separation. For a chequer pattern, there will be a peak that corresponds to separations that are up to the size of the chequers, then the cross-correlation will dip when the separations stretch across one chequer into squares of the opposite colour.
The cross-correlation pattern of the CMB shows that the most frequent size of a blob is 1 degree. Why is this? The reason is that gravitation was not the only force influencing how the blobs grew in size. Pressure forces also had a role. The light and heat trapped in the moving plasma of the early Universe as a blob became denser caused an increase in pressure, which generated a pressure wave – in physics, a pressure wave in material is called a sound wave. The matter was driven by the radiation and tried to expand, sending the sound wave into the surrounding material of very dense plasma – a sound wave that travelled initially at one-third of the speed of light! However, dark matter does not interact with radiation – so although the dark matter responded to changes in gravitational force caused by changes in the density of the matter, it ignored the radiation. Therefore, the denser blobs of matter attracted both ordinary matter and dark matter, but not in the same way.
After about 380,000 years the electrons and protons combined. The matter in the Universe had been a plasma, but it became an electrically neutral gas of atoms, which did not interact as much with the radiation, so the sound wave stalled. This froze the regular structure of the waves in the gaseous material in a pattern of what are known as acoustic oscillations. The series of the many waves overlapped, contributing to a random pattern. Earlier, this was likened to the effect of sand falling on a drumskin, but this analogy was deficient in that the drumskin is stretched on a fixed, circular framework and the pattern of oscillations is regular – it is this property that enables a musical instrument to produce a pure musical note. There is no such fixed boundary in the Universe, and a better analogy might be to think about the oscillations on the surface of a large pond. If one region produces an effect like throwing a pebble into the pond and seeing the expanding ripple, then the Universe as a whole produces the effect of throwing a handful of gravel into the water and looking at the overlapping choppy disturbances.
The Universe is thus, in this way, random, but nevertheless, statistical traces of the simple patterns of which it is composed remain – within the noise of the random structure there are even now the traces of a vestigial note. There is a likelihood that if there is a dense spot in the CMB, other dense spots lie within a 500-million-light-year radius. The blobs of Big Bang material became patches in the CMB, and the 500-million-light-year dimension corresponds to the angular size of 1 degree, which is typical of the size of a patch.
When the blobs of the CMB condensed into galaxies a few hundred million years after the CMB became free of interaction with the material of the Big Bang, the galaxies preserved the tendency to be clumpy on this scale and the clumpiness persists even today. If a galaxy is discovered, there will be galaxies all around, distributed at random, but there is a slightly larger than random statistical chance that there is a galaxy within 500 million light years. The apparently random distribution both of the patches in the CMB and of galaxies shares the same underlying pattern of clustering.
The clustering of galaxies was first hinted at in an analysis by British cosmologists John Peacock and Shaun Cole in 2001, and then clearly detected in 2005 by a team led by American cosmologist Daniel Eisenstein of the Steward Observatory, University of Arizona. They analysed the positions in three-dimensional space of 46,748 galaxies distributed over 9 per cent of the sky, in a volume equal to a cube measuring 4 billion light years on each side. Because of the capacity of modern computers, it is now common for large teams to acquire and analyse ‘Big Data’ from extensive surveys to find out things about the Universe – although it seems likely that there will always be a place for the lone scientist with the striking and original idea.
The structures of clusters of galaxies, superclusters and voids
The combination of randomness and pattern shows itself in the present distribution of galaxies: they group into strings and clusters. Clusters of galaxies are the largest structures in the Universe that are bound together by their mutual gravitational attraction as long-lasting entities. Even larger structures exist. They are known as superclusters – clusters of clusters of galaxies. They are in the process of dissipating, because their self-gravity is not strong enough to hold the component clusters of galaxies together. They may be the biggest structures in the Universe, but they are transient.
Within a supercluster, clusters of galaxies are connected by threads of galaxies, like the strands of webs. Sometimes the threads are flat and akin to ribbons, like the places where the surfaces of bubbles touch in a soapy foam. The clusters and superclusters are the regions where the surfaces of bubbles touch. Conversely, there are large volumes of space, like the interior of bubbles in the foam, in which galaxies are few and far between: these are called voids. All this structure developed from the random blobbiness in the fireball of the Big Bang, which imprinted the patches in the CMB. Astronomers have mapped and investigated some of the individual structures in the distribution of the galaxies that surround us. Some of the nearer structures of this cosmic web have been identified by plotting galaxies on a map (pl. V).
The first attempts to map the large-scale structure in the distribution of galaxies around us were led by American astrophysicist Margaret Geller (b. 1947) and astronomer John Huchra (1948–2010) of the Harvard & Smithsonian Center for Astrophysics (CfA) in the 1980s. The CfA survey probed out in a slice of the sky to 500 million light years and in about 1989 what became known as the Great Wall of galaxies, at a distance of about 400 million light years, was discovered. This was a line of galaxies roughly circumferential around us, and stretched from one edge of the survey to the other, so approximately 400 million light years long. Although named a ‘wall’, it was not very high; it could be imagined as a low dry-stone wall running across moorland, the kind that keeps sheep from straying too far. It is shaped somewhere between a wall and a filament.
The CfA survey was inspirational. In its second phase, it went on to accumulate the distances of 18,000 galaxies, and analysis showed that surveys of hundreds of thousands of galaxies or more were needed to make a good attempt at mapping local structure. This required mass-production techniques to be applied to a large fraction of the sky. The 2dF Galaxy Redshift Survey set out to do this. It was carried out between 1996 and 2001 in New South Wales by the Anglo-Australian Observatory with an amazing machine built by astronomer Keith Taylor that was carried at the prime focus of the Anglo-Australian Telescope. It used a robot to place optical fibres in the focal plane of the telescope to pick up light from four hundred galaxies at once, measuring redshifts at the rate of thousands per night. The redshift of a galaxy is the amount by which its spectrum is displaced from its normal position by virtue of its motion, mostly because the Universe is expanding. The key fact that makes a scale map of the Universe possible is that, because of the expansion of the Universe, the bigger the speed, the more distant the galaxy. Taylor’s robotic machine was a device for showing how galaxies are distributed around us. (See Glossary for a further explanation of redshift.)
In a few hundred nights of observing spread over five years, the telescope measured 221,283 galaxies. Brought to fruition by an Australian-British team led by astronomer Matthew Colless of the Australian National University, it was the first galaxy survey to give a comprehensive and representational map of a significant fraction of the Universe. It not only mapped out the local voids, superclusters and filamentary walls that surround us, but also showed how the largest structures were compressed as the galaxies fell together, continuing the process of gravitational attraction that set off from the density fluctuations in the material of the Big Bang.
Even this survey was not enough to satisfy astronomers’ needs. Spurred by the difficulties faced in 1990 by the Hubble Space Telescope when it was failing to deliver sharp images because of a manufacturing fault, Princeton University astronomer Jim Gunn (b. 1938; see also page 83) set up an independent project to locate and measure galaxies by the million. It was funded in major part by the Alfred Sloan Foundation and became known as the Sloan Digital Sky Survey (SDSS). The survey used a dedicated telescope and camera built for the purpose at Apache Point Observatory in the Sacramento Mountains of New Mexico. However, in contrast to a massive project like NASA’s Hubble Space Telescope, to avoid stifling and diluting the scientific focus, the SDSS was deliberately kept to a scale and with a purpose that could be controlled by an individual scientist.
The SDSS telescope is not of world-beating size. Its mirror is 2.5 metres (100 inches) in diameter, ranking perhaps number 50 in the world. It is able to see a large area of the sky in its field of view, which is desirable in a telescope that is going to try to record everything. The camera is novel and uses huge CCDs (charge-coupled devices) to record the brightness and spectrum of what it sees in the sky. It is operated a little like Google Street View, which records places along streets driven by a mobile camera. The SDSS observing technique is to cause the telescope to scan at a precisely controlled rate along a track in the sky and to shift the image on the CCDs electronically at an exactly compensating rate to build up an exposure. In its first five years of operation, the project recorded the brightness of 1 billion stars and galaxies, and the spectrum of 4 million, a number that is increasing as the project continues.
The data from the SDSS is accumulated in a publicly accessible archive as soon as it is obtained and processed. It is unusual for data from an astronomical project to be made public so quickly – usually the project personnel have rights to withhold the data for a period of time as a scientific reward for putting in the effort to bring the project to fruition. The logic was that the project was funded by public sources of money and its data should be publicly available, and that it would be best for science if anyone could bring ideas to the archive to investigate its scientific possibilities. The project personnel knew so much about the instrument’s capabilities and its programme, it was argued, that they had an advantage over the rest of the community of astronomers and ought to be able to make killer discoveries even if they were competing in the same time frame as everyone else. It has been a community effort to master the data produced by the SDSS and use it so successfully to map the structure of the Universe as it is known today.
An early success for the project was the identification of the Sloan Great Wall in 2003, a filament of the cosmic web more than 1 billion light years long and curved in an arc around us at a distance of 1 billion light years. Perhaps the most important discovery so far is the use of the data by Daniel Eisenstein to nail down the residual effects of acoustic oscillations in the distribution of galaxies. Eisenstein had shown how well attuned he was to the aims and operation of the SDSS project and became its director from 2006 to 2010.
The real Universe and the Millennium Simulation
Maps like the ones produced from the SDSS that showed how galaxies are distributed into characteristic shapes constitute a challenge to astronomers to explain how this came about. They were able to do so by using simulations in computers. The Millennium Simulation was a calculation run by the Virgo Consortium, centred on the Institute for Computational Cosmology at the University of Durham in the UK and the Max Planck Institute for Astrophysics in Germany, which showed how the small irregularities developed in the matter exploding in the Big Bang. The simulation took the following form: create in a computer a virtual box a few billion cubic light years in volume, then scatter into it 10 billion particles representing clumps of matter and dark matter; programme the computer with physical laws such as gravity and watch how the particles pull each other, move and develop structures.
The resultant distribution of particles looks like a web when displayed as a two-dimensional cross-section or projection. In a three-dimensional representation it would look like a foam, with holes that now have a characteristic size of 500 million light years. The web of galaxies is not a rigid structure and is flexing and rippling with the residual random motions of the Big Bang and the subsequent cumulative effects of the pull of each galaxy on the rest.
Thus, these structures are transitory. They are large and the force of gravity that holds them together is weak. Moreover, the galaxies within them are moving quickly so they tend to dissipate. They have not dissipated yet because not enough time has elapsed since the time that they formed, just a few hundred million years after the Big Bang. However, within the structures are more compact groups of galaxies that will endure: they are the densest clusters of galaxies and are comparatively tightly packed together.
Dark matter in the cosmic web
Both the Millennium Simulation and the measurements of the CMB reveal the effects of dark matter on the cosmic web. The dark matter behaves differently from matter because, although both make their presence known by their gravity, they behave differently in their interaction with radiation and heat energy. Dark matter does not interact with light – which is why it is dark – but nor does it interact with infrared radiation or heat, so it does not cool as quickly as ordinary matter. Ordinary matter in the Big Bang material cools and gets denser and the dark matter remains hot and more diffuse, while both respond similarly to gravity. As a result, ordinary matter and dark matter concentrate into blobs in slightly different ways.
The differences were evident in the output of the Millennium Simulation. The dark matter blobs are in general bigger and more diffuse. Concentrations of ordinary matter like galaxies or clusters of galaxies are embedded in larger clouds or haloes of dark matter. This shows in the real Universe through gravitational lensing, which reveals where both types of matter are distributed in galaxies (pl. III). The dispersal of starlight shows where ordinary matter is located. In this way, astronomers can distinguish ordinary matter and dark matter and map the separate distribution of each kind.
Gravitational lensing is a phenomenon in which gravitation affects the path taken by light, deflecting it from a straight-line path. We ordinarily visualize space as ‘nothing’, measured by a kind of invisible rigid scaffold of three dimensions on which matter moves about like building workers. Albert Einstein had a more integrated view: space interacts with matter, each affecting the other. ‘Matter tells space how to curve, space tells matter how to move,’ wrote American physicist John Wheeler in 1973, explaining how Einstein’s general theory of relativity works. In this way, Einstein offered a solution to one of the dilemmas of Newton’s theory of gravity – how the force of gravity is transmitted through space.
Space is not ‘nothing’, it is a physical entity. Ordinary matter and dark matter alike bend space; the curvature of space bends the trajectories along which matter moves. Indeed, matter bends the trajectories of rays of light, just as glass does when shaped in a lens. Because matter is not uniformly distributed in the cosmic web, it bends rays of light from distant galaxies with a cumulative distorting effect as the rays pass through the Universe. We do not view distant galaxies, or indeed the image of the blobs of the CMB, through the perfect lens of nothing at all. We look back into the past life of the Universe through a crinkly lens of randomly distorted space, as if through a pane of bathroom glass. By analogy with optical lenses, this phenomenon is called gravitational lensing.
Just as a bathroom window obscures what lies beyond it, breaking up and rearranging the image seen through the glass, gravitational lensing limits the precision with which we can see images of distant cosmic history. At the same time, it provides a unique chance to study the distribution of matter in the cosmic web, giving us a way to map that matter. In principle (although I have never heard of anyone, even the most intrusive voyeur, actually doing this), one could learn about each tilted facet of the bathroom window pane by examining the fragmented image seen through it, straightening each fragment and reassembling the image clearly. In the astronomical case there are simplifying assumptions to be made about the pattern of lenses that are valid enough to calculate how each facet of the gravitational lens might affect the image, both to reassemble the distant image and to learn about the matter that caused the distortion. And because ordinary matter and dark matter both contribute to the distortion, and there is more dark matter than ordinary matter, it is a way to map the invisible dark matter that fills the otherwise vacant spaces of the Universe.
The first results of programmes intended to make such maps began to appear in the 1990s and pointed the way for later investigations. ESA’s Planck satellite imaged the CMB (see Chapter 2) and in 2015, scientists analysing the data determined how the dark matter generally distributed in the Universe distorted the blobs in the image.
Other surveys doing much the same thing have used ground-based telescopes. One such, located at the European Southern Observatory’s Paranal Observatory in Chile, is called the Kilo-Degree Survey (KiDS) and has imaged the galaxies in an area of the Southern sky about 1,500 square degrees in size (about 3 per cent of the entire sky). The light from the most distant galaxies (not as far away as the CMB, but far away nonetheless) is altered by gravitational lensing. Generally speaking, the distortion is very slight, but there are some dramatic individual cases, known as strong gravitational lensing. The Dark Energy Survey is similar to KiDS. It is based at the Cerro Tololo Inter-American Observatory, also in Chile, and has mapped an even bigger area of 5,000 square degrees for an equivalent analysis.
Both surveys come under the heading of ‘Big Data’. Their analysis is highly technical and time-consuming because the data sets are large and complicated. The first images produced by KiDS – made by analysing the light collected from over 3 million distant galaxies more than 6 billion light years away – show concentrations of matter and dark matter in the blobs and filaments that are predicted. The images are broadly similar to the Millennium Simulation.
Having honed their techniques on ground-based telescopes, astronomers are planning to repeat the measurements in space. A new ESA cosmology satellite called Euclid is scheduled to launch in 2022 to measure this effect. The aim eventually is to do more than refine our knowledge about the way that matter in the Universe is distributed. It is to look at the way the cosmic web changes with time, developing over the life of the Universe, from the CMB to now. This history is important because the gravitational attraction that dark matter provided made the development of structure happen faster and stabilized the structure that developed.
Without dark matter playing its part in making galaxies and holding them together, we would not be here. Even though we do not know what dark matter is, and even though it now plays no significant part in our lives as we live them in our immediate environment, we owe our existence to its historic effects during the first 1 per cent of the expansion of the Universe.
The Virgo Cluster
The Virgo Cluster is our closest cluster of galaxies. It is at a distance of approximately 60 million light years from Earth spread over the constellations of Virgo and its neighbour Coma Berenices. The Virgo Cluster was first remarked on in 1784, when French astronomer Charles Messier (1730–1817) was compiling a catalogue of ‘nebulae’. Messier was an assiduous comet hunter, scanning the sky night after night to discover new ones. When first seen, on the edge of the solar system far from the Sun, comets have no tails and are small, fuzzy objects looking very similar to some other celestial patches of light, which, in contradistinction to point-like stars, were called nebulae (the Latin word for ‘clouds’). If he came across such an object, Messier needed to spend time finding out whether it was a comet or a nebula. He compiled a catalogue of his own discoveries and those of his colleagues so that the nebulae could not be confused with comets in future.
Messier noticed that an unusual number of nebulae in the catalogue were grouped together in Virgo. What Messier called nebulae were, in fact, a mixture of true nebulae (clouds of interstellar gas or dust), star clusters and galaxies, which were all confused together in Messier’s time. The nebulae in Virgo that formed the group identified by Messier are all galaxies. He made his remark in the catalogue’s ninety-first entry, M 91: ‘The constellation Virgo and especially the northern wing is one of the constellations which encloses the most nebulae…. All these nebulae…can be seen only in a good sky and near meridian passage. Most of these nebulae have been pointed out to me by M[onsieur] Méchain.’
Pierre Méchain (1744–1804) was a friend and colleague of Messier’s. In a letter of 1783, published in the Memoirs of the Berlin Royal Academy of Sciences and Arts, he says that he had discovered more nebulae in this region: ‘M. Messier mentions several nebulae in Virgo which I have indicated to him; but there are others which he has not seen.’ No records of Méchain’s additional observations are known.
In his catalogue, Messier listed a total of 109 objects of which 16 are, in modern terminology, galaxies in the Virgo Cluster and not nebulae at all. They are number 49 in the catalogue (M 49), followed by M 58, M 59, M 60, M 61, M 84, M 86, M 87, M 89 and M 90, which all lie in the Virgo constellation and M 85, M 88, M 91, M 98, M 99 and M 100, which lie within the present boundaries of the constellation of Coma Berenices. Messier numbered the celestial objects in his catalogue as he entered them, so M 49 was the first Virgo Cluster galaxy, discovered by Messier himself. He went on to discover M 58, M 59, M 60 and M 61 while following the track of the comet of 1779. German astronomer Johann Koehler and Italian Barnabus Oriani were doing the same thing and independently discovered M 59, M 60 and M 61. M 85 was discovered by Méchain and confirmed by Messier a few days later, together with M 84 to M 91, on the same night in March 1781. M 98 to 100 were also discovered by Méchain on one night and included by Messier as the last objects in the third edition of his catalogue just before he sent it to press. The most famous and most prominent Virgo Cluster galaxy is M 87, which is a giant elliptical galaxy that emits copious amounts of radio waves and is thus also known as the celestial radio source Virgo A.
It was in the first two decades of the twentieth century that these ‘nebulae’ revealed their true nature as galaxies, or star systems. Photography not only made possible this discovery by providing a means to measure the brightness of stars in galaxies and thus show how distant they are, but it also enabled the discovery of fainter galaxies. The number of galaxies increased from the score or so that could be seen by Messier and Méchain by eye to the hundreds. The first investigations of the nature of the Virgo Cluster were reported in an impressive series of papers by the Harvard College Observatory astronomers Harlow Shapley (1885–1972) and Adelaide Ames (1900–1932), the data derived from one- to two-hour exposures of photographs taken with various telescopes at Arequipa in Peru. In 1926, Shapley and Ames counted 103 spiral galaxies in the cluster, within an area of 100 square degrees, noting that there were many more too faint to see clearly.
Shapley led the work. He had started his career as a journalist and intended to develop his credentials in the new School of Journalism at the University of Missouri but, finding that the new school was not yet open, he turned in 1908 to astronomy. In 1920, he participated with Henry Curtis in what became known as the Great Debate at the National Academy of Sciences in Washington DC on the scale of the Universe, which established that the Milky Way was a galaxy of stars and that many ‘nebulae’ were similar galaxies beyond the Milky Way – so-called ‘island universes’ (see page 98). His performance in this debate was impressive enough that he was appointed as director of the Harvard College Observatory. He became a very influential figure in American astronomy, and science in general, with his fingers in many pies, taking on many projects and administrative tasks.
In 1923, Shapley hired Ames as a research assistant: she, too, had intended to have a career as a journalist but, upon graduation from Vassar College in New York State, was unable to find work in journalism. Sadly, her career and her life were cut short prematurely in 1932 when, on a lakeside holiday, her canoe overturned and she drowned, aged thirty-two. The job offered to Ames was to establish a list of the known galaxies and measure their properties. The year before her death, Shapley and Ames had published a catalogue of 2,800 galaxies, of which 1,246 near the north pole of the Milky Way formed a more detailed list in what has become known as the Shapley-Ames Survey. It is still used today. Ames’s background as a journalist formed her attitude to her astronomical work. ‘I collect only the facts,’ she is recorded as saying. ‘The theories are Dr Shapley’s.’ She took pleasure in her astronomical work: ‘For constant thrill I’d hand it to journalism, but for lasting satisfaction, give me astronomy!’
Modern surveys identify up to two thousand galaxies in the Virgo Cluster (because it is the nearest cluster of considerable size, it has been very well studied). It consists not only of galaxies – between the galaxies are many intergalactic stars (perhaps these constitute as much as 10 per cent of the number of stars in the galaxies) and a hot, rarefied plasma of intergalactic gas. The stars have been thrown out of their parent galaxies as they jostled past other galaxies. The plasma has a temperature of 30 million degrees Celsius (54 million degrees Fahrenheit). It emits X-rays and is heated by the black hole in the core of M 87 (pl. VII) and the passage of other galaxies through the cluster that cause the gas to slosh back and forth.
The Virgo Cluster is a part of the Local Supercluster of galaxies, also known as the Laniakea Supercluster, the name deriving from two Hawaiian words, lani, meaning ‘sky, heaven’, and akea, meaning ‘broad, wide, spacious, immeasurable’. It was mapped by a University of Hawaii team led by Canadian astronomer Brent Tully and contains hundreds of thousands of galaxies. Our own Galaxy is situated on the boundary between this supercluster and a large empty space called the Local Void.
The Great Attractor
Our Galaxy and the others nearby feel the gravitational pull of the galaxies all around. That pull is unbalanced because there is an uneven distribution of galaxies around us – more on one side than the other. As a result, our Galaxy is travelling through space at a speed of 600 kilometres per second (1.3 million miles per hour), additional to the motion it has as part of the expansion of the Universe. This streaming motion was identified in 1987 by the ‘Seven Samurai’ – not the group of Japanese warriors in the 1956 movie by Akira Kurosawa, but a group of astronomers, namely David Burstein, Roger Davies, Alan Dressler, Sandra Faber, Donald Lynden-Bell, Roberto Terlevich and Gary A. Wegner.
The direction towards which our Galaxy is streaming lies behind the galactic centre and is both confused and obscured by stars and dust in the Milky Way. Additionally, the surveys of galaxies at the time were less extensive than they became. The Seven Samurai were clear in 1987 that the streaming motion is real and is connected with the large number of galaxies in the direction towards which the stream is heading (a dense scattering called the Shapley Concentration, a term originating from the work of Shapley in 1932). However, they could not identify precisely what causes the motion. During a press conference after a lecture about the issue at the American Astronomical Society, American astronomer Dressler, impromptu, referred to it as an unknown entity using the name ‘the Great Attractor’ – some enormous thing in the Universe that is tugging on our Galaxy. If he had used ‘Cluster X’, or even ‘the Shapley Concentration’, it would not have caught the imagination, but the Great Attractor was too spectacular a concept for the press to ignore and sparked articles about its role in the astrological charts of potential life-partners or in the final destiny of the solar system. The name had slipped out from Dressler’s mouth unpremeditated and his colleagues in the Seven Samurai expressed concern that the flashy name might detract from the scientific content of the work, although they also recognized that it would ensure that the work would become widely known. ‘My fellow Samurai were happy to pass on both the credit and the blame,’ wrote Dressler, wryly.
It took thirty years to map out specifically what is happening. The Great Attractor is not a monster black hole, or anything similar. According to Tully and his collaborators, the motion of the Galaxy is the result of a combination of the effects of the pull of the Virgo Cluster of galaxies and the Laniakea Supercluster, whose central concentration is the Great Attractor, coupled with the emptiness of the Local Void and the lack of compensating pull from galaxies in that direction.
One general conclusion that can be inferred from this particular instance is that galaxies are still being drawn towards concentrations of other galaxies. In other words, the voids of the cosmic web are growing: space is getting emptier.
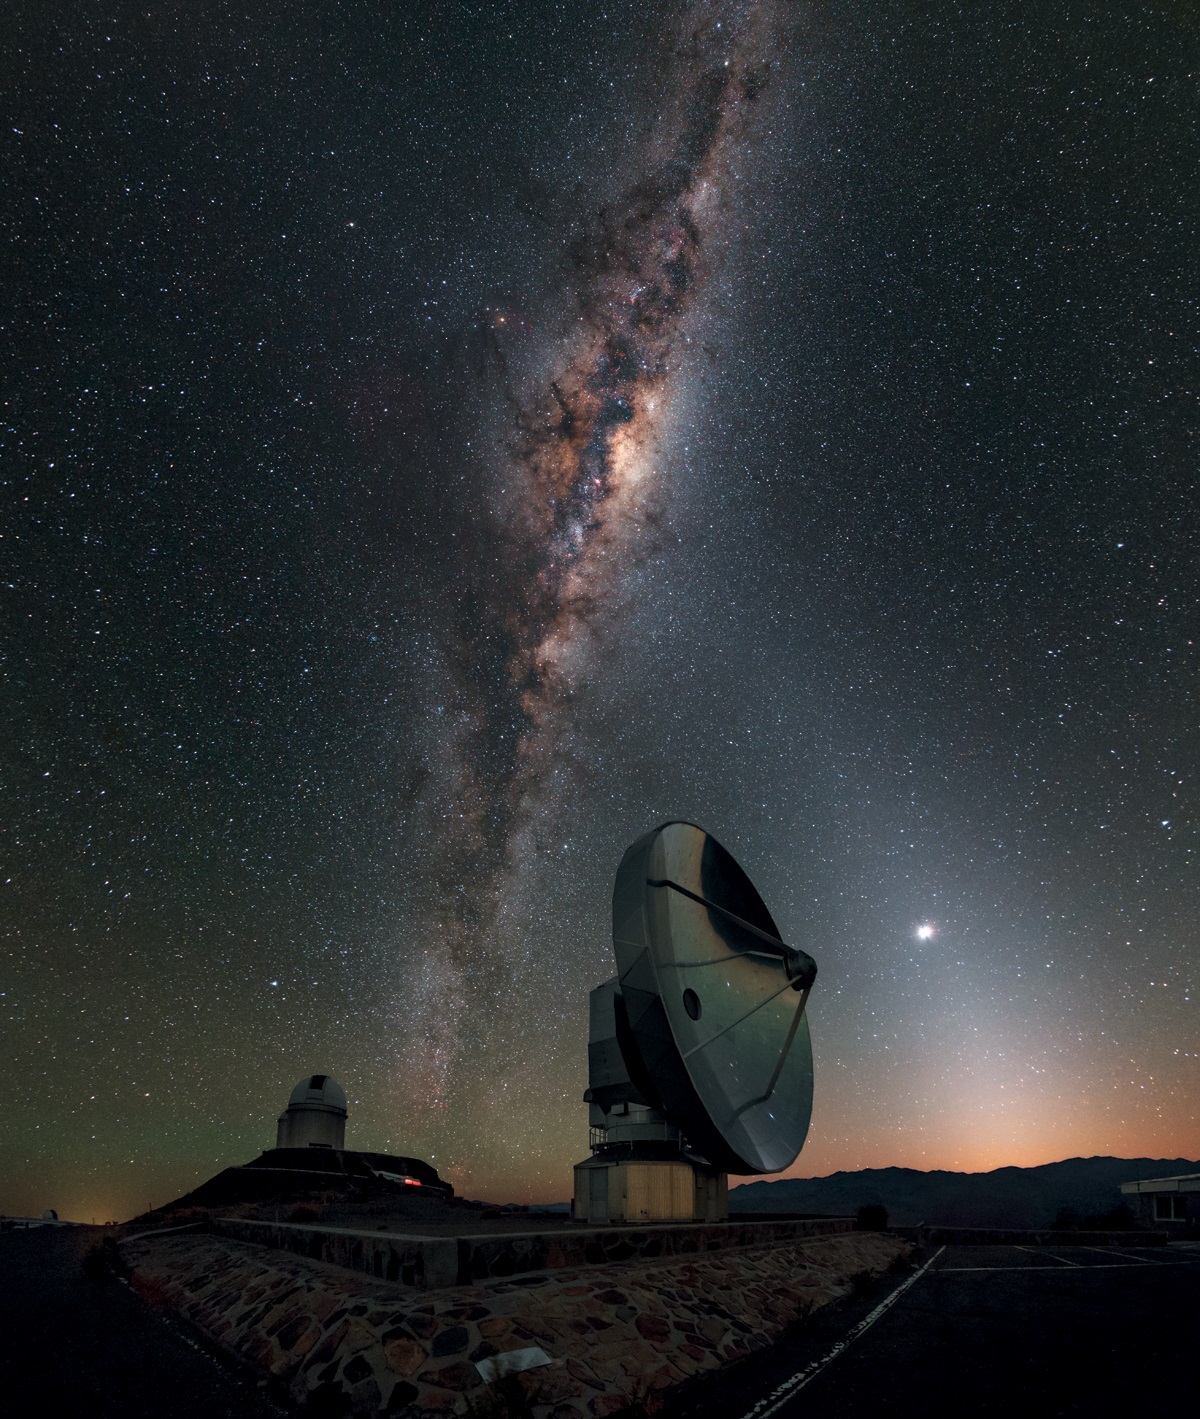
I The Milky Way. Star clouds towards the centre of our Galaxy arc across the dawn sky at the La Silla Observatory, in Chile. Dark holes in the massed stars, in reality clouds of dust particles, block the light behind them. The triangular white glow that stretches up and to the left from the orange glow that marks where the Sun is, below the horizon, is known as the zodiacal light. It is dust in the solar system, ground from the surface of colliding asteroids and comets. The 15-metre Swedish–ESO Submillimetre Telescope stands in the foreground, apparently pointing to the planet Venus.
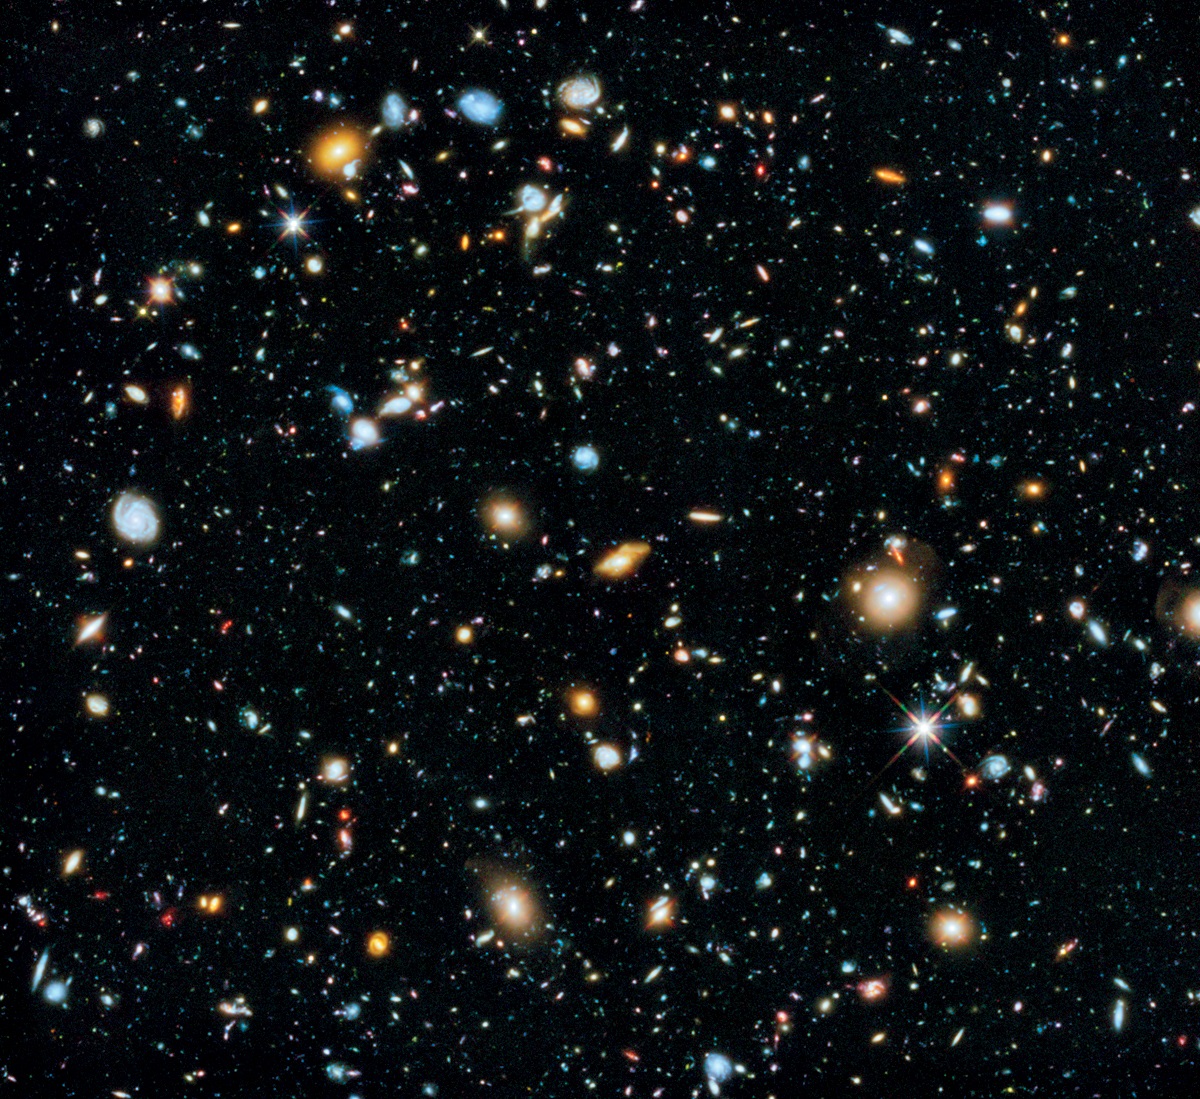
II The Hubble Ultra Deep Field. The Hubble Space Telescope targeted a small patch of what was up to then empty sky, and imaged it over and over again in a deep exposure to reveal 10,000 of the faintest, furthest galaxies. The group photograph tells the biography of galaxies as they evolve over 13.2 billion years of cosmic time – newborn infants, adolescents and adults – and confirms the black sky between the galaxies that is the clue that the Universe is not infinitely old.
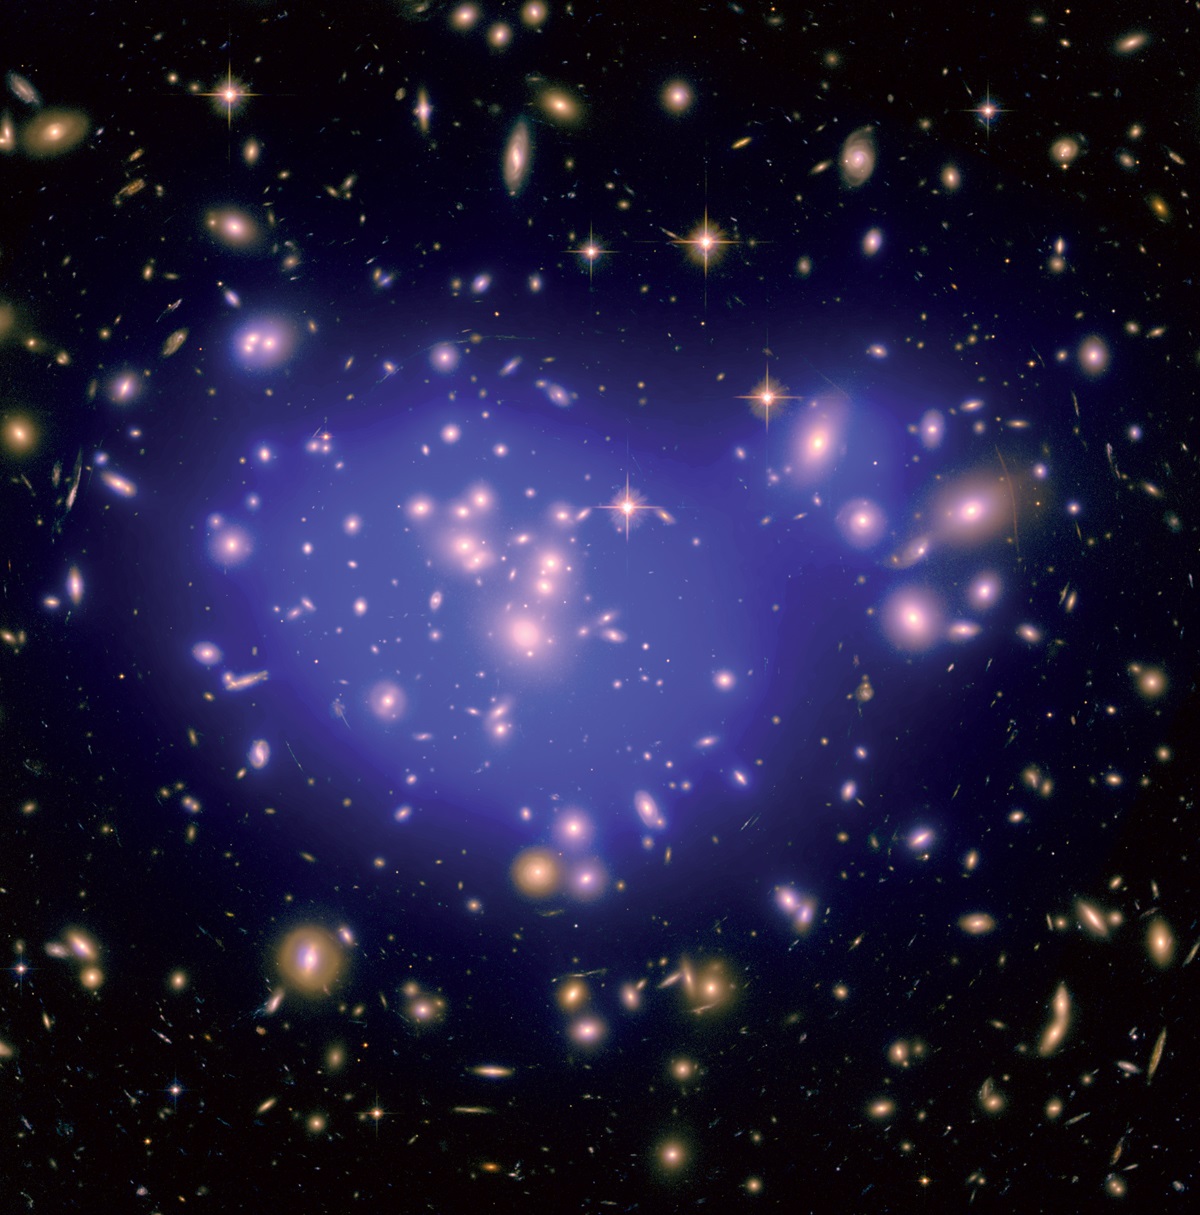
III Abell 1689, one of the biggest clusters of galaxies known, 2.4 billion light years away. The photograph shows not only the galaxies in the cluster but also a system of streaks and arcs that are the distorted images of galaxies lying far in the background and magnified by the gravitational lens effect of all the matter in the cluster. The purple overlay represents the matter, both ordinary and dark matter.
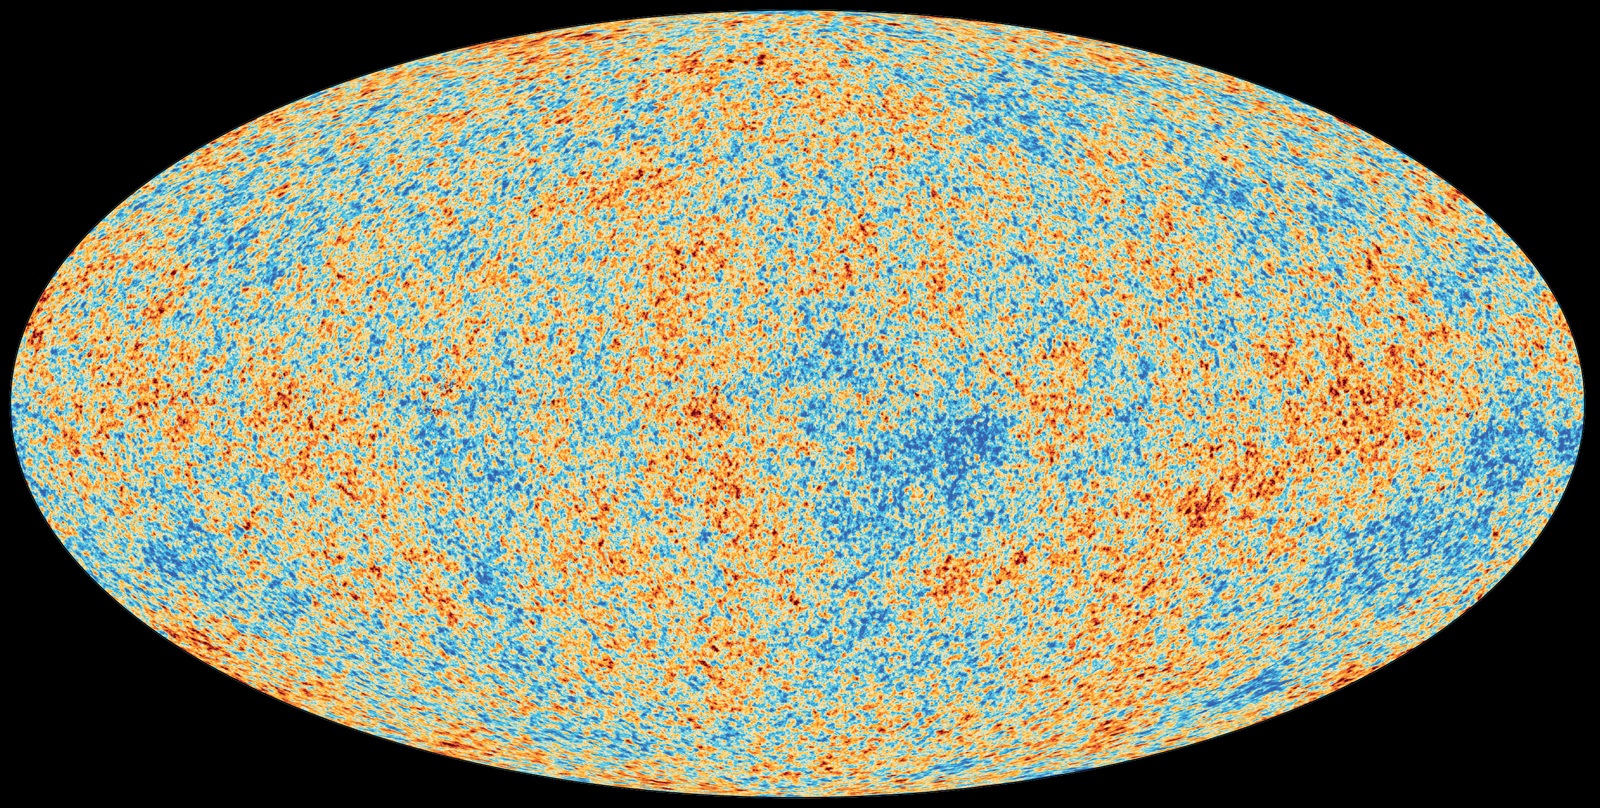
IV Cosmic Microwave Background. The most detailed map of the CMB made by the Planck satellite shows warmer and cooler patches (red and blue), which represent clumpiness of the Big Bang material some 380,000 years after the initial explosion.
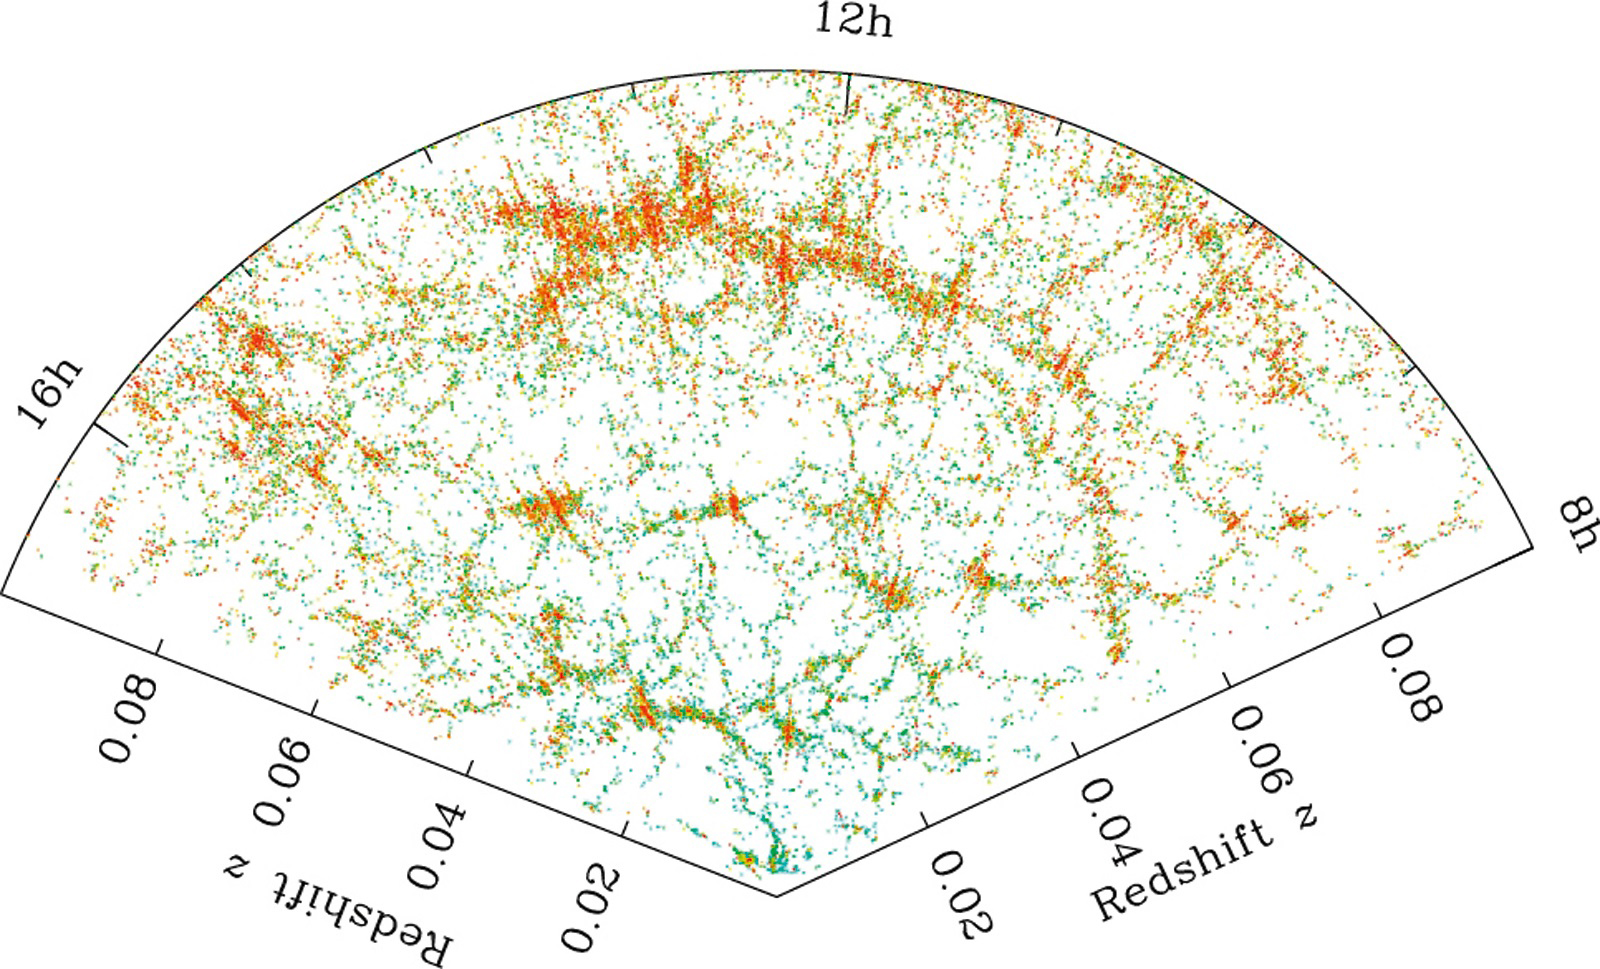
V The cosmic web. A map of the galaxies in a thin wedge of the sky, centred on the Earth and extending to 1.3 billion light years away. Galaxies form clumps, filaments, and sheets, interweaved with voids in the shapes of bubbles and tunnels.
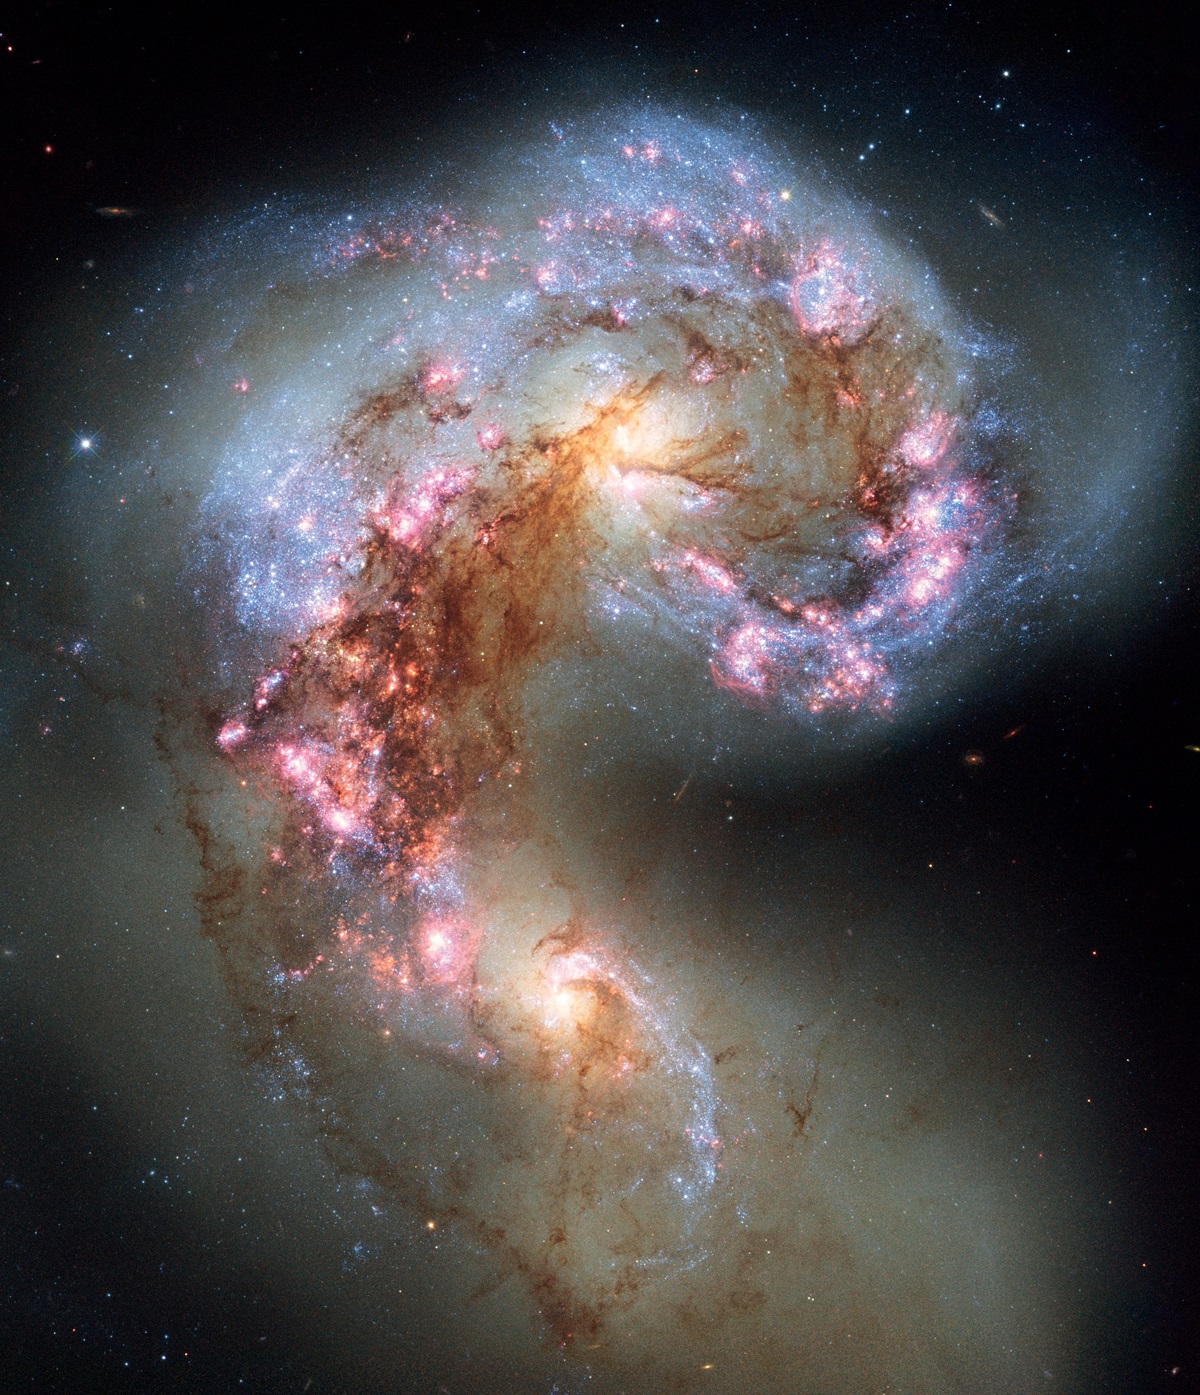
VI Antenna Galaxies. NGC 4038 and NGC 4039 were spiral galaxies, but a few hundred million years ago they began to collide violently, throwing stars out into intergalactic space and each triggering a burst in each other of bright blue stars that excite clouds of gas into bright pink and red colours. Eventually, order will be restored and the two galaxies will have transformed into one large elliptical galaxy.
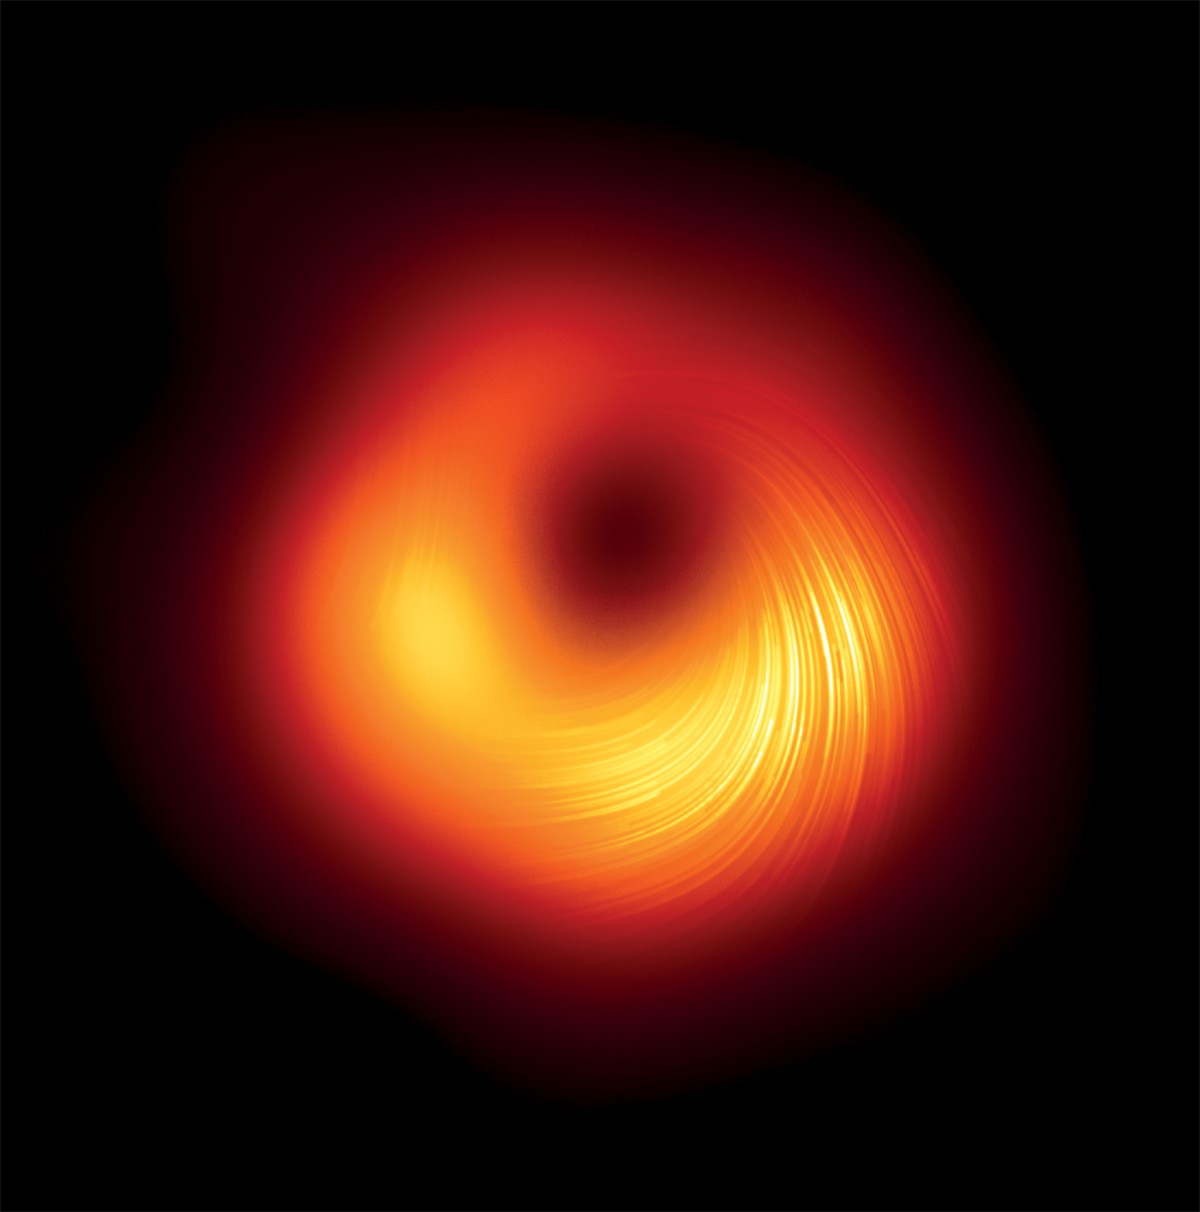
VII Black hole. A disc of hot material swirls around the supermassive black hole in the galaxy M 87. The literal black hole in the centre of the disc is
a volume devoid of material (which has all fallen on to the black hole)
and, at its very centre, the physical black hole enclosing a zone inside the event horizon, from which no radiation escapes. Spiralling streaks map
the magnetic field created by the black hole.
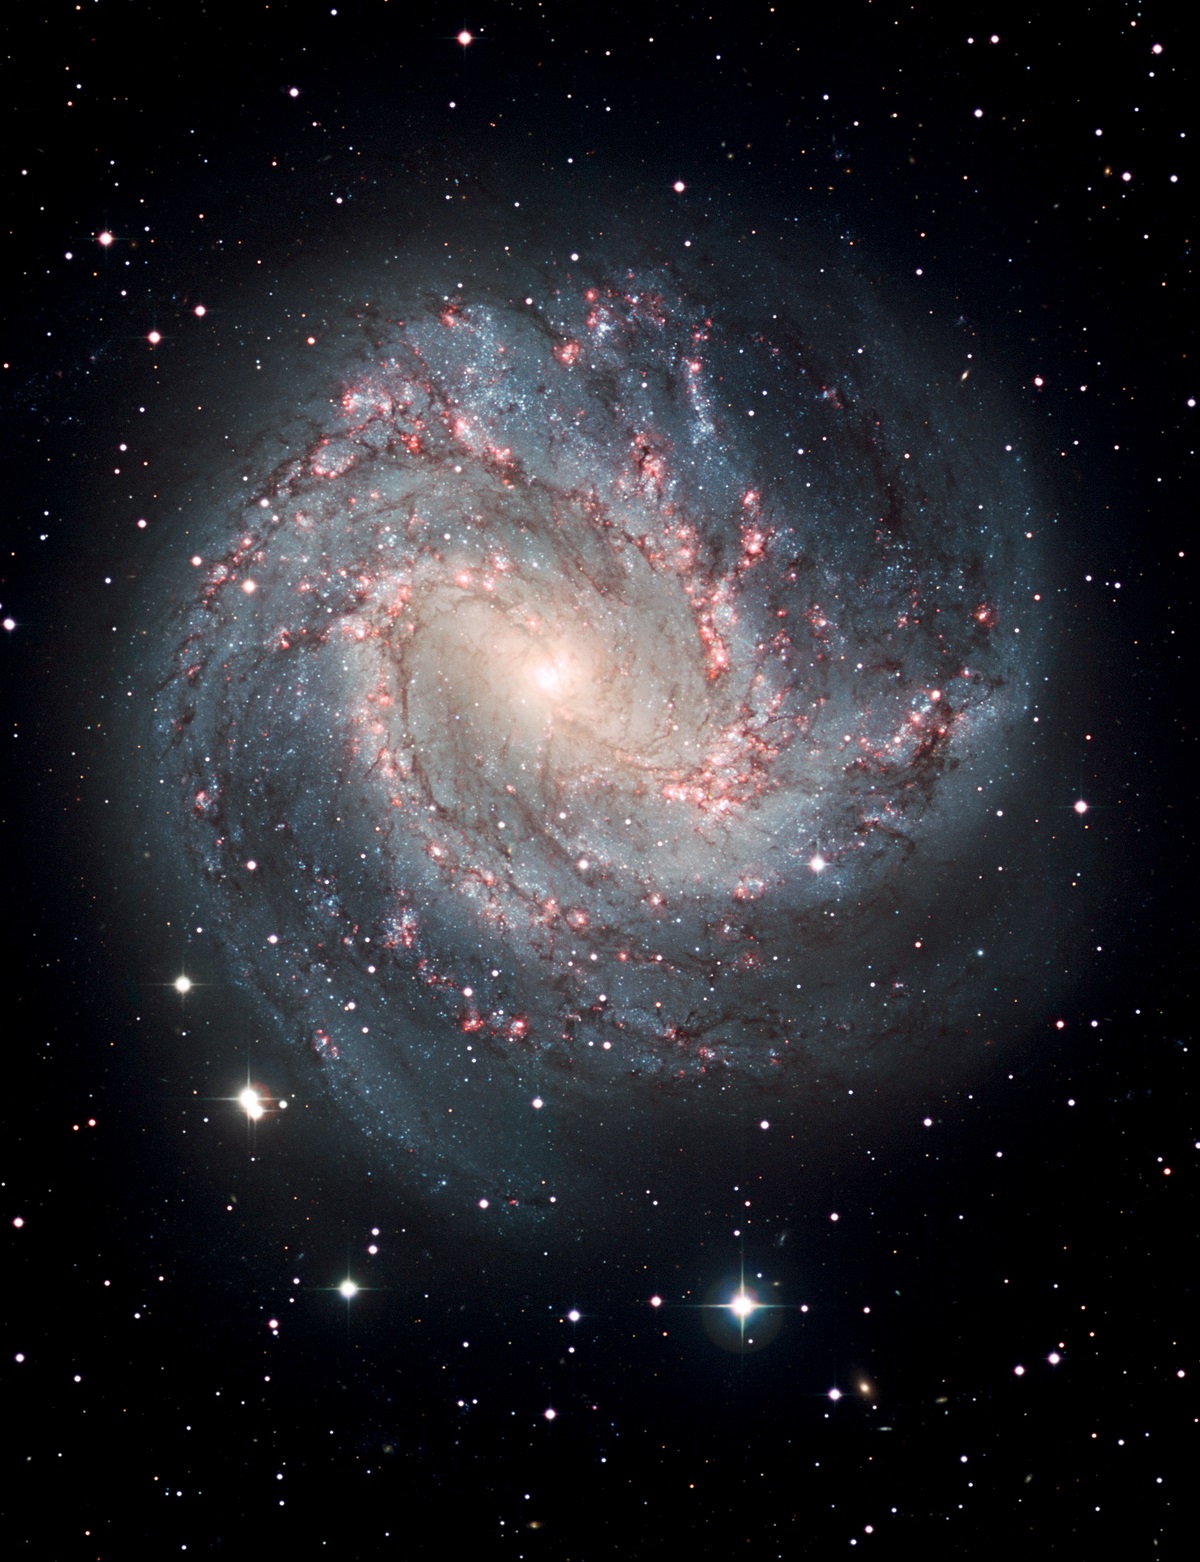
VIII M 83. This spiral galaxy is thought to mimic our own. It has two main spiral arms emanating from the ends of a central bar of stars. Dark dust clouds and pink nebulae delineate the inner edges of the spiral arms.
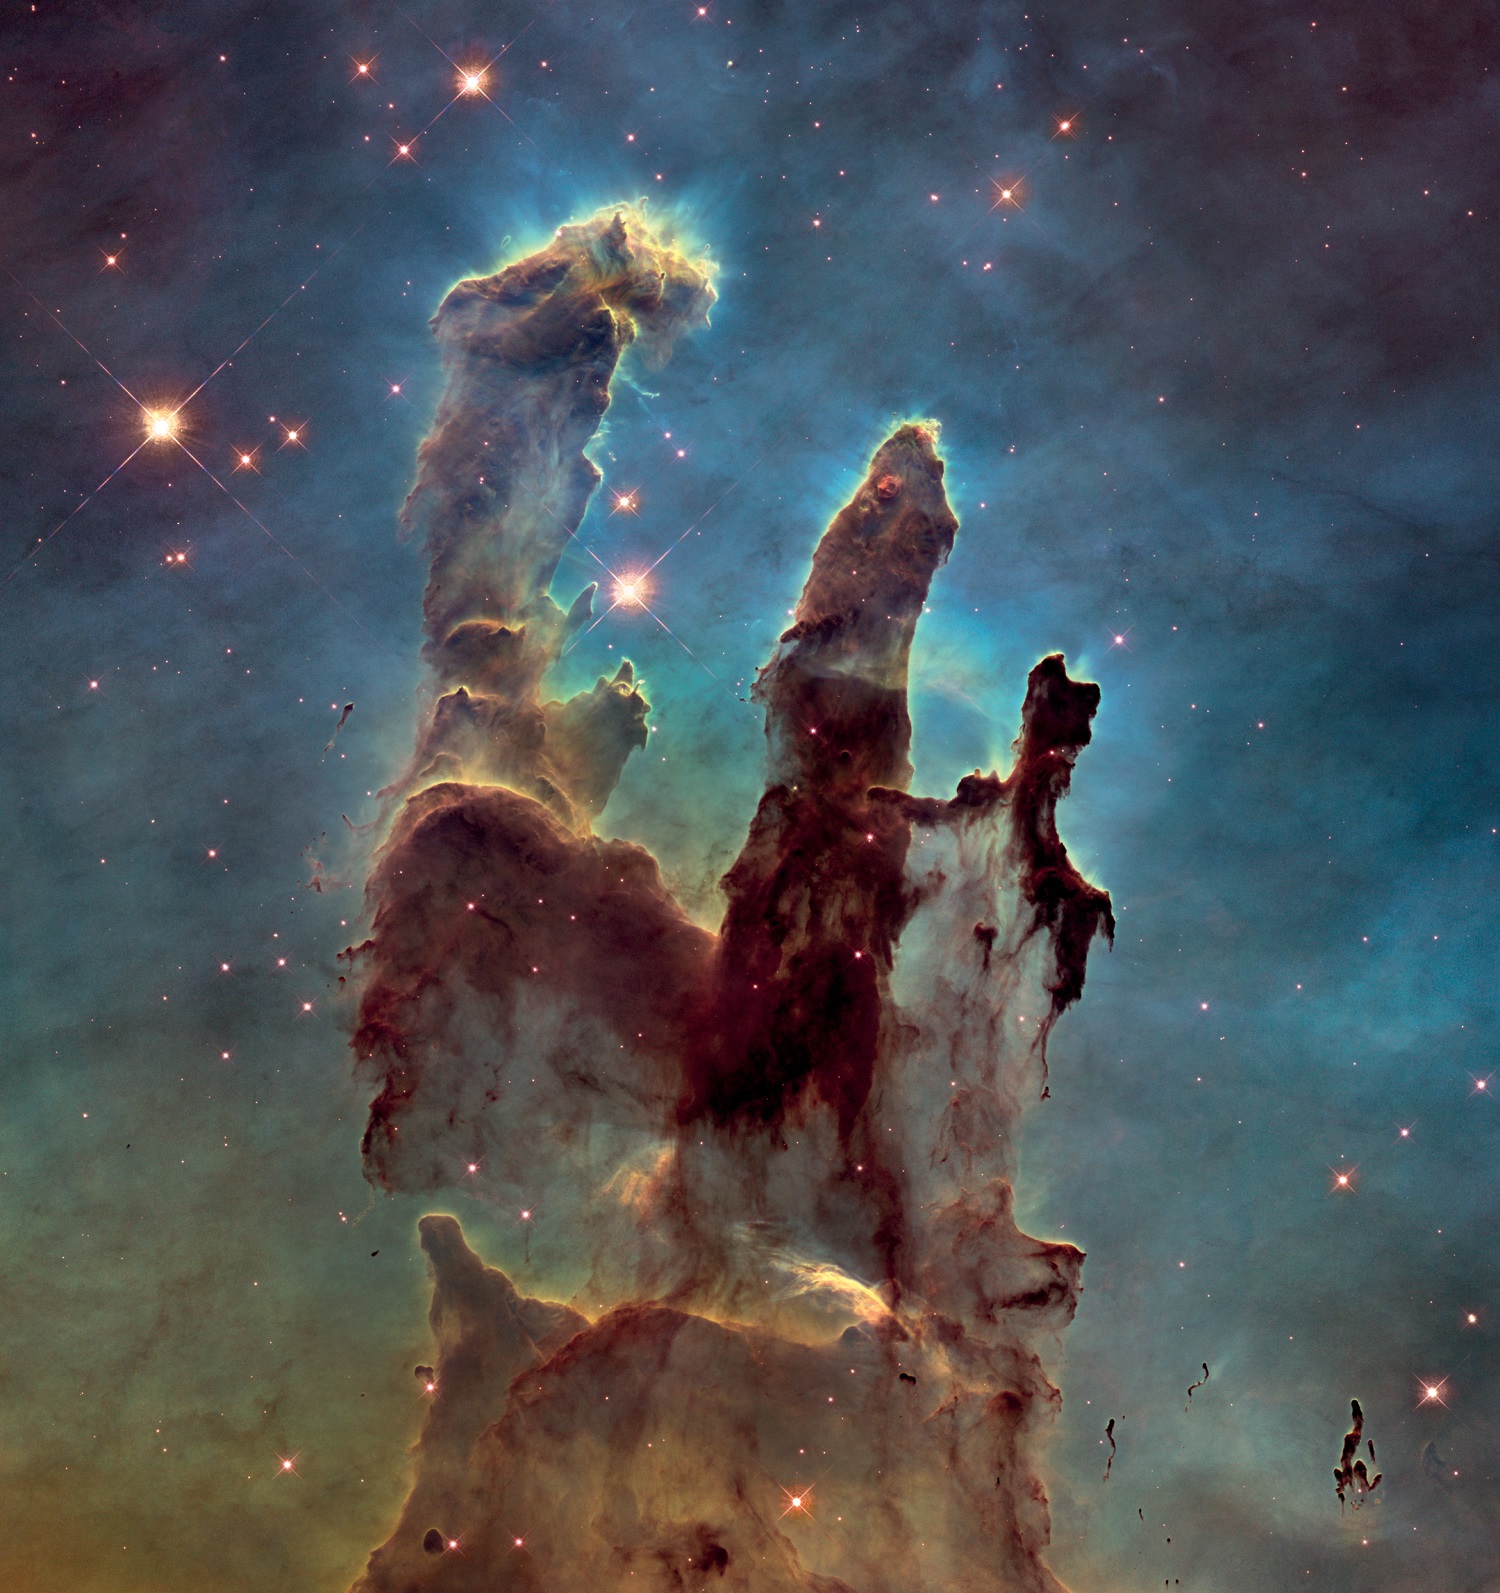
IX Pillars of Creation. Columns of gas and dust protrude from the Eagle Nebula. Newly formed stars hide in their tips. The gas and dust in the pillars is scoured by intense radiation and winds from massive, young stars nearby, eroding the surface of the pillars into wispy tendrils of cosmic dust and elephants’ trunks.
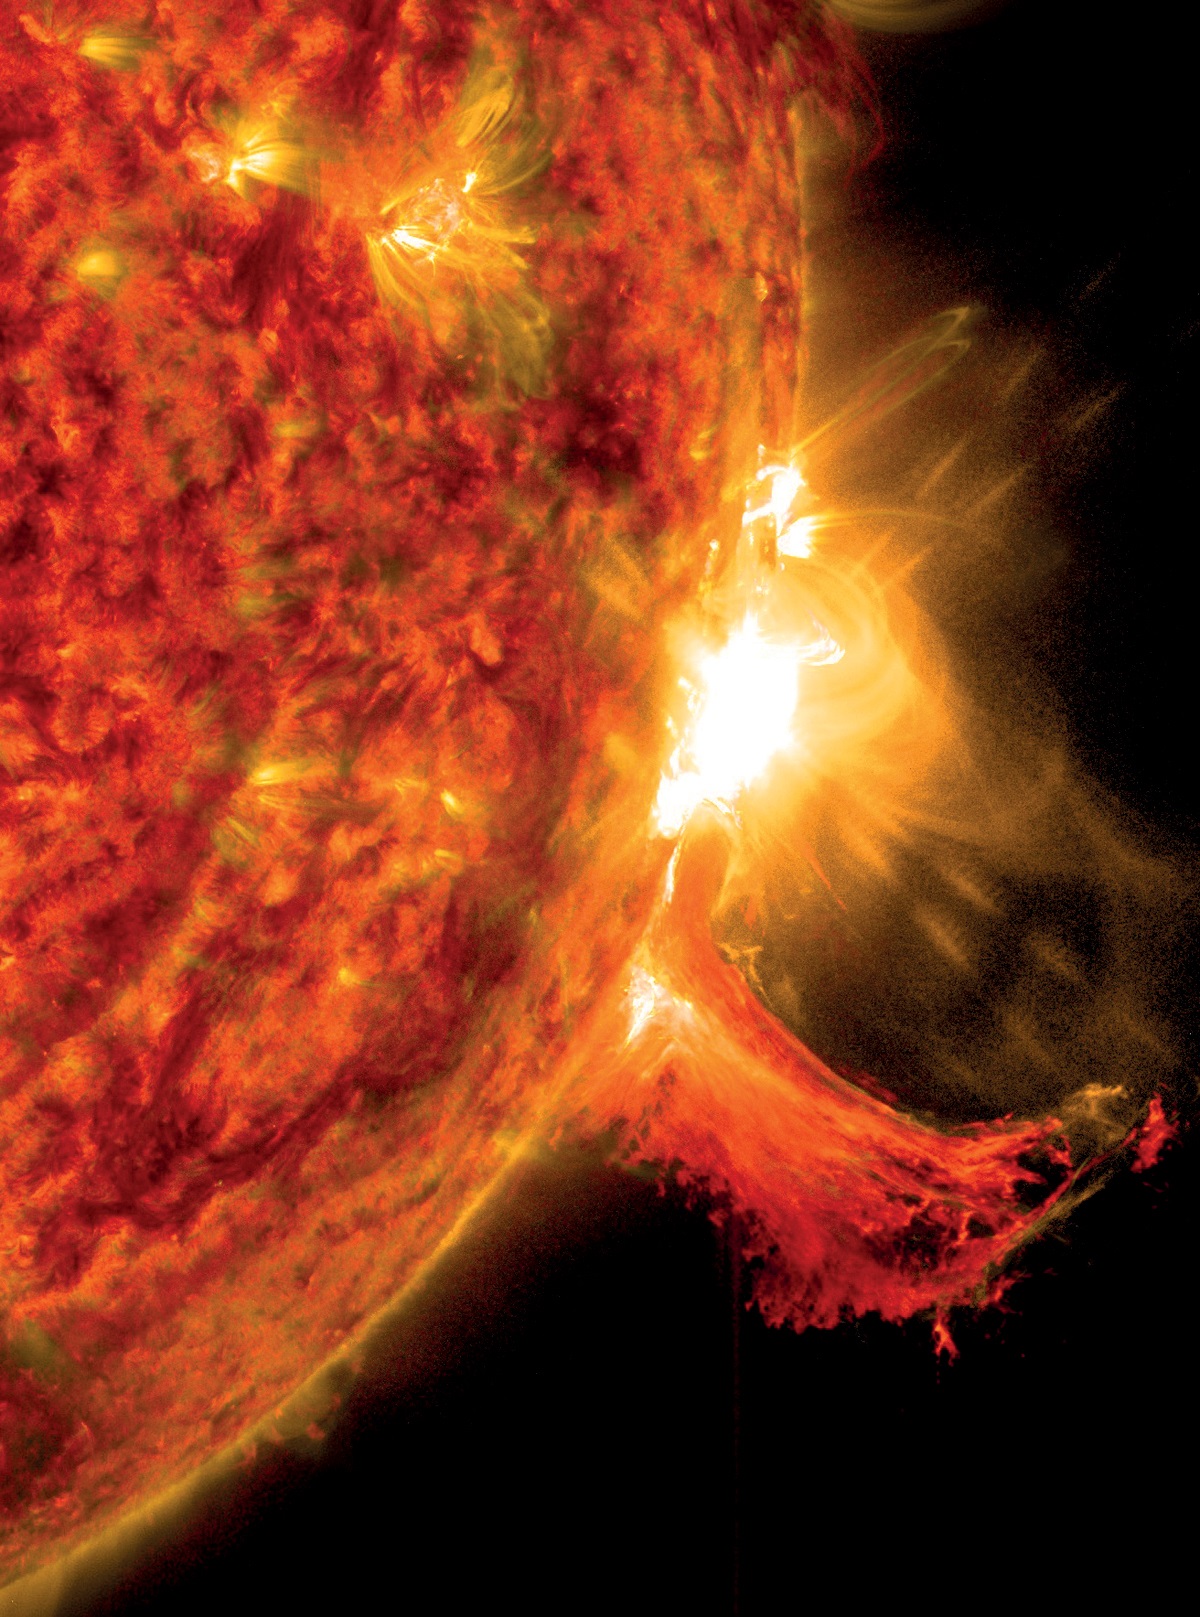
X Solar flare. The Sun emitted a mid-level solar flare on 2 October 2014, recorded as a bright burst by NASA's Solar Dynamics Observatory. The same paroxysm of the solar surface ejected solar material into interplanetary space in a prominence, which can be seen below the flare in this image.