
Sector overview
Definition
Here is the GICS® definition by MSCI and Standard & Poor’s:
The Health Care Sector includes health care providers & services, companies that manufacture and distribute health care equipments & supplies and health care technology companies. It also includes companies involved in the research, development, production and marketing of pharmaceuticals and biotechnology products.
Companies
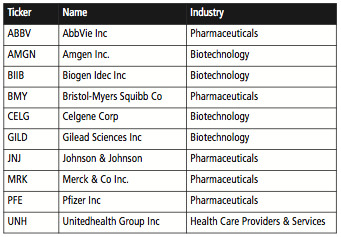
This sector contains 54 companies in the S&P 500 and 256 in the Russell 2000. Here is the list of the 10 largest capitalisations at the time of writing, arranged in alphabetical order by ticker:
Table 8.1: Stock examples: S&P 500 Health Care
S&P 500 strategy
Individually relevant factors
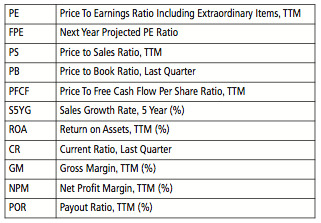
Here are the factors from my working list that are individually relevant for the S&P 500 Health Care reference set.
Table 8.2: Individually relevant factors: S&P 500 Health Care
Strategy description
This strategy uses a single valuation ratio.
Table 8.3: Strategy description: S&P 500 Health Care
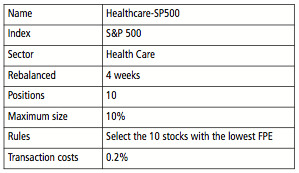
The rationalised interpretation is to select cheap stocks relative to the next year’s earnings estimate.
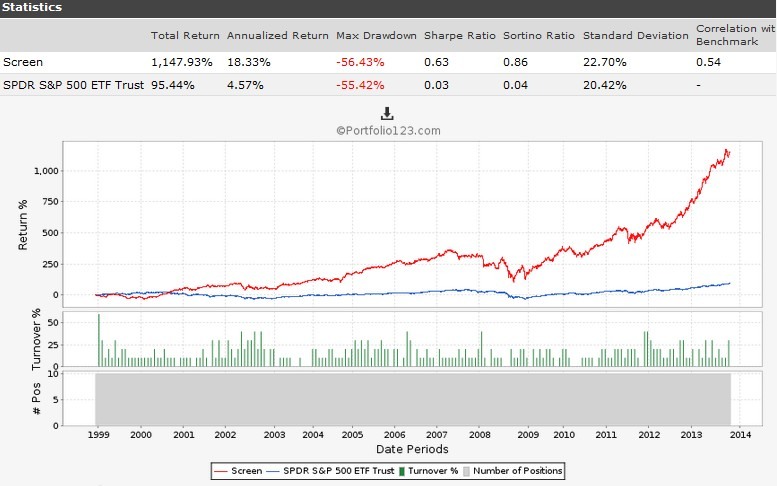
Basic simulation
Fig 8.1: Simulation data and equity curve: S&P 500 Health Care
Hedged simulation
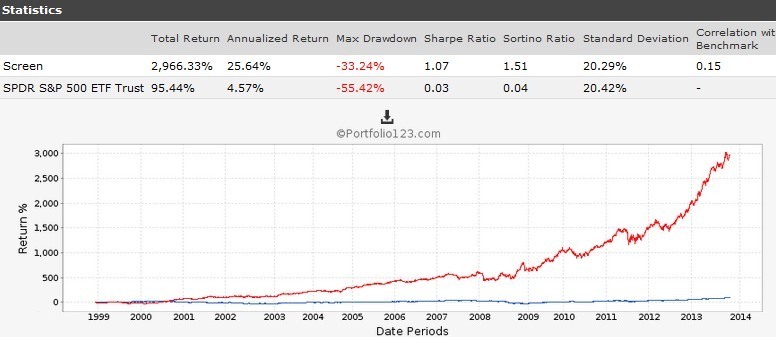
Fig 8.2: Simulation data and equity curve: S&P 500 Health Care, Hedged
Consistency
Annualised returns with hedging by five-year periods:
Table 8.4: Consistency over five-year periods

Comment
With a Sharpe ratio above 1 and a Sortino ratio above 1.5, the hedged Health care-SP500 portfolio looks very robust. Annualised returns on five-year periods are very steady, with a surge since 2009. It may be explained by two demographic factors:
These phenomena should continue to lift the sector in the next decade, with possible bubbles on the way, especially in the biotechnology industry.
Russell 2000 Strategy
Individually relevant factors
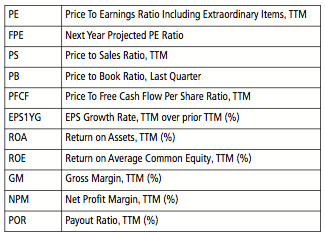
Here are the factors from my working list that are individually relevant for the Russell 2000 Health Care reference set:
Table 8.5: Individually relevant factors: Russell 2000 Health Care
Strategy description
I propose to use a single valuation ratio in this strategy.
Table 8.6: Strategy description: Russell 2000 Health Care
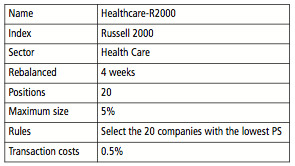
Rationalised interpretation: this strategy selects cheap companies relative to sales. Because of the reference to sales, it excludes de facto young companies that are in a pure research and development stage. It prefers companies with an existing flow of products and services.
Basic simulation
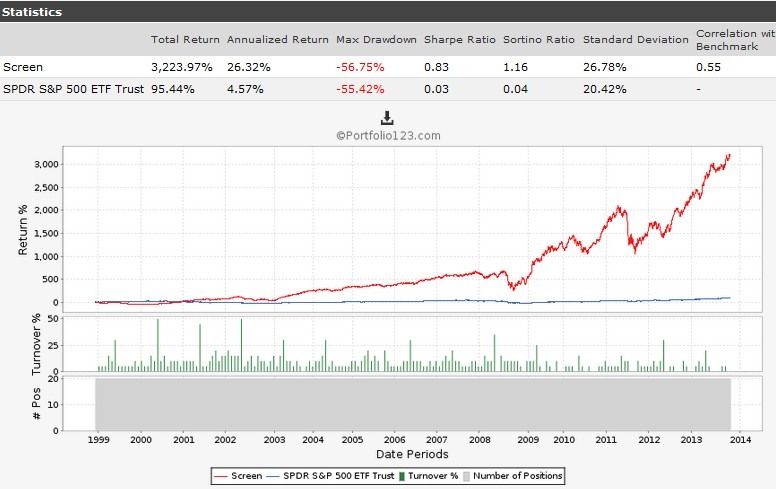
Fig 8.3: Simulation data and equity curve: Russell 2000 Health Care
Hedged simulation
Fig 8.4: Simulation data and equity curve: Russell 2000 Health Care, Hedged

Consistency
Annualised returns with hedging by five-year periods:
Table 8.7: Consistency over five-year periods

Comment
The annualised return and risk-adjusted performance are better than for the large cap strategy, at the price of a higher maximum drawdown. The five-year returns pattern is similar to large caps and amplifies the strength of the trend over the last five years – showing an impressive 46% annualised return.