
Sector overview
Definition
Here is the GICS® definition by MSCI and Standard & Poor’s:
The Energy Sector comprises companies engaged in exploration & production, refining & marketing and storage & transportation of oil & gas and coal & consumable fuels. It also includes companies that offer oil & gas equipment and services.
Companies
This sector contains 45 companies in the S&P 500 and 119 in the Russell 2000. Here is the list of the 10 largest capitalisations at the time of writing, arranged in alphabetical order by ticker.
Table 6.1: Stock examples: S&P 500 Energy

S&P 500 strategy
Individually relevant factors
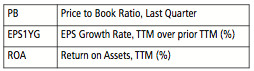
Here are the factors from my working list that are individually relevant for the S&P 500 Energy reference set:
Table 6.2: Individually relevant factors: S&P 500 Energy
Strategy description
The proposed strategy uses a single valuation ratio, as shown along with the other strategy specifics in Table 6.3.
Table 6.3: Strategy description: S&P 500 Energy

The rationalised interpretation is to select stocks that are cheap relative to the company’s accounting value.
Basic simulation
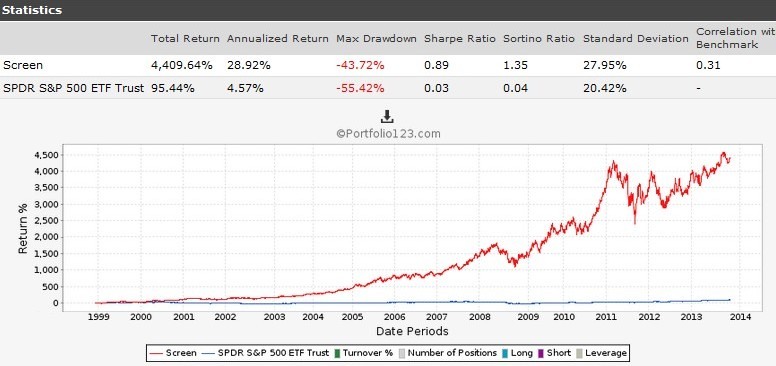
Fig 6.1: Simulation data and equity curve: S&P 500 Energy

Hedged simulation
Fig 6.2: Simulation data and equity curve: S&P 500 Energy, Hedged
Consistency
Annualised returns with hedging by five-year periods:
Table 6.4: Consistency over five-year periods

Comment
Drawdowns and standard deviations are those of a cyclical sector. A protection tactic is necessary. The annualised return is better than for Consumer Staples, but the risk-adjusted return is lower.
It is a sector theoretically sensitive to economic cycles, nevertheless the hedged version shows an impressive stability for annualised returns in the three, five-year periods. In fact, it hides big differences from one year to another, especially since 2009: 2011 was a very bad year with a large drawdown and a negative annual return.
Russell 2000 strategy
Individually relevant factors
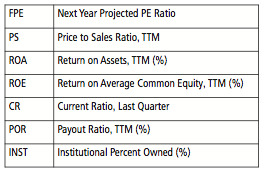
Here are the factors from my working list that are individually relevant for the Russell 2000 Energy reference set:
Table 6.5: Individually relevant factors: Russell 2000 Energy
Strategy description
The strategy uses two factors based on dividend and valuation.
Table 6.6: Strategy description: Russell 2000 Energy
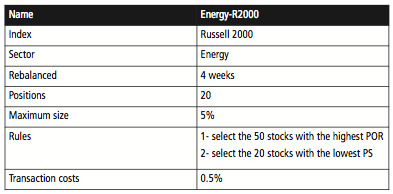
The rationalised interpretation is to select companies that are focused on shareholders’ income, and that are cheap relative to sales. This is quite typical of energy infrastructure companies.
Basic simulation
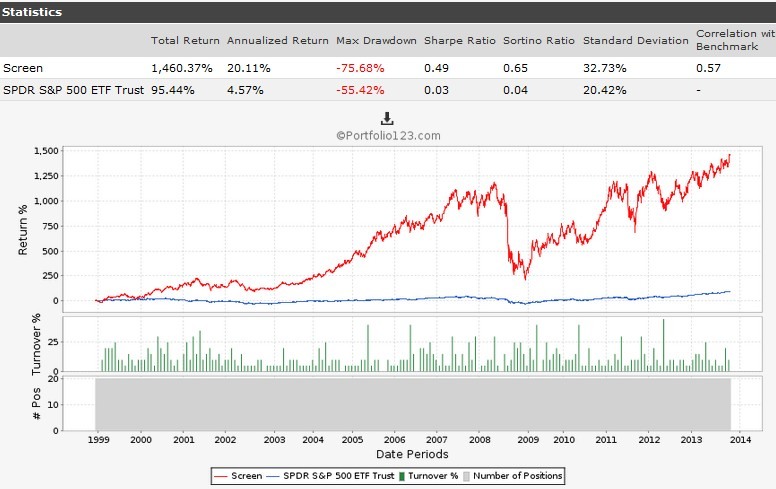
Fig 6.3: Simulation data and equity curve: Russell 2000 Energy
Hedged simulation
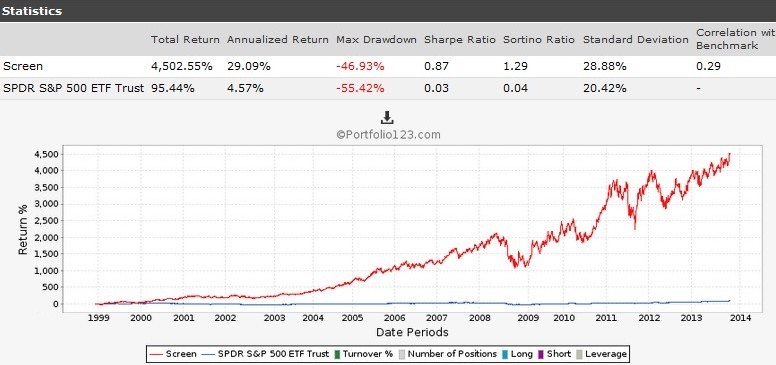
Fig 6.4: Simulation data and equity curve: Russell 2000 Energy, Hedged
Consistency
Annualised returns with hedging by five-year periods:
Table 6.7: Consistency over five-year periods

Comment
The characteristics in return and risk are not better than for the large cap strategy in the same sector. Taking a liquidity risk with small caps is not justified here. The pattern by period is the same as for large cap energy stocks: a remarkably stable annualised return for the five-year periods, with large drawdowns along the road.