
Sector overview
Definition
Here is the GICS® definition by MSCI and Standard & Poor’s:
The Financials Sector contains companies involved in banking, thrifts & mortgage finance, specialized finance, consumer finance, asset management and custody banks, investment banking and brokerage and insurance. This Sector also includes real estate companies and REITs.
Companies
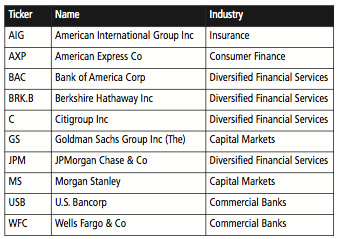
This sector contains 81 companies in the S&P 500 and 478 in the Russell 2000, making it the largest for small caps. Here is the list of the 10 largest capitalisations at the time of writing, arranged in alphabetical order by ticker:
Table 7.1: Stock examples: S&P 500 Financials
S&P 500 strategy
Individually relevant factors
Here are the factors from my working list that are individually relevant for the S&P 500 Financials reference set:
Table 7.2: Individually relevant factors: S&P 500 Financials

Strategy description
I propose a strategy using only the most famous valuation ratio: price to earnings.
Table 7.3: Strategy description: S&P 500 Financials

This rule selects the cheapest companies relative to their earnings.
Basic simulation
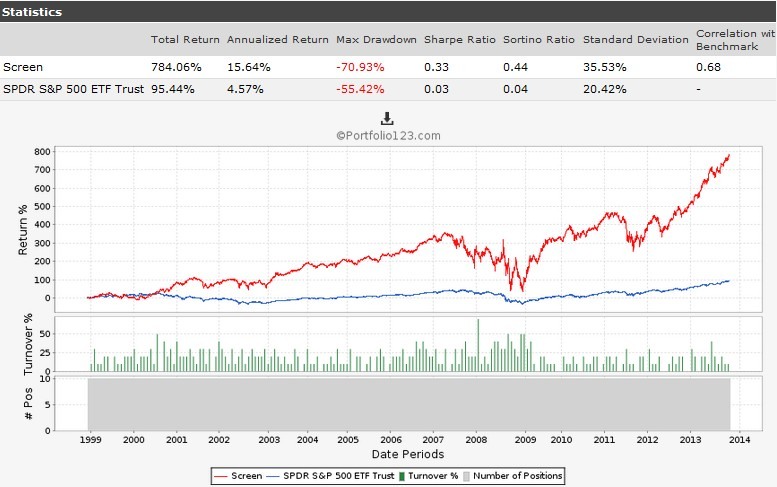
Fig 7.1: Simulation data and equity curve: S&P 500 Financials
Hedged simulation
Fig 7.2: Simulation data and equity curve: S&P 500 Financials, Hedged

Consistency
Annualised returns with hedging by five-year periods:
Table 7.4: Consistency over five-year periods

Comment
Financial stocks are volatile in market downturns. Even in its hedged version, the portfolio shows deep drawdowns. The five-year annualised returns remain high, with a dip in the middle period due to the 2008 financial crisis. But on a yearly basis, 2011 was worse than 2008 for the hedged version. Hedging was triggered by the timing indicators in 2008, not in 2011. When this happens, a 20% market correction may be more harmful than a 50% crash. Both the first and the last periods are above 25%, which can be considered indicative of the robustness over the long term.
Russell 2000 Strategy
Individually relevant factors
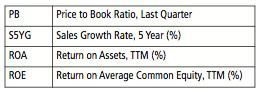
Here are the factors from my working list that are individually relevant for the Russell 2000 Financials reference set:
Table 7.5: Individually relevant factors: Russell 2000 Financials
Strategy description
I propose a strategy using a single profitability ratio.
Table 7.6: Strategy description: Russell 2000 Financials

The rationalised interpretation is to pick the most profitable companies relative to their assets.
Basic simulation
Fig 7.3: Simulation data and equity curve: Russell 2000 Financials

Hedged simulation
Fig 7.4: Simulation data and equity curve: Russell 2000 Financials, Hedged

Consistency
Annualised returns with hedging by five-year periods:
Table 7.7: Consistency over five-year periods

Comment
In Financials, it seems that smaller is safer. The small cap portfolio has a lower risk in drawdown and volatility, and has a better risk-adjusted performance measured by the Sortino ratio. The five-year returns pattern is different from large caps: the return is much lower in the middle period. However, it recovers in the last period.